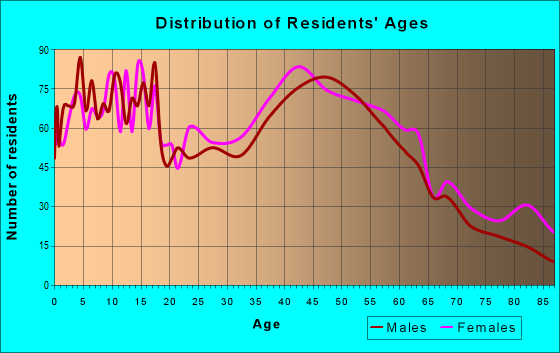
Estimated zip code population in 2022: 10,464 Zip code population in 2010: 9,733 Zip code population in 2000: 8,497
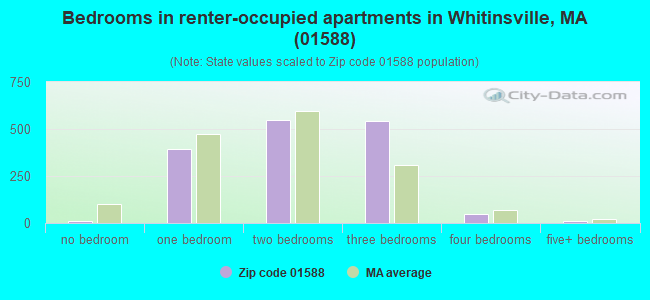
Houses and condos: 4,457 Renter-occupied apartments: 1,556
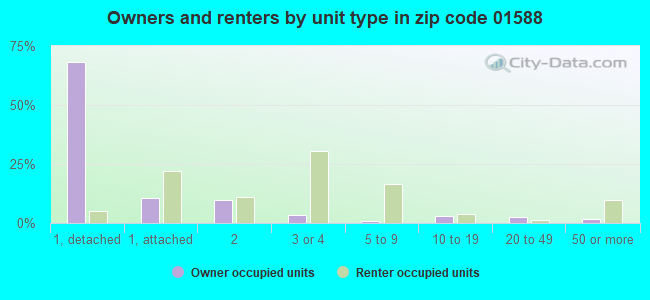
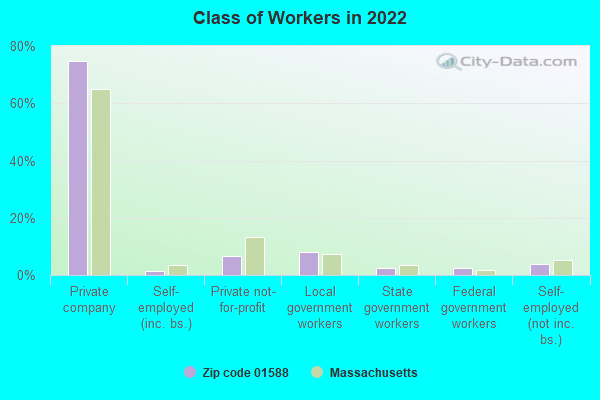
% of renters here:
37%
State:
38%
March 2022 cost of living index in zip code 01588: 125.8 (high, U.S. average is 100)
Land area: 8.6 sq. mi. Water area: 0.6 sq. mi.
Population density: 1,215 people per square mile
(low).
OSM Map
Google Map
MSN Map
OSM Map
General Map
Google Map
MSN Map
OSM Map
Google Map
MSN Map
OSM Map
Google Map
MSN Map
Please wait while loading the map...
Real estate property taxes paid for housing units in 2022:
This zip code:
1.1% ($4,286)
Massachusetts:
1.0% ($5,536)
Median real estate property taxes paid for housing units with mortgages in 2022: $4,415 (1.1%) Median real estate property taxes paid for housing units with no mortgage in 2022: $3,319 (1.0%)
Averages for the 2020 tax year for zip code 01588, filed in 2021:
Average Adjusted Gross Income (AGI) in 2020: $84,215 (Individual Income Tax Returns)
Here:
$84,215
State:
$105,130
Salary/wage: $65,688 (reported on 85.3% of returns)
Here:
$65,688
State:
$82,951
(% of AGI for various income ranges: 1107.1% for AGIs below $25k, 3580.2% for AGIs $25k-50k, 6634.3% for AGIs $50k-75k, 9493.7% for AGIs $75k-100k, 18592.3% for AGIs $100k-200k, 76573.3% for AGIs over 200k)
Taxable interest for individuals: $806 (reported on 34.6% of returns)
This zip code:
$806
Massachusetts:
$2,361
(% of AGI for various income ranges: 16.7% for AGIs below $25k, 17.7% for AGIs $25k-50k, 30.8% for AGIs $50k-75k, 33.9% for AGIs $75k-100k, 53.9% for AGIs $100k-200k, 577.8% for AGIs over 200k)
Ordinary dividends: $2,730 (reported on 18.2% of returns)
Here:
$2,730
State:
$10,365
(% of AGI for various income ranges: 23.2% for AGIs below $25k, 19.9% for AGIs $25k-50k, 30.5% for AGIs $50k-75k, 38.7% for AGIs $75k-100k, 138.9% for AGIs $100k-200k, 1221.1% for AGIs over 200k)
Net capital gain/loss in AGI: +$10,099 (reported on 16.0% of returns)
Here:
+$10,099
State:
+$48,178
(% of AGI for various income ranges: 8.2% for AGIs below $25k, 20.5% for AGIs $25k-50k, 87.4% for AGIs $50k-75k, 54.5% for AGIs $75k-100k, 391.2% for AGIs $100k-200k, 5920.0% for AGIs over 200k)
Profit/loss from business: +$17,866 (reported on 12.0% of returns)
Here:
+$17,866
State:
+$20,792
(% of AGI for various income ranges: 103.1% for AGIs below $25k, 109.0% for AGIs $25k-50k, 109.0% for AGIs $50k-75k, 274.2% for AGIs $75k-100k, 595.3% for AGIs $100k-200k, 4714.4% for AGIs over 200k)
Taxable individual retirement arrangement distribution: $15,788 (reported on 9.2% of returns)
01588:
$15,788
Massachusetts:
$22,790
(% of AGI for various income ranges: 78.4% for AGIs below $25k, 95.3% for AGIs $25k-50k, 188.4% for AGIs $50k-75k, 356.8% for AGIs $75k-100k, 447.4% for AGIs $100k-200k, 1072.2% for AGIs over 200k)
Self-employed (Keogh) retirement plans: $19,267 (reported on 0.6% of returns)
01588:
$19,267
Massachusetts:
$26,868
(% of AGI for various income ranges: 101.4% for AGIs $100k-200k)
Total itemized deductions: $29,508 (reported on 9.8% of returns)
Here:
$29,508
State:
$36,722
(% of AGI for various income ranges: 149.4% for AGIs $25k-50k, 271.0% for AGIs $50k-75k, 467.1% for AGIs $75k-100k, 787.5% for AGIs $100k-200k, 6575.6% for AGIs over 200k)
Charity contributions: $10,742 (reported on 7.1% of returns)
Here:
$10,742
State:
$12,529
(% of AGI for various income ranges: 12.3% for AGIs $25k-50k, 23.4% for AGIs $50k-75k, 57.6% for AGIs $75k-100k, 149.6% for AGIs $100k-200k, 3047.8% for AGIs over 200k)
Taxes paid: $8,304 (reported on 9.8% of returns)
01588:
$8,304
State:
$8,782
(% of AGI for various income ranges: 27.9% for AGIs $25k-50k, 92.0% for AGIs $50k-75k, 173.9% for AGIs $75k-100k, 292.6% for AGIs $100k-200k, 1273.3% for AGIs over 200k)
Earned income credit: $1,843 (reported on 10.0% of returns)
Here:
$1,843
State:
$1,909
(% of AGI for various income ranges: 54.8% for AGIs below $25k, 44.7% for AGIs $25k-50k)
Percentage of individuals using paid preparers for their 2020 taxes: 92.1%
Here:
92%
State:
92%
(% for various income ranges: 89.6% for AGIs below $25k, 93.7% for AGIs $25k-50k, 94.0% for AGIs $50k-75k, 90.7% for AGIs $75k-100k, 92.6% for AGIs $100k-200k, 93.1% for AGIs over 200k)
Averages for the 2012 tax year for zip code 01588, filed in 2013:
Average Adjusted Gross Income (AGI) in 2012: $61,293 (Individual Income Tax Returns)
Here:
$61,293
State:
$81,425
Salary/wage: $55,368 (reported on 87.2% of returns)
Here:
$55,368
State:
$64,752
(% of AGI for various income ranges: 73.2% for AGIs below $25k, 77.9% for AGIs $25k-50k, 79.4% for AGIs $50k-75k, 81.8% for AGIs $75k-100k, 84.5% for AGIs $100k-200k, 68.1% for AGIs over 200k)
Taxable interest for individuals: $724 (reported on 44.9% of returns)
This zip code:
$724
Massachusetts:
$2,136
(% of AGI for various income ranges: 1.2% for AGIs below $25k, 0.5% for AGIs $25k-50k, 0.5% for AGIs $50k-75k, 0.3% for AGIs $75k-100k, 0.3% for AGIs $100k-200k, 1.0% for AGIs over 200k)
Ordinary dividends: $1,892 (reported on 20.9% of returns)
Here:
$1,892
State:
$9,473
(% of AGI for various income ranges: 1.2% for AGIs below $25k, 0.7% for AGIs $25k-50k, 0.3% for AGIs $50k-75k, 0.5% for AGIs $75k-100k, 0.6% for AGIs $100k-200k, 0.8% for AGIs over 200k)
Net capital gain/loss in AGI: +$8,647 (reported on 14.9% of returns)
Here:
+$8,647
State:
+$31,437
(% of AGI for various income ranges: 0.3% for AGIs $50k-75k, 0.1% for AGIs $75k-100k, 0.6% for AGIs $100k-200k, 10.6% for AGIs over 200k)
Profit/loss from business: +$17,856 (reported on 11.5% of returns)
Here:
+$17,856
State:
+$20,662
(% of AGI for various income ranges: 4.8% for AGIs below $25k, 3.2% for AGIs $25k-50k, 3.0% for AGIs $50k-75k, 2.8% for AGIs $75k-100k, 3.8% for AGIs $100k-200k, 2.7% for AGIs over 200k)
Taxable individual retirement arrangement distribution: $10,954 (reported on 9.8% of returns)
01588:
$10,954
Massachusetts:
$18,892
(% of AGI for various income ranges: 3.4% for AGIs below $25k, 2.8% for AGIs $25k-50k, 2.4% for AGIs $50k-75k, 2.1% for AGIs $75k-100k, 1.5% for AGIs $100k-200k)
Self-employment retirement plans: $19,300 (reported on 0.4% of returns)
01588:
$19,300
Massachusetts:
$20,669
Total itemized deductions: $24,192 (22% of AGI, reported on 37.4% of returns)
Here:
$24,192
State:
$28,907
Here:
22.1% of AGI
State:
18.2% of AGI
(% of AGI for various income ranges: 8.6% for AGIs below $25k, 8.9% for AGIs $25k-50k, 12.1% for AGIs $50k-75k, 14.6% for AGIs $75k-100k, 15.7% for AGIs $100k-200k, 22.2% for AGIs over 200k)
Charity contributions: $3,396 (reported on 29.6% of returns)
Here:
$3,396
State:
$4,208
(% of AGI for various income ranges: 0.6% for AGIs below $25k, 0.7% for AGIs $25k-50k, 1.0% for AGIs $50k-75k, 1.3% for AGIs $75k-100k, 1.6% for AGIs $100k-200k, 3.7% for AGIs over 200k)
Taxes paid: $8,835 (reported on 37.4% of returns)
01588:
$8,835
State:
$13,303
(% of AGI for various income ranges: 2.0% for AGIs below $25k, 2.6% for AGIs $25k-50k, 4.2% for AGIs $50k-75k, 5.8% for AGIs $75k-100k, 7.0% for AGIs $100k-200k, 6.5% for AGIs over 200k)
Earned income credit: $2,068 (reported on 12.6% of returns)
Here:
$2,068
State:
$1,971
(% of AGI for various income ranges: 4.8% for AGIs below $25k, 0.8% for AGIs $25k-50k)
Percentage of individuals using paid preparers for their 2012 taxes: 49.8%
Here:
50%
State:
56%
(% for various income ranges: 42.5% for AGIs below $25k, 50.0% for AGIs $25k-50k, 52.9% for AGIs $50k-75k, 56.0% for AGIs $75k-100k, 55.7% for AGIs $100k-200k, 62.5% for AGIs over 200k)
Averages for the 2004 tax year for zip code 01588, filed in 2005:
Average Adjusted Gross Income (AGI) in 2004: $51,544 (Individual Income Tax Returns)
Here:
$51,544
State:
$62,877
Salary/wage: $46,957 (reported on 88.3% of returns)
Here:
$46,957
State:
$52,969
(% of AGI for various income ranges: 104.8% for AGIs below $10k, 72.5% for AGIs $10k-25k, 83.6% for AGIs $25k-50k, 85.7% for AGIs $50k-75k, 86.6% for AGIs $75k-100k, 73.6% for AGIs over 100k)
Taxable interest for individuals: $725 (reported on 58.1% of returns)
This zip code:
$725
Massachusetts:
$1,945
(% of AGI for various income ranges: 4.7% for AGIs below $10k, 1.9% for AGIs $10k-25k, 0.7% for AGIs $25k-50k, 0.6% for AGIs $50k-75k, 0.6% for AGIs $75k-100k, 0.8% for AGIs over 100k)
Taxable dividends: $1,499 (reported on 24.0% of returns)
Here:
$1,499
State:
$5,323
(% of AGI for various income ranges: 2.6% for AGIs below $10k, 0.8% for AGIs $10k-25k, 0.5% for AGIs $25k-50k, 0.5% for AGIs $50k-75k, 0.6% for AGIs $75k-100k, 0.9% for AGIs over 100k)
Net capital gain/loss: +$4,630 (reported on 18.0% of returns)
Here:
+$4,630
State:
+$20,377
(% of AGI for various income ranges: -0.7% for AGIs below $10k, -0.0% for AGIs $10k-25k, 0.3% for AGIs $25k-50k, 0.2% for AGIs $50k-75k, 1.1% for AGIs $75k-100k, 3.7% for AGIs over 100k)
Profit/loss from business: +$15,920 (reported on 12.8% of returns)
Here:
+$15,920
State:
+$17,837
(% of AGI for various income ranges: 4.2% for AGIs below $10k, 5.4% for AGIs $10k-25k, 3.9% for AGIs $25k-50k, 2.5% for AGIs $50k-75k, 2.2% for AGIs $75k-100k, 5.4% for AGIs over 100k)
IRA payment deduction: $2,954 (reported on 2.1% of returns)
01588:
$2,954
Massachusetts:
$3,100
(% of AGI for various income ranges: 0.2% for AGIs $25k-50k, 0.1% for AGIs $50k-75k, 0.1% for AGIs $75k-100k, 0.1% for AGIs over 100k)
Self-employed pension: $9,433 (reported on 0.7% of returns)
Here:
$9,433
Massachusetts:
$14,516
Total itemized deductions: $19,021 (21% of AGI, reported on 39.6% of returns)
Here:
$19,021
State:
$22,573
Here:
21.4% of AGI
State:
19.5% of AGI
(% of AGI for various income ranges: 7.9% for AGIs below $10k, 7.5% for AGIs $10k-25k, 10.2% for AGIs $25k-50k, 16.2% for AGIs $50k-75k, 18.1% for AGIs $75k-100k, 15.8% for AGIs over 100k)
Charity contributions deductions: $2,636 (3% of AGI, reported on 36.1% of returns)
Here:
$2,636
State:
$3,295
Here:
2.9% of AGI
State:
2.7% of AGI
(% of AGI for various income ranges: 0.6% for AGIs below $10k, 0.8% for AGIs $10k-25k, 1.0% for AGIs $25k-50k, 1.7% for AGIs $50k-75k, 2.0% for AGIs $75k-100k, 2.5% for AGIs over 100k)
Total tax: $7,226 (reported on 81.9% of returns)
01588:
$7,226
State:
$11,494
(% of AGI for various income ranges: 2.3% for AGIs below $10k, 4.8% for AGIs $10k-25k, 7.8% for AGIs $25k-50k, 8.4% for AGIs $50k-75k, 9.6% for AGIs $75k-100k, 17.4% for AGIs over 100k)
Earned income credit: $1,526 (reported on 9.2% of returns)
Here:
$1,526
State:
$1,518
Percentage of individuals using paid preparers for their 2004 taxes: 50.1%
Here:
50%
State:
58%
(% for various income ranges: 40.3% for AGIs below $10k, 48.4% for AGIs $10k-25k, 49.4% for AGIs $25k-50k, 54.2% for AGIs $50k-75k, 58.0% for AGIs $75k-100k, 55.2% for AGIs over 100k)
Household received Food Stamps/SNAP in the past 12 months: 584 Household did not receive Food Stamps/SNAP in the past 12 months: 3,610
Women who had a birth in the past 12 months: 149 (56 now married, 83 unmarried) Women who did not have a birth in the past 12 months: 2,318 (869 now married, 1,447 unmarried)
Housing units in zip code 01588 with a mortgage: 2,061 (382 second mortgage, 389 both second mortgage and home equity loan) Houses without a mortgage: 53
Median monthly owner costs for units with a mortgage: $2,141 Median monthly owner costs for units without a mortgage: $745
Residents with income below the poverty level in 2022:
This zip code:
9.1%
Whole state:
10.4%
Residents with income below 50% of the poverty level in 2022:
This zip code:
4.5%
Whole state:
5.1%
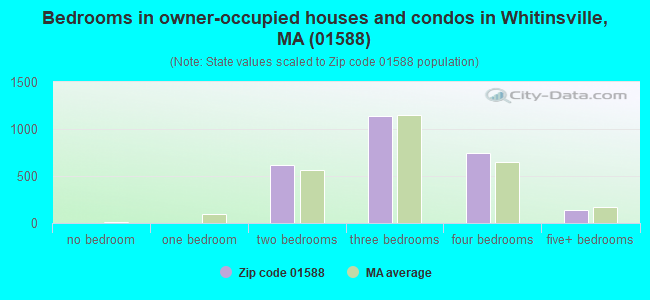
Median number of rooms in houses and condos:
Here:
6.6
State:
6.5
Median number of rooms in apartments:
Here:
4.5
State:
4.0
Notable locations in this zip code not listed on our city pages
Churches in zip code 01588 include: Whitinsville United Methodist Church (A), Village Congregational Church (B), Trinity Episcopal Church (C), Pleasant Street Christian Reformed Church (D), Northbridge Centre Congregational Church (E), Fairlawn Christian Church (F), Armenian Apostolic Church (G). Display/hide their locations on the map
In group quarters: 112 (-1 institutionalized population)
Size of family households: 1,223 2-persons, 661 3-persons, 462 4-persons, 151 5-persons, 216 6-persons, 26 7-or-more-persons
Size of nonfamily households: 988 1-person, 447 2-persons, 32 3-persons
1,296 married couples with children.
658 single-parent households (183 men, 475 women).
88.5% of residents of 01588 zip code speak English at home.
8.4% of residents speak Spanish at home (59% very well, 22% well, 19% not well).
2.0% of residents speak other Indo-European language at home (70% very well, 15% well, 8% not well, 6% not at all).
0.3% of residents speak Asian or Pacific Island language at home (42% very well, 58% not well).
Foreign born population: 587 (5.6%) (62.5% of them are naturalized citizens)
This zip code:
5.6%
Whole state:
18.0%
30%Peru
24%Honduras
16%Bolivia
13%Chile
7%Argentina
6%Sweden
6%United Kingdom, excluding England and Scotland
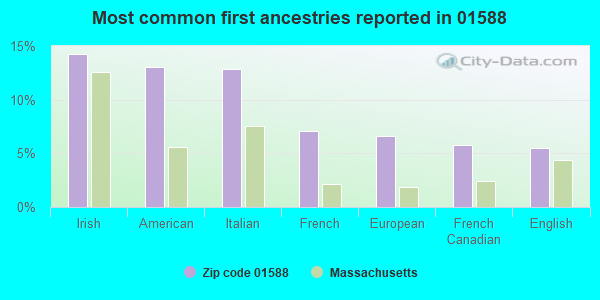
14%Irish
13%American
13%Italian
7%French
7%European
6%French Canadian
5%English
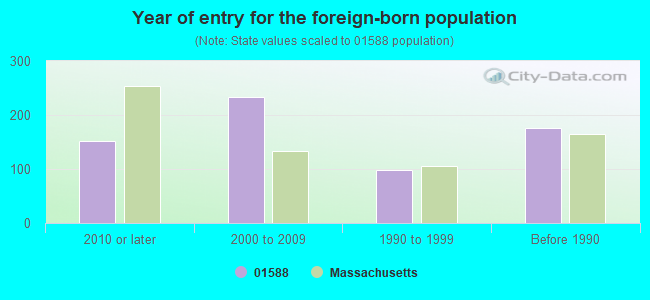
Year of entry for the foreign-born population
1512010 or later
2342000 to 2009
981990 to 1999
176Before 1990
Facilities with environmental interests located in this zip code:
NORTHBRIDGE MIDDLE SCHOOL (171 LINWOOD AVE in WHITINSVILLE, MA)
AIR MINOR (AIRS/AFS) (National Center for Education Statistics) - STATE ID-214305 CRITERIA AND HAZARDOUS AIR POLLUTANT INVENTORY (Inventory of air pollution sources) Business SIC classification: ELEMENTARY AND SECONDARY SCHOOLS Alternative names: JUNIOR SENIOR HIGH S
ALDRICH SCHOOL (14 HILL STREET in WHITINSVILLE, MA)
(Geographic Names Information System) (National Center for Education Statistics) - STATE ID-214010 Organizations: NORTHBRIDGE (SCHOOL DISTRICT)
NORTHBRIDGE PRIMARY SCH (30 CROSS STREET in WHITINSVILLE, MA)
(Geographic Names Information System) (National Center for Education Statistics) - STATE ID-214020
NORTHBRIDGE HIGH (427 LINWOOD AVENUE in WHITINSVILLE, MA)
(National Center for Education Statistics) - STATE ID-214505
EASTERN ACOUSTIC WORKS (1 MAIN ST in WHITINSVILLE, MA)
AIR MINOR (AIRS/AFS) AIR SYNTHETIC MINOR (AIRS/AFS) CRITERIA AND HAZARDOUS AIR POLLUTANT INVENTORY (Inventory of air pollution sources) Alternative names: EASTERN ACOUSTIC WKS
ALTERNATIVES UNLIMITED (54 DOUGLAS ROAD in WHITINSVILLE, MA)
AIR MINOR (AIRS/AFS) Business SIC classification: GENERAL WAREHOUSING AND STORAGE
M H P G INCORPORATED (355 MAIN STREET in WHITINSVILLE, MA)
Small Quantity Generators, between 100 kg and 1000 kg of hazardous waste/month (Resource Conservation and Recovery Act (tracking hazardous waste)) - notification Business NAICS classification: OTHER COMMERCIAL PRINTING. Organizations: MHPG INC (CONTACT/OWNER)
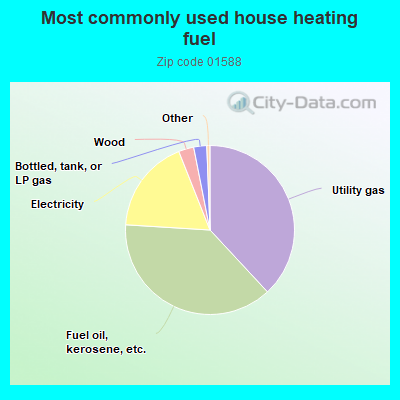
38.1%Utility gas
37.9%Fuel oil, kerosene, etc.
18.0%Electricity
2.9%Wood
2.5%Bottled, tank, or LP gas
Population in 1990: 8,807.
Place of birth for U.S.-born residents:
This state: 7,777
Northeast: 1,213
Midwest: 75
South: 281
West: 383
55% of the 01588 zip code residents lived in the same house 5 years ago. Out of people who lived in different houses, 74% lived in this county. Out of people who lived in different counties, 50% lived in Massachusetts.
94% of the 01588 zip code residents lived in the same house 1 year ago. Out of people who lived in different houses, 83% moved from this county. Out of people who lived in different houses, 2% moved from different county within same state. Out of people who lived in different houses, 10% moved from different state.
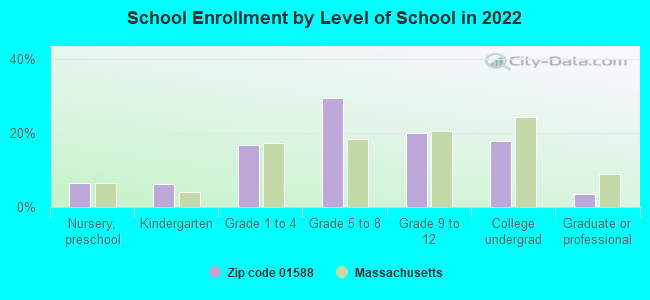
Private vs. public school enrollment:
Students in private schools in grades 1 to 8 (elementary and middle school): 251
Here:
22.5%
Massachusetts:
10.3%
Students in private schools in grades 9 to 12 (high school): 123
Here:
25.9%
Massachusetts:
12.3%
Students in private undergraduate colleges: 93
Here:
22.5%
Massachusetts:
51.2%
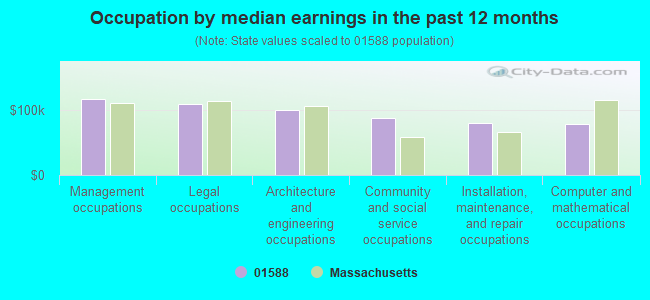
Occupation by median earnings in the past 12 months ($)
116,192Management occupations
108,402Legal occupations
98,878Architecture and engineering occupations
87,105Community and social service occupations
80,010Installation, maintenance, and repair occupations
77,660Computer and mathematical occupations
Companies with federal contracts located in this zip code (WHITINSVILLE, MA):
ACCESS TCA, INC (1 MAIN STREET; small business) : $435,001 in 8 contractsfrom 2001 to 2005
Contracts for Arts/Graphics Services by Army Signed by year:2000: $0; 2001: $252,047; 2002: $76,258; 2003: $99,500; 2004: $7,845; 2005: -$649; 2006: $0.
Biggest contracts:
$120,848 with Army for Arts/Graphics Services. Signed on 2001-08-08. Completion date: 2001-10-31.
$99,500 with Army for Arts/Graphics Services. Taking place in MD. Signed on 2003-09-30. Completion date: 2004-09-25.
$76,258, same as above.Signed on 2002-08-23. Completion date: 2002-09-25.
$66,326 with Army for Arts/Graphics Services. Signed on 2001-08-30. Completion date: 2001-10-31.
OSTERMAN, E GAS SERVICE INC (1 MEMORIAL SQUARE; small business) : $91,128 in 2 contractsfrom 2004 to 2006
$85,129 with Army for Gases: Compressed and Liquefied. Signed on 2004-10-01. Completion date: 2005-09-30.
$5,999 with Air Force for Liquid Propellants and Fuels, Petroleum Base. Signed on 2006-06-23. Completion date: 2006-07-14.
ALTERNATIVES UNLIMITED, INC (54 DOUGLAS RD; small business) : $8,295 in 7 contractsfrom 2005 to 2006
Contracts for Custodial Janitorial Services by Army, U.S. Army Corps of Engineers - civil program financing only Signed by year:2000: $0; 2001: $0; 2002: $0; 2003: $0; 2004: $0; 2005: $8,575; 2006: -$280.
Biggest contracts:
$2,487 with Army for Custodial Janitorial Services. Signed on 2005-11-01. Completion date: 2006-09-30.
$2,011, same as above.Signed on 2005-02-09. Completion date: 2005-09-30.
$2,011 with U.S. Army Corps of Engineers - civil program financing only for Custodial Janitorial Services. Signed on 2005-02-09. Completion date: 2005-09-30.
$1,007 with Army for Custodial Janitorial Services. Signed on 2005-03-15. Completion date: 2005-09-12.
TRAINRIGHT, INC (222 SAMUEL DRIVE; small business) : $6,750 in 2 contractsfrom 2002 to 2005
$3,500 with Army for Other Education and Training Services. Signed on 2002-03-08. Completion date: 2002-04-26.
$3,250, same as above.Signed on 2005-07-12. Completion date: 2005-08-05.
Top industries in this zip code by the number of employees in 2005:
Health Care and Social Assistance: Nursing Care Facilities (100-249 employees: 1 establishment)
Administrative and Support and Waste Management and Remediation Services: Convention and Trade Show Organizers (100-249: 1)
Wholesale Trade: Tobacco and Tobacco Product Merchant Wholesalers (100-249: 1)
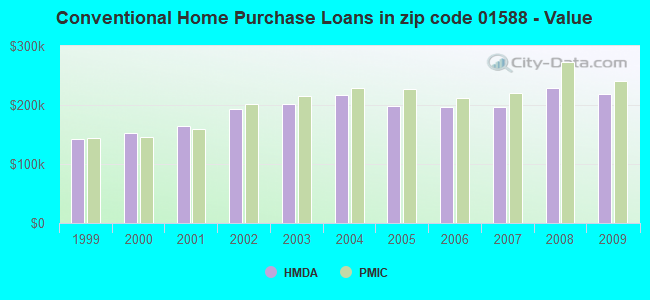
Detailed PMIC statistics for the following Tracts:7501.00
, 7502.00
2002 - 2016 National Fire Incident Reporting System (NFIRS) incidents
Based on the data from the years 2002 - 2016 the average number of fires per year is 54. The highest number of fires - 92 took place in 2010, and the least - 9 in 2016. The data has a declining trend.
When looking into fire subcategories, the most incidents belonged to: Structure Fires (55.4%), and Outside Fires (29.9%).
Fire incident types reported to NFIRS in Zip Code 01588


 Nearest zip codes: 01534, 01525, 01560, 01569, 01590, 01519.


 Based on the data from the years 2002 - 2016 the average number of fires per year is 54. The highest number of fires - 92 took place in 2010, and the least - 9 in 2016. The data has a declining trend.
 When looking into fire subcategories, the most incidents belonged to: Structure Fires (55.4%), and Outside Fires (29.9%).