Estimated zip code population in 2022: 7,473 Zip code population in 2010: 7,591 Zip code population in 2000: 6,226
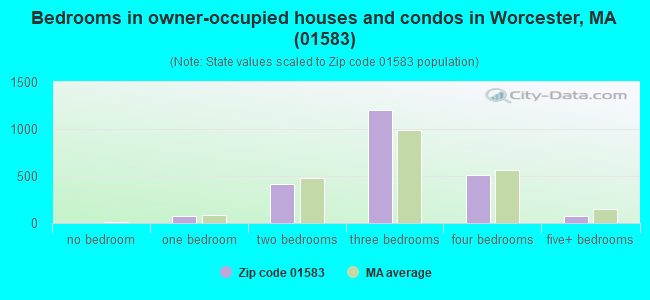
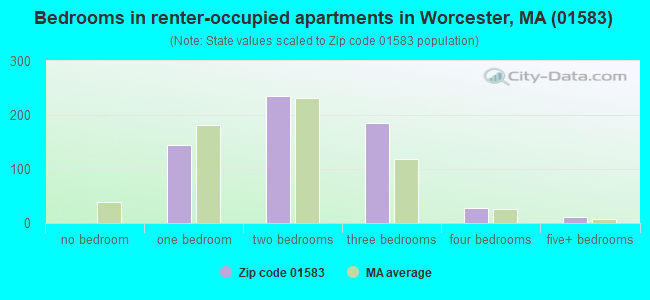
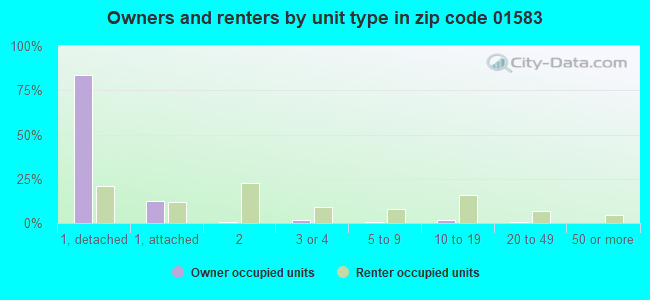
Houses and condos: 2,930 Renter-occupied apartments: 603
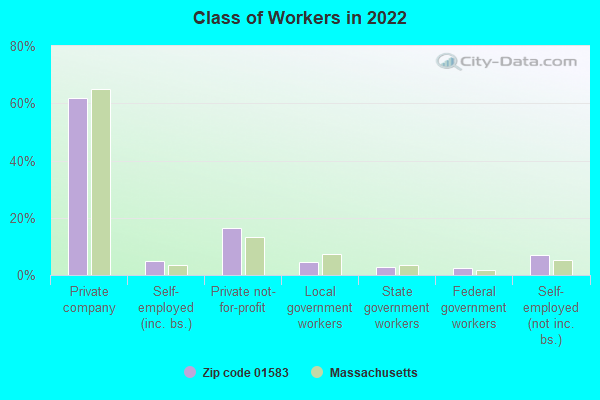
% of renters here:
21%
State:
38%
March 2022 cost of living index in zip code 01583: 125.7 (high, U.S. average is 100)
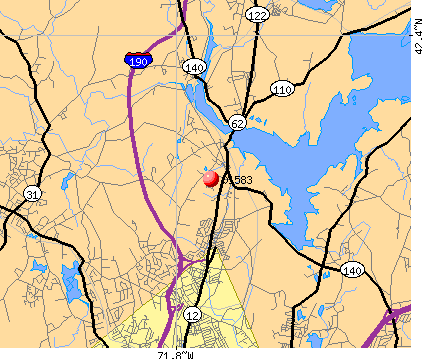
Land area: 12.6 sq. mi. Water area: 0.9 sq. mi.
Population density: 592 people per square mile
(low).
OSM Map
Google Map
MSN Map
OSM Map
General Map
Google Map
MSN Map
OSM Map
Google Map
MSN Map
OSM Map
Google Map
MSN Map
Please wait while loading the map...
Real estate property taxes paid for housing units in 2022:
This zip code:
1.4% ($5,908)
Massachusetts:
1.0% ($5,536)
Median real estate property taxes paid for housing units with mortgages in 2022: $5,885 (1.4%) Median real estate property taxes paid for housing units with no mortgage in 2022: $5,941 (1.4%)
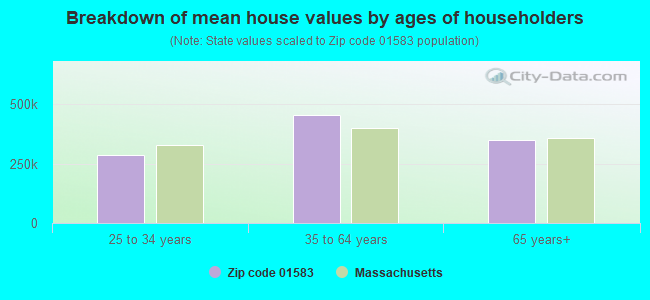
Estimated median house/condo value in 2022: $423,649
01583:
$423,649
Massachusetts:
$534,700
According to our research of Massachusetts and other state lists, there were 2 registered sex offenders living in 01583 zip code as of May 19, 2024. The ratio of all residents to sex offenders in zip code 01583 is 3,856 to 1. The ratio of registered sex offenders to all residents in this zip code is much lower than the state average.
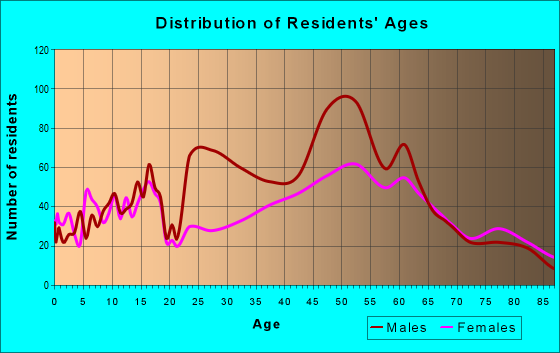
Median resident age:
This zip code:
47.4 years
Massachusetts median age:
40.3 years
Average household size:
This zip code:
2.3 people
Massachusetts:
2.4 people
Averages for the 2020 tax year for zip code 01583, filed in 2021:
Average Adjusted Gross Income (AGI) in 2020: $85,831 (Individual Income Tax Returns)
Here:
$85,831
State:
$105,130
Salary/wage: $75,915 (reported on 78.9% of returns)
Here:
$75,915
State:
$82,951
(% of AGI for various income ranges: 1129.6% for AGIs below $25k, 3567.4% for AGIs $25k-50k, 6243.3% for AGIs $50k-75k, 9844.1% for AGIs $75k-100k, 18146.7% for AGIs $100k-200k, 84327.5% for AGIs over 200k)
Taxable interest for individuals: $1,085 (reported on 48.6% of returns)
This zip code:
$1,085
Massachusetts:
$2,361
(% of AGI for various income ranges: 33.1% for AGIs below $25k, 52.8% for AGIs $25k-50k, 54.0% for AGIs $50k-75k, 129.6% for AGIs $75k-100k, 118.1% for AGIs $100k-200k, 553.8% for AGIs over 200k)
Ordinary dividends: $4,683 (reported on 27.7% of returns)
Here:
$4,683
State:
$10,365
(% of AGI for various income ranges: 49.0% for AGIs below $25k, 66.1% for AGIs $25k-50k, 112.9% for AGIs $50k-75k, 226.3% for AGIs $75k-100k, 303.8% for AGIs $100k-200k, 2375.0% for AGIs over 200k)
Net capital gain/loss in AGI: +$12,034 (reported on 24.2% of returns)
Here:
+$12,034
State:
+$48,178
(% of AGI for various income ranges: 16.7% for AGIs below $25k, 53.3% for AGIs $25k-50k, 95.3% for AGIs $50k-75k, 167.0% for AGIs $75k-100k, 596.7% for AGIs $100k-200k, 9123.8% for AGIs over 200k)
Profit/loss from business: +$19,493 (reported on 14.0% of returns)
Here:
+$19,493
State:
+$20,792
(% of AGI for various income ranges: 62.0% for AGIs below $25k, 166.8% for AGIs $25k-50k, 221.1% for AGIs $50k-75k, 370.4% for AGIs $75k-100k, 600.6% for AGIs $100k-200k, 5720.0% for AGIs over 200k)
Taxable individual retirement arrangement distribution: $20,209 (reported on 14.0% of returns)
01583:
$20,209
Massachusetts:
$22,790
(% of AGI for various income ranges: 109.8% for AGIs below $25k, 225.3% for AGIs $25k-50k, 379.3% for AGIs $50k-75k, 534.4% for AGIs $75k-100k, 802.9% for AGIs $100k-200k, 2833.8% for AGIs over 200k)
Self-employed (Keogh) retirement plans: $25,800 (reported on 0.5% of returns)
01583:
$25,800
Massachusetts:
$26,868
(% of AGI for various income ranges: 107.5% for AGIs $100k-200k)
Total itemized deductions: $26,159 (reported on 13.0% of returns)
Here:
$26,159
State:
$36,722
(% of AGI for various income ranges: 87.6% for AGIs below $25k, 170.0% for AGIs $25k-50k, 450.4% for AGIs $50k-75k, 717.4% for AGIs $75k-100k, 964.2% for AGIs $100k-200k, 4166.2% for AGIs over 200k)
Charity contributions: $5,195 (reported on 9.9% of returns)
Here:
$5,195
State:
$12,529
(% of AGI for various income ranges: 19.3% for AGIs $25k-50k, 46.4% for AGIs $50k-75k, 83.3% for AGIs $75k-100k, 150.2% for AGIs $100k-200k, 951.2% for AGIs over 200k)
Taxes paid: $9,168 (reported on 12.7% of returns)
01583:
$9,168
State:
$8,782
(% of AGI for various income ranges: 26.7% for AGIs below $25k, 54.2% for AGIs $25k-50k, 177.6% for AGIs $50k-75k, 290.4% for AGIs $75k-100k, 332.3% for AGIs $100k-200k, 1201.2% for AGIs over 200k)
Earned income credit: $1,874 (reported on 5.9% of returns)
Here:
$1,874
State:
$1,909
(% of AGI for various income ranges: 45.1% for AGIs below $25k, 35.3% for AGIs $25k-50k)
Percentage of individuals using paid preparers for their 2020 taxes: 92.1%
Here:
92%
State:
92%
(% for various income ranges: 89.5% for AGIs below $25k, 92.6% for AGIs $25k-50k, 93.9% for AGIs $50k-75k, 88.9% for AGIs $75k-100k, 93.0% for AGIs $100k-200k, 96.6% for AGIs over 200k)
Averages for the 2012 tax year for zip code 01583, filed in 2013:
Average Adjusted Gross Income (AGI) in 2012: $68,848 (Individual Income Tax Returns)
Here:
$68,848
State:
$81,425
Salary/wage: $61,666 (reported on 81.6% of returns)
Here:
$61,666
State:
$64,752
(% of AGI for various income ranges: 66.5% for AGIs below $25k, 72.6% for AGIs $25k-50k, 69.9% for AGIs $50k-75k, 72.9% for AGIs $75k-100k, 79.4% for AGIs $100k-200k, 66.9% for AGIs over 200k)
Taxable interest for individuals: $1,078 (reported on 50.7% of returns)
This zip code:
$1,078
Massachusetts:
$2,136
(% of AGI for various income ranges: 1.9% for AGIs below $25k, 1.3% for AGIs $25k-50k, 0.9% for AGIs $50k-75k, 1.0% for AGIs $75k-100k, 0.5% for AGIs $100k-200k, 0.5% for AGIs over 200k)
Ordinary dividends: $4,250 (reported on 29.8% of returns)
Here:
$4,250
State:
$9,473
(% of AGI for various income ranges: 2.9% for AGIs below $25k, 1.4% for AGIs $25k-50k, 1.6% for AGIs $50k-75k, 1.3% for AGIs $75k-100k, 1.2% for AGIs $100k-200k, 3.4% for AGIs over 200k)
Net capital gain/loss in AGI: +$7,247 (reported on 21.7% of returns)
Here:
+$7,247
State:
+$31,437
(% of AGI for various income ranges: 0.1% for AGIs below $25k, 0.7% for AGIs $50k-75k, 0.6% for AGIs $75k-100k, 2.0% for AGIs $100k-200k, 6.6% for AGIs over 200k)
Profit/loss from business: +$17,591 (reported on 15.0% of returns)
Here:
+$17,591
State:
+$20,662
(% of AGI for various income ranges: 5.8% for AGIs below $25k, 4.7% for AGIs $25k-50k, 2.8% for AGIs $50k-75k, 3.4% for AGIs $75k-100k, 2.4% for AGIs $100k-200k, 6.3% for AGIs over 200k)
Taxable individual retirement arrangement distribution: $14,078 (reported on 14.2% of returns)
01583:
$14,078
Massachusetts:
$18,892
(% of AGI for various income ranges: 5.1% for AGIs below $25k, 3.7% for AGIs $25k-50k, 3.3% for AGIs $50k-75k, 3.3% for AGIs $75k-100k, 3.0% for AGIs $100k-200k, 1.3% for AGIs over 200k)
Self-employment retirement plans: $19,167 (reported on 0.8% of returns)
01583:
$19,167
Massachusetts:
$20,669
Total itemized deductions: $21,980 (20% of AGI, reported on 47.6% of returns)
Here:
$21,980
State:
$28,907
Here:
20.1% of AGI
State:
18.2% of AGI
(% of AGI for various income ranges: 15.1% for AGIs below $25k, 14.4% for AGIs $25k-50k, 16.3% for AGIs $50k-75k, 16.5% for AGIs $75k-100k, 15.9% for AGIs $100k-200k, 12.9% for AGIs over 200k)
Charity contributions: $2,566 (reported on 39.8% of returns)
Here:
$2,566
State:
$4,208
(% of AGI for various income ranges: 1.1% for AGIs below $25k, 1.2% for AGIs $25k-50k, 1.3% for AGIs $50k-75k, 1.5% for AGIs $75k-100k, 1.3% for AGIs $100k-200k, 2.1% for AGIs over 200k)
Taxes paid: $10,321 (reported on 47.4% of returns)
01583:
$10,321
State:
$13,303
(% of AGI for various income ranges: 5.0% for AGIs below $25k, 4.9% for AGIs $25k-50k, 6.4% for AGIs $50k-75k, 7.3% for AGIs $75k-100k, 8.0% for AGIs $100k-200k, 7.6% for AGIs over 200k)
Earned income credit: $1,592 (reported on 7.2% of returns)
Here:
$1,592
State:
$1,971
(% of AGI for various income ranges: 2.6% for AGIs below $25k, 0.4% for AGIs $25k-50k)
Percentage of individuals using paid preparers for their 2012 taxes: 58.5%
Here:
58%
State:
56%
(% for various income ranges: 54.0% for AGIs below $25k, 55.7% for AGIs $25k-50k, 61.8% for AGIs $50k-75k, 62.8% for AGIs $75k-100k, 61.9% for AGIs $100k-200k, 66.7% for AGIs over 200k)
Averages for the 2004 tax year for zip code 01583, filed in 2005:
Average Adjusted Gross Income (AGI) in 2004: $61,698 (Individual Income Tax Returns)
Here:
$61,698
State:
$62,877
Salary/wage: $54,344 (reported on 84.0% of returns)
Here:
$54,344
State:
$52,969
(% of AGI for various income ranges: 117.2% for AGIs below $10k, 58.6% for AGIs $10k-25k, 76.6% for AGIs $25k-50k, 75.7% for AGIs $50k-75k, 83.0% for AGIs $75k-100k, 70.2% for AGIs over 100k)
Taxable interest for individuals: $1,338 (reported on 67.2% of returns)
This zip code:
$1,338
Massachusetts:
$1,945
(% of AGI for various income ranges: 7.1% for AGIs below $10k, 3.8% for AGIs $10k-25k, 1.5% for AGIs $25k-50k, 1.7% for AGIs $50k-75k, 1.0% for AGIs $75k-100k, 1.2% for AGIs over 100k)
Taxable dividends: $3,063 (reported on 35.6% of returns)
Here:
$3,063
State:
$5,323
(% of AGI for various income ranges: 2.1% for AGIs below $10k, 2.1% for AGIs $10k-25k, 1.1% for AGIs $25k-50k, 1.1% for AGIs $50k-75k, 0.8% for AGIs $75k-100k, 2.5% for AGIs over 100k)
Net capital gain/loss: +$11,116 (reported on 27.9% of returns)
Here:
+$11,116
State:
+$20,377
(% of AGI for various income ranges: -4.4% for AGIs below $10k, -0.1% for AGIs $10k-25k, 0.5% for AGIs $25k-50k, 1.5% for AGIs $50k-75k, 0.4% for AGIs $75k-100k, 9.8% for AGIs over 100k)
Profit/loss from business: +$20,044 (reported on 16.5% of returns)
Here:
+$20,044
State:
+$17,837
(% of AGI for various income ranges: 9.7% for AGIs below $10k, 8.2% for AGIs $10k-25k, 5.5% for AGIs $25k-50k, 6.0% for AGIs $50k-75k, 5.7% for AGIs $75k-100k, 4.6% for AGIs over 100k)
IRA payment deduction: $3,156 (reported on 3.8% of returns)
01583:
$3,156
Massachusetts:
$3,100
(% of AGI for various income ranges: 0.3% for AGIs $10k-25k, 0.4% for AGIs $25k-50k, 0.3% for AGIs $50k-75k, 0.1% for AGIs $75k-100k, 0.1% for AGIs over 100k)
Self-employed pension: $11,574 (reported on 1.9% of returns)
Here:
$11,574
Massachusetts:
$14,516
(% of AGI for various income ranges: 0.4% for AGIs $50k-75k, 0.3% for AGIs $75k-100k, 0.5% for AGIs over 100k)
Total itemized deductions: $19,805 (21% of AGI, reported on 49.7% of returns)
Here:
$19,805
State:
$22,573
Here:
20.6% of AGI
State:
19.5% of AGI
(% of AGI for various income ranges: 23.0% for AGIs below $10k, 20.5% for AGIs $10k-25k, 16.1% for AGIs $25k-50k, 17.7% for AGIs $50k-75k, 19.3% for AGIs $75k-100k, 13.6% for AGIs over 100k)
Charity contributions deductions: $2,373 (2% of AGI, reported on 45.0% of returns)
Here:
$2,373
State:
$3,295
Here:
2.4% of AGI
State:
2.7% of AGI
(% of AGI for various income ranges: 1.1% for AGIs below $10k, 1.5% for AGIs $10k-25k, 1.5% for AGIs $25k-50k, 1.4% for AGIs $50k-75k, 2.0% for AGIs $75k-100k, 1.8% for AGIs over 100k)
Total tax: $9,854 (reported on 82.3% of returns)
01583:
$9,854
State:
$11,494
(% of AGI for various income ranges: 3.6% for AGIs below $10k, 4.7% for AGIs $10k-25k, 8.2% for AGIs $25k-50k, 9.4% for AGIs $50k-75k, 9.9% for AGIs $75k-100k, 17.9% for AGIs over 100k)
Earned income credit: $1,377 (reported on 5.5% of returns)
Here:
$1,377
State:
$1,518
Percentage of individuals using paid preparers for their 2004 taxes: 58.1%
Here:
58%
State:
58%
(% for various income ranges: 46.4% for AGIs below $10k, 58.2% for AGIs $10k-25k, 58.9% for AGIs $25k-50k, 58.3% for AGIs $50k-75k, 64.4% for AGIs $75k-100k, 64.7% for AGIs over 100k)
Household received Food Stamps/SNAP in the past 12 months: 240 Household did not receive Food Stamps/SNAP in the past 12 months: 2,607
Women who had a birth in the past 12 months: 39 (41 now married, 0 unmarried) Women who did not have a birth in the past 12 months: 1,249 (458 now married, 790 unmarried)
Housing units in zip code 01583 with a mortgage: 1,488 (252 second mortgage, 245 both second mortgage and home equity loan) Houses without a mortgage: 91
Median monthly owner costs for units with a mortgage: $2,271 Median monthly owner costs for units without a mortgage: $934
Residents with income below the poverty level in 2022:
This zip code:
8.0%
Whole state:
10.4%
Residents with income below 50% of the poverty level in 2022:
This zip code:
6.6%
Whole state:
5.1%
Median number of rooms in houses and condos:
Here:
6.4
State:
6.5
Median number of rooms in apartments:
Here:
4.5
State:
4.0
Notable locations in this zip code not listed on our city pages
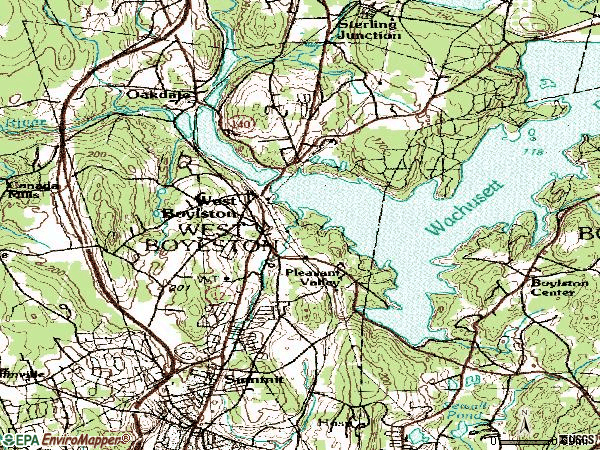
Notable locations in zip code 01583: Wachusett Country Club (A), West Boylston Fire Department (B), Beaman Memorial Public Library (C). Display/hide their locations on the map
Churches in zip code 01583 include: Our Lady of Good Counsel Church (A), First Congregational Church (B), Christ Lutheran Church (C), Bethlehem Baptist Church (D). Display/hide their locations on the map
Streams, rivers, and creeks: Stillwater River (A), Quinapoxet River (B), Muddy Brook (C), Gates Brook (D), Malden Brook (E), Scarletts Brook (F), Waushacum Brook (G), West Boylston Brook (H). Display/hide their locations on the map
733 married couples with children.
282 single-parent households (135 men, 147 women).
89.7% of residents of 01583 zip code speak English at home.
4.6% of residents speak Spanish at home (78% very well, 12% well, 4% not well, 6% not at all).
3.4% of residents speak other Indo-European language at home (90% very well, 6% well, 4% not well).
0.9% of residents speak Asian or Pacific Island language at home (37% very well, 30% well, 14% not well, 19% not at all).
1.4% of residents speak other language at home (59% very well, 41% well).
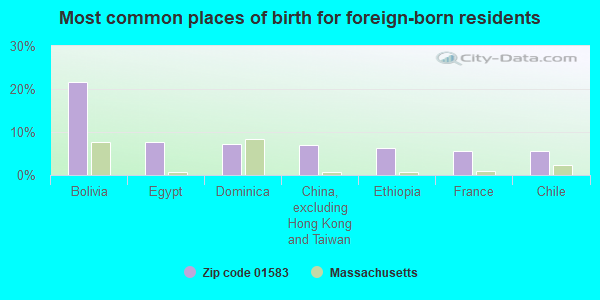
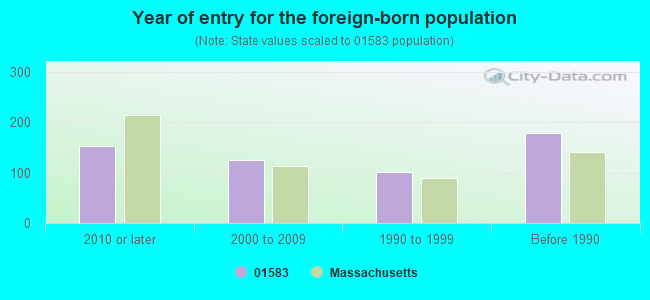
Foreign born population: 440 (5.9%) (69.6% of them are naturalized citizens)
This zip code:
5.9%
Whole state:
18.0%
22%Bolivia
8%Egypt
7%Dominica
7%China, excluding Hong Kong and Taiwan
6%Ethiopia
6%France
6%Chile
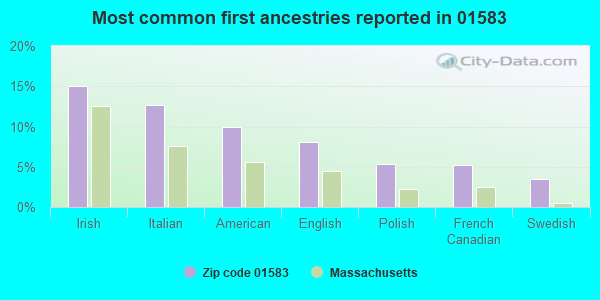
15%Irish
13%Italian
10%American
8%English
5%Polish
5%French Canadian
4%Swedish
Year of entry for the foreign-born population
1532010 or later
1242000 to 2009
1011990 to 1999
179Before 1990
Major facilities with environmental interests located in this zip code:
MAJOR EDWARDS ELEMENTARY SCHOOL (70 CRESCENT STREET in WEST BOYLSTON, MA)
AIR MINOR (AIRS/AFS) STATE MASTER (MA-EPICS) - NEI-1180498, AIR PROGRAM, NEI-, RCRAINFO-, HAZARDOUS WASTE PROGRAM (National Center for Education Statistics) - STATE ID-322005 Organizations: WEST BOYLSTON (SCHOOL DISTRICT)
Alternative names: MAJ EDWARDS ELEMENTARY SCHOOL
EQUILLON/SHELL (137 SHREWSBURY ST in WEST BOYLSTON, MA)
AIR MINOR (AIRS/AFS) (Resource Conservation and Recovery Act (tracking hazardous waste)) Business SIC classification: PETROLEUM BULK STATIONS AND TERMINALS Organizations: SHELL OIL COMPANY (CONTACT/OWNER)
Alternative names: SHELL OIL CO - WEST BOYLSTON, SHELL OIL CO WEST BOYLSTON PLT, SHELL OIL CO.
ALLMERICA FINANCIAL (216 WEST BOYLSTON ST in WEST BOYLSTON, MA)
(Resource Conservation and Recovery Act (tracking hazardous waste)) Business NAICS classification: ALL OTHER PUBLISHERS. Organizations: STATE MUTUAL COMPANIES (CONTACT/OWNER)
Alternative names: STATE MUTUAL CO
LUXTEC CORP (99 HARTWELL ST. in WEST BOYLSTON, MA)
AIR MINOR (AIRS/AFS) CRITERIA AND HAZARDOUS AIR POLLUTANT INVENTORY (Inventory of air pollution sources) TRI REPORTER (Tracking of toxic chemicals releasing facilities) Business SIC classification: AUTOMATIC CONTROLS FOR REGULATING RESIDENTIAL AND COMMERCIAL ENVIRONMENTS AND APPLIANCES; ELECTROMEDICAL AND ELECTROTHERAPEUTIC APPARATUS
MASS MATERIALS RESEARCH INC (241 WEST BOYLSTON ST in WEST BOYLSTON, MA)
(Resource Conservation and Recovery Act (tracking hazardous waste)) Organizations: MA MATERIALS RESEARCH (CONTACT/OWNER)
Alternative names: MA MATERIALS RESEARCH INC
MEYER GEO J MFG CO DIV ATO INC (100 HARTWELL ST in WEST BOYLSTON, MA)
(Resource Conservation and Recovery Act (tracking hazardous waste)) Business NAICS classification: ALL OTHER MISCELLANEOUS GENERAL PURPOSE MACHINERY MANUFACTURING.
JOHNSON & BASSETT INC (100 HARTWELL ST in WEST BOYLSTON, MA)
(Resource Conservation and Recovery Act (tracking hazardous waste)) Organizations: JOHNSON & BASSSETT INC (CONTACT/OWNER)
BALDARELLI BROS INC (277 STERLING ST in WEST BOYLSTON, MA)
Conditionally Exempt Small Quantity Generators, less than 100 kg/month of hazardous waste (Resource Conservation and Recovery Act (tracking hazardous waste)) - notification Organizations: BALDERELLI BROS INC (CONTACT/OPERATOR)
Alternative names: BALDERELLI BROS INC
MICHAELS PHOTO CENTER INC (360 WEST BOYLSTON ST in WEST BOYLSTON, MA)
Small Quantity Generators, between 100 kg and 1000 kg of hazardous waste/month (Resource Conservation and Recovery Act (tracking hazardous waste)) - notification Organizations: MICHAEL AMIR (CONTACT/OWNER)
MWRA OAKDALE POWER STATION (51 RIVER RD in WEST BOYLSTON, MA)
National Pollutant Discharge Elimination System NON-MAJOR (Tracking pollutant discharge elimination systems) - permit Business SIC classification: ELECTRIC SERVICES Alternative names: MASSACHUSETTS WATER RESOURCES
NEW ENGLAND ENVELOPE MFG CO (211 SHREWSBURY ST in WEST BOYLSTON, MA)
(Resource Conservation and Recovery Act (tracking hazardous waste))
MA MATERIALS RESEARCH (185 SHREWSBURY ST in WEST BOYLSTON, MA)
Conditionally Exempt Small Quantity Generators, less than 100 kg/month of hazardous waste (Resource Conservation and Recovery Act (tracking hazardous waste)) - notification Organizations: DAVE KRASHES (CONTACT/OWNER)
MASS MATERIALS RESEARCH INC (1500 CENTURY DR in WEST BOYLSTON, MA)
Small Quantity Generators, between 100 kg and 1000 kg of hazardous waste/month (Resource Conservation and Recovery Act (tracking hazardous waste)) Organizations: MASSACHUSETTS MATERIALS RESEARCH INC (CONTACT/OWNER)
Alternative names: MASSACHUSETTS MATERIALS RESEARCH INC
Housing units lacking complete plumbing facilities: 1.6% Housing units lacking complete kitchen facilities: 1.7%
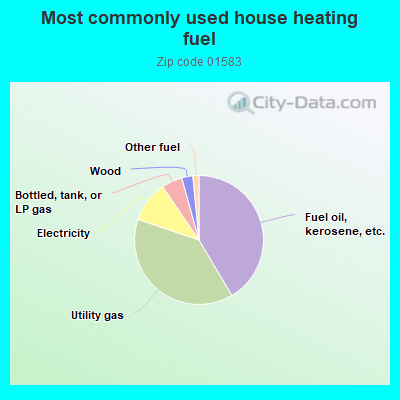
41.5%Fuel oil, kerosene, etc.
38.7%Utility gas
10.3%Electricity
5.2%Bottled, tank, or LP gas
2.8%Wood
1.5%Other fuel
Population in 1990: 6,611.
Place of birth for U.S.-born residents:
This state: 5,795
Northeast: 608
Midwest: 185
South: 201
West: 63
69% of the 01583 zip code residents lived in the same house 5 years ago. Out of people who lived in different houses, 81% lived in this county. Out of people who lived in different counties, 50% lived in Massachusetts.
88% of the 01583 zip code residents lived in the same house 1 year ago. Out of people who lived in different houses, 67% moved from this county. Out of people who lived in different houses, 17% moved from different county within same state. Out of people who lived in different houses, 4% moved from different state. Out of people who lived in different houses, 6% moved from abroad.
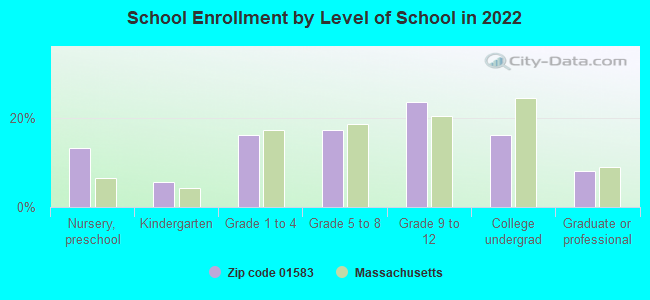
Private vs. public school enrollment:
Students in private schools in grades 1 to 8 (elementary and middle school): 77
Here:
15.6%
Massachusetts:
10.3%
Students in private schools in grades 9 to 12 (high school):
Here:
0.0%
Massachusetts:
12.3%
Students in private undergraduate colleges: 77
Here:
33.0%
Massachusetts:
51.2%
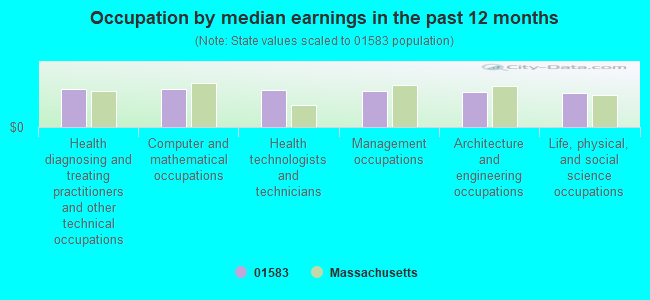
Occupation by median earnings in the past 12 months ($)
96,652Health diagnosing and treating practitioners and other technical occupations
95,571Computer and mathematical occupations
93,339Health technologists and technicians
91,989Management occupations
89,899Architecture and engineering occupations
86,348Life, physical, and social science occupations
Companies with federal contracts located in this zip code:
CORPORATE ENVIRONMENTAL ADVISO (127 HARTWELL STREET in WEST BOYLSTON, MA; small business)
$1,150 with U.S. Army Corps of Engineers - civil program financing only for Maintenance, Repair or Alteration of Real Property -- Other Conservation and Development Facilities. Taking place in NH. Signed on 2003-07-16. Completion date: 2003-08-15.
Top industries in this zip code by the number of employees in 2005:
Health Care and Social Assistance: Freestanding Ambulatory Surgical and Emergency Centers (100-249 employees: 1 establishment)
Health Care and Social Assistance: Nursing Care Facilities (100-249: 1)
Administrative and Support and Waste Management and Remediation Services: Solid Waste Landfill (100-249: 1)
Accommodation and Food Services: Full-Service Restaurants (20-49: 4, 1-4: 2)
Health Care and Social Assistance: Services for the Elderly and Persons with Disabilities (50-99: 1, 10-19: 1)
Accommodation and Food Services: Limited-Service Restaurants (20-49: 2, 5-9: 2)
People in group quarters in 2010:
1,138 people in local jails and other municipal confinement facilities
87 people in nursing facilities/skilled-nursing facilities
4 people in group homes intended for adults
4 people in residential treatment centers for adults
People in group quarters in 2000:
78 people in nursing homes
9 people in other noninstitutional group quarters
Home Mortgage Disclosure Act Aggregated Statistics For Year 2009 (Based on 2 full and 2 partial tracts)
A) FHA, FSA/RHS & VA Home Purchase Loans
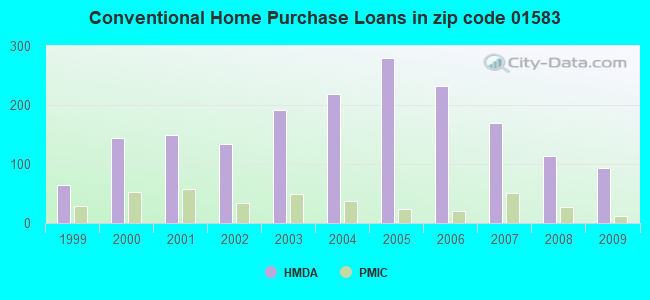
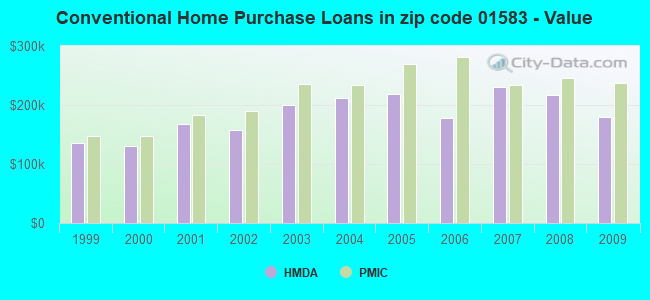
B) Conventional Home Purchase Loans
C) Refinancings
D) Home Improvement Loans
E) Loans on Dwellings For 5+ Families
F) Non-occupant Loans on < 5 Family Dwellings (A B C & D)
Number
Average Value
Number
Average Value
Number
Average Value
Number
Average Value
Number
Average Value
Number
Average Value
LOANS ORIGINATED
66
$212,833
93
$180,078
377
$213,233
15
$171,612
2
$210,475
17
$188,162
APPLICATIONS APPROVED, NOT ACCEPTED
4
$221,522
4
$134,995
17
$183,442
2
$11,970
0
$0
2
$89,400
APPLICATIONS DENIED
7
$185,896
17
$178,643
94
$251,078
10
$146,518
0
$0
4
$234,412
APPLICATIONS WITHDRAWN
4
$149,960
0
$0
66
$226,540
0
$0
0
$0
2
$189,525
FILES CLOSED FOR INCOMPLETENESS
4
$131,865
0
$0
23
$207,713
8
$218,886
0
$0
0
$0
Aggregated Statistics For Year 2008 (Based on 2 full and 2 partial tracts)
A) FHA, FSA/RHS & VA Home Purchase Loans
B) Conventional Home Purchase Loans
C) Refinancings
D) Home Improvement Loans
F) Non-occupant Loans on < 5 Family Dwellings (A B C & D)
Number
Average Value
Number
Average Value
Number
Average Value
Number
Average Value
Number
Average Value
LOANS ORIGINATED
17
$228,651
113
$217,684
167
$231,133
28
$116,159
10
$209,152
APPLICATIONS APPROVED, NOT ACCEPTED
2
$150,190
6
$244,388
20
$231,412
4
$18,538
0
$0
APPLICATIONS DENIED
4
$230,652
6
$229,425
65
$236,023
10
$160,084
6
$185,380
APPLICATIONS WITHDRAWN
0
$0
17
$242,572
29
$235,882
4
$29,502
0
$0
FILES CLOSED FOR INCOMPLETENESS
0
$0
2
$224,440
5
$231,724
2
$279,300
0
$0
Aggregated Statistics For Year 2007 (Based on 2 full and 2 partial tracts)
A) FHA, FSA/RHS & VA Home Purchase Loans
B) Conventional Home Purchase Loans
C) Refinancings
D) Home Improvement Loans
F) Non-occupant Loans on < 5 Family Dwellings (A B C & D)
G) Loans On Manufactured Home Dwelling (A B C & D)
Number
Average Value
Number
Average Value
Number
Average Value
Number
Average Value
Number
Average Value
Number
Average Value
LOANS ORIGINATED
6
$239,987
170
$229,904
221
$204,216
45
$73,739
20
$195,031
2
$47,380
APPLICATIONS APPROVED, NOT ACCEPTED
2
$228,430
21
$141,252
28
$228,160
4
$34,420
0
$0
0
$0
APPLICATIONS DENIED
0
$0
36
$215,486
98
$239,269
11
$37,171
12
$220,862
0
$0
APPLICATIONS WITHDRAWN
0
$0
22
$172,776
61
$251,837
6
$98,025
6
$172,608
0
$0
FILES CLOSED FOR INCOMPLETENESS
0
$0
13
$231,698
7
$230,771
0
$0
2
$281,610
0
$0
Aggregated Statistics For Year 2006 (Based on 2 full and 2 partial tracts)
A) FHA, FSA/RHS & VA Home Purchase Loans
B) Conventional Home Purchase Loans
C) Refinancings
D) Home Improvement Loans
E) Loans on Dwellings For 5+ Families
F) Non-occupant Loans on < 5 Family Dwellings (A B C & D)
Number
Average Value
Number
Average Value
Number
Average Value
Number
Average Value
Number
Average Value
Number
Average Value
LOANS ORIGINATED
12
$259,254
233
$178,198
244
$184,379
68
$81,554
2
$224,440
21
$206,055
APPLICATIONS APPROVED, NOT ACCEPTED
0
$0
22
$162,554
53
$159,155
13
$75,057
0
$0
6
$120,208
APPLICATIONS DENIED
0
$0
26
$182,158
126
$366,791
21
$101,440
0
$0
11
$206,107
APPLICATIONS WITHDRAWN
0
$0
8
$271,941
90
$235,385
2
$327,205
0
$0
4
$209,238
FILES CLOSED FOR INCOMPLETENESS
0
$0
5
$212,414
38
$243,326
0
$0
0
$0
10
$277,368
Aggregated Statistics For Year 2005 (Based on 2 full and 2 partial tracts)
A) FHA, FSA/RHS & VA Home Purchase Loans
B) Conventional Home Purchase Loans
C) Refinancings
D) Home Improvement Loans
E) Loans on Dwellings For 5+ Families
F) Non-occupant Loans on < 5 Family Dwellings (A B C & D)
G) Loans On Manufactured Home Dwelling (A B C & D)
Number
Average Value
Number
Average Value
Number
Average Value
Number
Average Value
Number
Average Value
Number
Average Value
Number
Average Value
LOANS ORIGINATED
4
$302,742
279
$219,346
341
$212,163
77
$98,871
2
$1,097,250
24
$264,411
0
$0
APPLICATIONS APPROVED, NOT ACCEPTED
0
$0
20
$177,374
53
$202,239
6
$99,438
0
$0
0
$0
2
$134,660
APPLICATIONS DENIED
0
$0
34
$193,464
96
$185,672
18
$230,162
0
$0
6
$231,968
0
$0
APPLICATIONS WITHDRAWN
0
$0
26
$225,000
98
$193,872
13
$181,688
0
$0
4
$216,712
0
$0
FILES CLOSED FOR INCOMPLETENESS
0
$0
11
$197,167
71
$247,284
0
$0
0
$0
6
$208,072
0
$0
Aggregated Statistics For Year 2004 (Based on 2 full and 2 partial tracts)
A) FHA, FSA/RHS & VA Home Purchase Loans
B) Conventional Home Purchase Loans
C) Refinancings
D) Home Improvement Loans
F) Non-occupant Loans on < 5 Family Dwellings (A B C & D)
Number
Average Value
Number
Average Value
Number
Average Value
Number
Average Value
Number
Average Value
LOANS ORIGINATED
10
$226,345
219
$212,435
430
$188,134
51
$107,993
23
$239,020
APPLICATIONS APPROVED, NOT ACCEPTED
0
$0
12
$152,875
34
$175,124
4
$57,028
0
$0
APPLICATIONS DENIED
0
$0
20
$224,376
117
$213,099
16
$41,484
2
$59,850
APPLICATIONS WITHDRAWN
0
$0
17
$174,496
64
$207,895
4
$33,915
6
$190,892
FILES CLOSED FOR INCOMPLETENESS
0
$0
6
$223,440
37
$203,089
4
$83,400
2
$200,500
Aggregated Statistics For Year 2003 (Based on 2 full and 2 partial tracts)
A) FHA, FSA/RHS & VA Home Purchase Loans
B) Conventional Home Purchase Loans
C) Refinancings
D) Home Improvement Loans
F) Non-occupant Loans on < 5 Family Dwellings (A B C & D)
Number
Average Value
Number
Average Value
Number
Average Value
Number
Average Value
Number
Average Value
LOANS ORIGINATED
12
$211,555
192
$199,818
978
$163,476
35
$30,061
23
$194,394
APPLICATIONS APPROVED, NOT ACCEPTED
0
$0
15
$185,059
99
$138,975
8
$30,701
11
$211,935
APPLICATIONS DENIED
0
$0
17
$238,963
196
$167,288
16
$28,461
5
$322,556
APPLICATIONS WITHDRAWN
2
$190,525
16
$250,747
121
$156,973
6
$91,580
4
$418,950
FILES CLOSED FOR INCOMPLETENESS
2
$136,780
0
$0
11
$171,597
0
$0
0
$0
Aggregated Statistics For Year 2002 (Based on 2 full and 2 partial tracts)
A) FHA, FSA/RHS & VA Home Purchase Loans
B) Conventional Home Purchase Loans
C) Refinancings
D) Home Improvement Loans
F) Non-occupant Loans on < 5 Family Dwellings (A B C & D)
Number
Average Value
Number
Average Value
Number
Average Value
Number
Average Value
Number
Average Value
LOANS ORIGINATED
14
$183,502
134
$157,291
647
$154,192
49
$68,408
21
$113,086
APPLICATIONS APPROVED, NOT ACCEPTED
0
$0
8
$127,982
67
$137,029
8
$34,689
2
$17,880
APPLICATIONS DENIED
2
$156,450
4
$305,748
82
$153,415
30
$61,588
0
$0
APPLICATIONS WITHDRAWN
0
$0
7
$218,136
81
$144,559
6
$33,815
2
$144,640
FILES CLOSED FOR INCOMPLETENESS
0
$0
6
$103,295
30
$180,221
0
$0
4
$205,620
Aggregated Statistics For Year 2001 (Based on 2 full and 2 partial tracts)
A) FHA, FSA/RHS & VA Home Purchase Loans
B) Conventional Home Purchase Loans
C) Refinancings
D) Home Improvement Loans
E) Loans on Dwellings For 5+ Families
F) Non-occupant Loans on < 5 Family Dwellings (A B C & D)
Number
Average Value
Number
Average Value
Number
Average Value
Number
Average Value
Number
Average Value
Number
Average Value
LOANS ORIGINATED
10
$178,722
149
$168,471
488
$135,918
28
$38,852
5
$455,940
17
$139,634
APPLICATIONS APPROVED, NOT ACCEPTED
2
$223,500
6
$174,230
38
$102,595
9
$71,822
0
$0
2
$310,225
APPLICATIONS DENIED
0
$0
8
$155,238
66
$113,695
15
$45,901
0
$0
2
$59,850
APPLICATIONS WITHDRAWN
2
$101,915
2
$269,990
84
$114,300
9
$42,151
0
$0
0
$0
FILES CLOSED FOR INCOMPLETENESS
2
$109,070
4
$182,675
4
$223,500
0
$0
0
$0
0
$0
Aggregated Statistics For Year 2000 (Based on 2 full and 2 partial tracts)
A) FHA, FSA/RHS & VA Home Purchase Loans
B) Conventional Home Purchase Loans
C) Refinancings
D) Home Improvement Loans
F) Non-occupant Loans on < 5 Family Dwellings (A B C & D)
Number
Average Value
Number
Average Value
Number
Average Value
Number
Average Value
Number
Average Value
LOANS ORIGINATED
23
$137,551
144
$131,255
115
$152,383
32
$33,593
12
$125,187
APPLICATIONS APPROVED, NOT ACCEPTED
2
$140,360
11
$184,546
19
$123,828
19
$23,371
0
$0
APPLICATIONS DENIED
6
$132,418
8
$141,296
71
$85,848
33
$65,783
0
$0
APPLICATIONS WITHDRAWN
6
$127,518
13
$155,388
70
$85,647
11
$52,690
2
$67,830
FILES CLOSED FOR INCOMPLETENESS
0
$0
2
$155,610
19
$93,803
0
$0
0
$0
Aggregated Statistics For Year 1999 (Based on 1 full and 1 partial tracts)
A) FHA, FSA/RHS & VA Home Purchase Loans
B) Conventional Home Purchase Loans
C) Refinancings
D) Home Improvement Loans
E) Loans on Dwellings For 5+ Families
F) Non-occupant Loans on < 5 Family Dwellings (A B C & D)
Detailed PMIC statistics for the following Tracts:7291.00
, 7292.00
2002 - 2018 National Fire Incident Reporting System (NFIRS) incidents
Based on the data from the years 2002 - 2018 the average number of fires per year is 23. The highest number of fires - 49 took place in 2016, and the least - 4 in 2006. The data has a rising trend.
When looking into fire subcategories, the most incidents belonged to: Structure Fires (36.6%), and Outside Fires (36.3%).
Fire incident types reported to NFIRS in Zip Code 01583


 Nearest zip codes: 01606, 01505, 01520, 01564, 01605, 01522.


 Based on the data from the years 2002 - 2018 the average number of fires per year is 23. The highest number of fires - 49 took place in 2016, and the least - 4 in 2006. The data has a rising trend.
 When looking into fire subcategories, the most incidents belonged to: Structure Fires (36.6%), and Outside Fires (36.3%).