Work and Jobs in Tahoma-Maple Valley, Washington (WA) Detailed Stats
Occupations, Industries, Unemployment, Workers, Commute
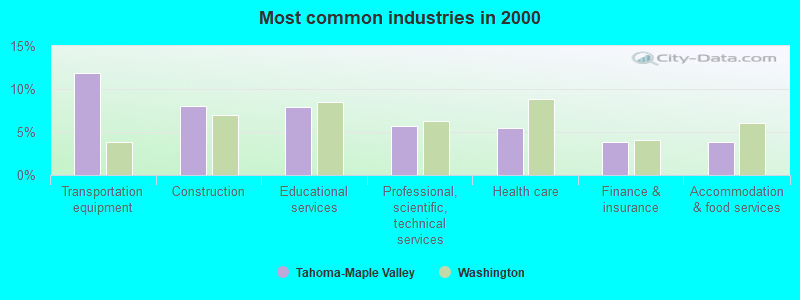
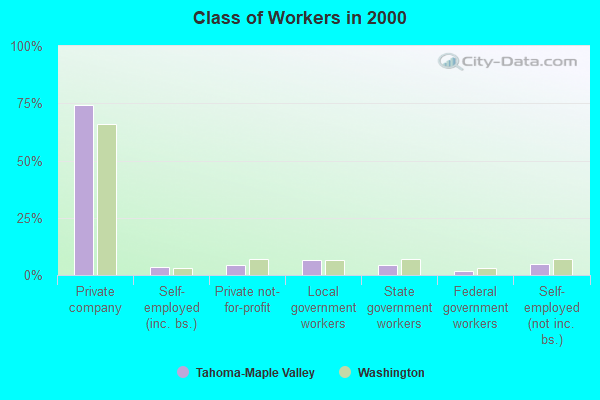
The most common industries in Tahoma-Maple Valley are: Transportation equipment (11.8% of civilian employees), Construction (8.0% of civilian employees), Educational services (7.9% of civilian employees). 74.3% of workers are employees of private companies, which is 11.2% greater than the rate of 66.0% across the entire state of Washington.
Most common industries
Most common industries | |||
|---|---|---|---|
Industry | All | Males | Females |
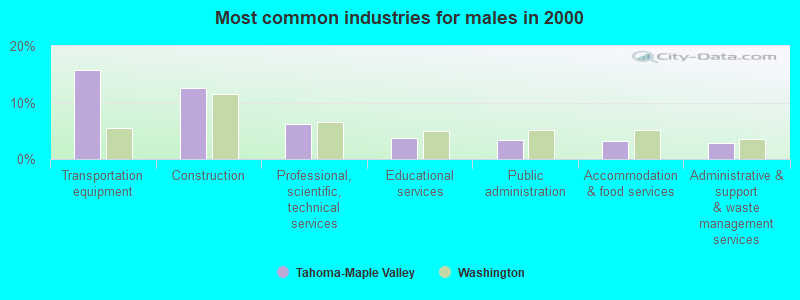
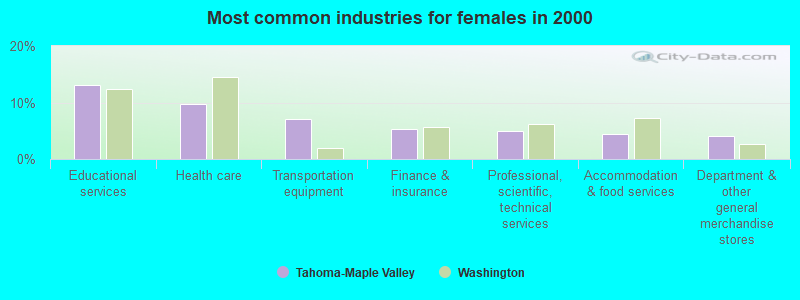
| Transportation equipment | 11.8% (3,182) | 15.8% (2,332) | 7.0% (850) |
| Construction | 8.0% (2,145) | 12.7% (1,870) | 2.3% (275) |
| Educational services | 7.9% (2,130) | 3.7% (543) | 13.1% (1,587) |
| Professional, scientific, and technical services | 5.7% (1,527) | 6.2% (918) | 5.0% (609) |
| Health care | 5.4% (1,464) | 1.9% (279) | 9.8% (1,185) |
| Finance and insurance | 3.8% (1,032) | 2.7% (392) | 5.3% (640) |
| Accommodation and food services | 3.8% (1,028) | 3.3% (484) | 4.5% (544) |
| Public administration | 3.3% (883) | 3.3% (495) | 3.2% (388) |
| Administrative and support and waste management services | 3.1% (845) | 2.8% (418) | 3.5% (427) |
| Food and beverage stores | 2.6% (696) | 1.9% (281) | 3.4% (415) |
| Department and other general merchandise stores | 2.5% (660) | 1.1% (159) | 4.1% (501) |
| Real estate and rental and leasing | 1.8% (480) | 1.7% (246) | 1.9% (234) |
| Social assistance | 1.7% (466) | 0.5% (81) | 3.2% (385) |
| Repair and maintenance | 1.7% (464) | 2.7% (402) | 0.5% (62) |
| Building material and garden equipment and supplies dealers | 1.7% (450) | 1.7% (250) | 1.7% (200) |
| Broadcasting and telecommunications | 1.7% (449) | 1.9% (279) | 1.4% (170) |
| Other transportation, and support activities, and couriers | 1.6% (439) | 1.9% (283) | 1.3% (156) |
| Motor vehicle and parts dealers | 1.6% (417) | 1.9% (288) | 1.1% (129) |
| Arts, entertainment, and recreation | 1.5% (404) | 1.5% (227) | 1.5% (177) |
| Groceries and related products merchant wholesalers | 1.4% (372) | 1.6% (236) | 1.1% (136) |
| Air transportation | 1.3% (361) | 1.2% (178) | 1.5% (183) |
| Truck transportation | 1.3% (342) | 2.0% (292) | 0.4% (50) |
| Miscellaneous manufacturing | 1.3% (338) | 1.2% (171) | 1.4% (167) |
| Personal and laundry services | 1.2% (328) | 0.6% (96) | 1.9% (232) |
| Religious, grantmaking, civic, professional, and similar organizations | 1.2% (315) | 0.7% (103) | 1.8% (212) |
| Metal and metal products | 1.1% (303) | 1.5% (229) | 0.6% (74) |
| Computer and electronic products | 1.0% (272) | 1.5% (224) | 0.4% (48) |
| Machinery | 1.0% (259) | 1.3% (199) | 0.5% (60) |
| Machinery, equipment, and supplies merchant wholesalers | 1.0% (258) | 1.1% (168) | 0.7% (90) |
| Publishing, and motion picture and sound recording industries | 0.9% (242) | 1.0% (145) | 0.8% (97) |
| Food | 0.9% (230) | 0.9% (138) | 0.8% (92) |
| Furniture and home furnishings, and household appliance stores | 0.8% (219) | 0.5% (79) | 1.2% (140) |
| Radio, TV, and computer stores | 0.8% (202) | 0.7% (104) | 0.8% (98) |
| Other direct selling establishments | 0.7% (179) | 0.6% (94) | 0.7% (85) |
| Used merchandise, gift, novelty, and souvenir, and other miscellaneous stores | 0.7% (175) | 0.6% (89) | 0.7% (86) |
| U. S. Postal service | 0.6% (172) | 0.8% (117) | 0.5% (55) |
| Printing and related support activities | 0.6% (152) | 0.6% (82) | 0.6% (70) |
| Private households | 0.6% (151) | 0.0% (4) | 1.2% (147) |
| Miscellaneous nondurable goods merchant wholesalers | 0.5% (142) | 0.6% (94) | 0.4% (48) |
| Data processing, libraries, and other information services | 0.5% (141) | 0.4% (61) | 0.7% (80) |
| Utilities | 0.5% (125) | 0.7% (108) | 0.1% (17) |
| Sporting goods, camera, and hobby and toy stores | 0.5% (124) | 0.4% (60) | 0.5% (64) |
| Gasoline stations | 0.4% (119) | 0.5% (73) | 0.4% (46) |
| Nonmetallic mineral products | 0.4% (117) | 0.6% (93) | 0.2% (24) |
| Professional and commercial equipment and supplies merchant wholesalers | 0.4% (114) | 0.5% (78) | 0.3% (36) |
| Warehousing and storage | 0.4% (112) | 0.5% (72) | 0.3% (40) |
| Pharmacies and drug stores | 0.4% (111) | 0.2% (26) | 0.7% (85) |
| Wood products | 0.4% (108) | 0.7% (108) | 0.0% (0) |
| Agriculture, forestry, fishing and hunting | 0.3% (89) | 0.3% (43) | 0.4% (46) |
| Plastics and rubber products | 0.3% (85) | 0.4% (65) | 0.2% (20) |
| Office supplies and stationery stores | 0.3% (84) | 0.3% (43) | 0.3% (41) |
| Clothing and accessories, including shoe, stores | 0.3% (81) | 0.2% (34) | 0.4% (47) |
| Electronic shopping and mail-order houses | 0.3% (80) | 0.3% (49) | 0.3% (31) |
| Miscellaneous durable goods merchant wholesalers | 0.3% (79) | 0.1% (20) | 0.5% (59) |
| Lumber and other construction materials merchant wholesalers | 0.3% (70) | 0.4% (56) | 0.1% (14) |
| Electrical and electronic goods merchant wholesalers | 0.3% (69) | 0.3% (39) | 0.2% (30) |
| Paper | 0.2% (67) | 0.4% (52) | 0.1% (15) |
| Rail transportation | 0.2% (64) | 0.4% (56) | 0.1% (8) |
| Drugs, sundries, and chemical and allied products merchant wholesalers | 0.2% (59) | 0.3% (48) | 0.1% (11) |
| Furniture and home furnishing merchant wholesalers | 0.2% (58) | 0.3% (44) | 0.1% (14) |
| Furniture and related product manufacturing | 0.2% (55) | 0.3% (37) | 0.1% (18) |
| Metals and minerals, except petroleum, merchant wholesalers | 0.2% (55) | 0.3% (48) | 0.1% (7) |
| Music stores | 0.2% (55) | 0.3% (38) | 0.1% (17) |
| Chemicals | 0.2% (51) | 0.2% (32) | 0.2% (19) |
| Paper and paper products merchant wholesalers | 0.2% (51) | 0.2% (35) | 0.1% (16) |
| Motor vehicles, parts and supplies merchant wholesalers | 0.2% (49) | 0.3% (42) | 0.1% (7) |
| Apparel | 0.2% (47) | 0.0% (0) | 0.4% (47) |
| Beverage and tobacco products | 0.1% (39) | 0.1% (20) | 0.2% (19) |
| Hardware, plumbing and heating equipment, and supplies merchant wholesalers | 0.1% (33) | 0.2% (26) | 0.1% (7) |
| Farm supplies merchant wholesalers | 0.1% (31) | 0.1% (20) | 0.1% (11) |
| Petroleum and petroleum products merchant wholesalers | 0.1% (31) | 0.2% (31) | 0.0% (0) |
| Water transportation | 0.1% (28) | 0.2% (28) | 0.0% (0) |
| Electrical equipment, appliances, and components | 0.1% (23) | 0.2% (23) | 0.0% (0) |
| Management of companies and enterprises | 0.1% (22) | 0.1% (22) | 0.0% (0) |
| Apparel, fabrics, and notions merchant wholesalers | 0.1% (21) | 0.1% (21) | 0.0% (0) |
| Recyclable material merchant wholesalers | 0.1% (19) | 0.1% (19) | 0.0% (0) |
| Alcoholic beverages merchant wholesalers | 0.1% (16) | 0.1% (16) | 0.0% (0) |
Unemployment in Tahoma-Maple Valley
- Unemployment by race in 2000
- Unemployment rate for White non-Hispanic residents
- 3.6%Males
- 3.8%Females
- Unemployment rate for Black residents
- 6.4%Males
- 18.9%Females
- Unemployment rate for American Indian and Alaska Native residents
- 23.1%Males
- Unemployment rate for Asian residents
- 3.6%Males
- 3.4%Females
- Unemployment rate for other race residents
- 6.0%Females
- Unemployment rate for two or more race residents
- 11.8%Males
- 3.0%Females
- Unemployment rate for Hispanic or Latino residents
- 5.9%Males
- 6.9%Females
Time leaving home to go to work

<5am:
| Tahoma-Maple Valley: | 4.6% (1,209) |
| Washington: | 4.2% (115,997) |
5:30am:
| Tahoma-Maple Valley: | 5.5% (1,452) |
| Washington: | 3.7% (102,868) |
6am:
| Tahoma-Maple Valley: | 7.7% (2,019) |
| Washington: | 5.3% (147,812) |
6:30am:
| Tahoma-Maple Valley: | 12.1% (3,181) |
| Washington: | 8.9% (248,462) |
7am:
| Tahoma-Maple Valley: | 11.3% (2,958) |
| Washington: | 10.3% (288,005) |
7:30am:
| Tahoma-Maple Valley: | 13.5% (3,545) |
| Washington: | 13.5% (375,030) |
8am:
| Tahoma-Maple Valley: | 9.2% (2,409) |
| Washington: | 13.4% (372,576) |
8:30am:
| Tahoma-Maple Valley: | 7.7% (2,029) |
| Washington: | 9.0% (252,058) |
9am:
| Tahoma-Maple Valley: | 3.9% (1,037) |
| Washington: | 5.1% (141,936) |
10am:
| Tahoma-Maple Valley: | 5.0% (1,306) |
| Washington: | 5.8% (161,204) |
11am:
| Tahoma-Maple Valley: | 2.2% (580) |
| Washington: | 2.5% (70,123) |
12pm:
| Tahoma-Maple Valley: | 0.8% (215) |
| Washington: | 1.3% (35,612) |
4pm:
| Tahoma-Maple Valley: | 6.2% (1,639) |
| Washington: | 6.8% (190,565) |
>4pm:
| Tahoma-Maple Valley: | 5.5% (1,453) |
| Washington: | 5.8% (162,401) |
Travel time to work


Less than 5 minutes:
| Tahoma-Maple Valley: | 1.2% (313) |
| Washington: | 3.3% (91,132) |
5 to 9 minutes:
| Tahoma-Maple Valley: | 5.2% (1,364) |
| Washington: | 10.3% (286,517) |
10 to 14 minutes:
| Tahoma-Maple Valley: | 6.3% (1,661) |
| Washington: | 14.1% (391,606) |
15 to 19 minutes:
| Tahoma-Maple Valley: | 7.9% (2,077) |
| Washington: | 15.0% (418,990) |
20 to 24 minutes:
| Tahoma-Maple Valley: | 12.1% (3,170) |
| Washington: | 14.2% (394,209) |
25 to 29 minutes:
| Tahoma-Maple Valley: | 8.1% (2,131) |
| Washington: | 5.8% (162,590) |
30 to 34 minutes:
| Tahoma-Maple Valley: | 16.4% (4,302) |
| Washington: | 12.5% (348,311) |
35 to 39 minutes:
| Tahoma-Maple Valley: | 5.0% (1,325) |
| Washington: | 2.6% (73,592) |
40 to 44 minutes:
| Tahoma-Maple Valley: | 6.9% (1,819) |
| Washington: | 3.4% (95,182) |
45 to 59 minutes:
| Tahoma-Maple Valley: | 15.0% (3,933) |
| Washington: | 7.0% (195,343) |
60 to 89 minutes:
| Tahoma-Maple Valley: | 8.9% (2,330) |
| Washington: | 4.7% (131,691) |
90 or more minutes:
| Tahoma-Maple Valley: | 2.3% (607) |
| Washington: | 2.7% (75,486) |
Means of transportation to work


Drove car alone:
| Tahoma-Maple Valley: | 80.1% (21,029) |
| Washington: | 73.3% (2,040,833) |
Carpooled:
| Tahoma-Maple Valley: | 12.0% (3,140) |
| Washington: | 12.8% (357,742) |
Bus or trolley bus:
| Tahoma-Maple Valley: | 2.0% (513) |
| Washington: | 4.5% (124,450) |
Streetcar or trolley car:
| Tahoma-Maple Valley: | 0.0% (7) |
| Washington: | 0.0% (589) |
Subway or elevated:
| Tahoma-Maple Valley: | 0.1% (16) |
| Washington: | 0.0% (598) |
Motorcycle:
| Tahoma-Maple Valley: | 0.2% (60) |
| Washington: | 0.2% (4,353) |
Bicycle:
| Tahoma-Maple Valley: | 0.2% (60) |
| Washington: | 0.6% (16,205) |
Walked:
| Tahoma-Maple Valley: | 0.5% (124) |
| Washington: | 3.2% (89,739) |
Other means:
| Tahoma-Maple Valley: | 0.3% (83) |
| Washington: | 0.7% (19,499) |
Private vehicle occupancy

Drove alone:
| Tahoma-Maple Valley: | 87.0% (21,029) |
| Washington: | 85.1% (2,040,833) |
In 2 person carpool:
| Tahoma-Maple Valley: | 10.6% (2,557) |
| Washington: | 11.8% (282,638) |
In 3 person carpool:
| Tahoma-Maple Valley: | 1.4% (328) |
| Washington: | 1.9% (44,791) |
In 4 person carpool:
| Tahoma-Maple Valley: | 0.5% (123) |
| Washington: | 0.6% (14,195) |
In 5-6 person carpool:
| Tahoma-Maple Valley: | 0.3% (68) |
| Washington: | 0.3% (7,914) |
In 7+ person carpool:
| Tahoma-Maple Valley: | 0.3% (64) |
| Washington: | 0.3% (8,204) |
Class of workers
Employee of private company:
| Tahoma-Maple Valley: | 74.3% (19,971) |
| Washington: | 66.0% (1,843,000) |
Self-employed in own incorporated business:
| Tahoma-Maple Valley: | 3.4% (908) |
| Washington: | 3.2% (90,102) |
Private not-for-profit wage and salary workers:
| Tahoma-Maple Valley: | 4.3% (1,158) |
| Washington: | 6.9% (191,927) |
Local government workers:
| Tahoma-Maple Valley: | 6.8% (1,818) |
| Washington: | 6.4% (178,161) |
State government workers:
| Tahoma-Maple Valley: | 4.4% (1,194) |
| Washington: | 6.9% (192,408) |
Federal government workers:
| Tahoma-Maple Valley: | 1.8% (493) |
| Washington: | 3.2% (89,153) |
Self-employed workers in own not incorporated business:
| Tahoma-Maple Valley: | 4.7% (1,269) |
| Washington: | 7.2% (199,827) |
Unpaid family workers:
| Tahoma-Maple Valley: | 0.3% (78) |
| Washington: | 0.3% (9,144) |

Employee of private company - Males:
| Tahoma-Maple Valley: | 79.2% (11,706) |
| Washington: | 69.7% (1,044,674) |
Self-employed in own incorporated business - Males:
| Tahoma-Maple Valley: | 4.5% (658) |
| Washington: | 4.3% (64,169) |
Private not-for-profit wage and salary workers - Males:
| Tahoma-Maple Valley: | 2.4% (361) |
| Washington: | 4.2% (63,257) |
Local government workers - Males:
| Tahoma-Maple Valley: | 5.2% (764) |
| Washington: | 5.3% (79,844) |
State government workers - Males:
| Tahoma-Maple Valley: | 2.7% (392) |
| Washington: | 5.1% (76,834) |
Federal government workers - Males:
| Tahoma-Maple Valley: | 2.0% (302) |
| Washington: | 3.5% (52,763) |
Self-employed workers in own not incorporated business - Males:
| Tahoma-Maple Valley: | 4.0% (591) |
| Washington: | 7.6% (114,199) |
Unpaid family workers - Males:
| Tahoma-Maple Valley: | 0.0% (7) |
| Washington: | 0.3% (3,889) |

Employee of private company - Females:
| Tahoma-Maple Valley: | 68.3% (8,265) |
| Washington: | 61.7% (798,326) |
Self-employed in own incorporated business - Females:
| Tahoma-Maple Valley: | 2.1% (250) |
| Washington: | 2.0% (25,933) |
Private not-for-profit wage and salary workers - Females:
| Tahoma-Maple Valley: | 6.6% (797) |
| Washington: | 9.9% (128,670) |
Local government workers - Females:
| Tahoma-Maple Valley: | 8.7% (1,054) |
| Washington: | 7.6% (98,317) |
State government workers - Females:
| Tahoma-Maple Valley: | 6.6% (802) |
| Washington: | 8.9% (115,574) |
Federal government workers - Females:
| Tahoma-Maple Valley: | 1.6% (191) |
| Washington: | 2.8% (36,390) |
Self-employed workers in own not incorporated business - Females:
| Tahoma-Maple Valley: | 5.6% (678) |
| Washington: | 6.6% (85,628) |
Unpaid family workers - Females:
| Tahoma-Maple Valley: | 0.6% (71) |
| Washington: | 0.4% (5,255) |