Work and Jobs in North Richland Hills, Texas (TX) Detailed Stats
Occupations, Industries, Unemployment, Workers, Commute
Settings
X


Recent posts about work in North Richland Hills, Texas on our local forum with over 2,400,000 registered users:
 | Million Dollar Question - Buy or Wait? 2022 Edition (620 replies) |
| Anyone know how much these jobs pay? (0 replies) |
| new job dwtn Ft Worth - Where to Live (17 replies) |
| North Richland Hills? Vs Flower Mound (3 replies) |
| Fort Worth houses (41 replies) |
| Housing options for my low income senior mom. (11 replies) |
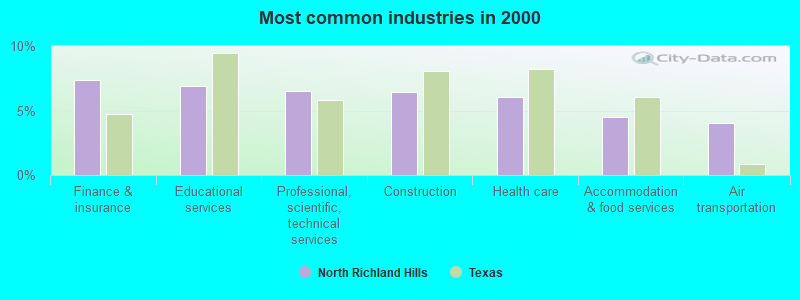
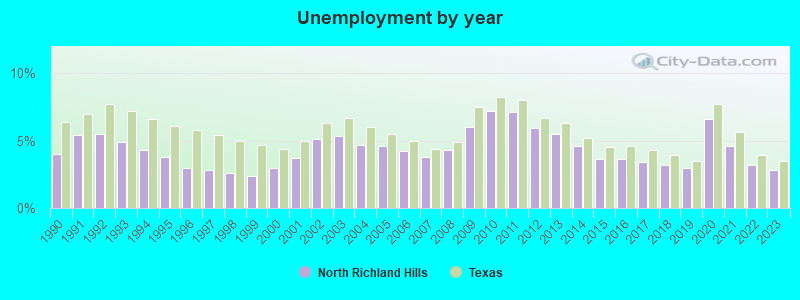
The unemployment rate in 2023 in North Richland Hills, TX was 2.8%, which was 25.0% less than the unemployment rate of 3.5% across the entire state of Texas. Compared to the unemployment rate of 5.5% in 2013, this represents a decrease of 96.4%. The most common industries in North Richland Hills are: Finance & insurance (7.3% of civilian employees), Educational services (6.9% of civilian employees), Professional, scientific, technical services (6.5% of civilian employees). 80.3% of workers work in Tarrant County and 12.8% of all workers work at home. 73.1% of workers are employees of private companies, which is 4.8% greater than the rate of 69.6% across the entire state of Texas.
Whole page based on the data from 2000 / 2022 when the population of North Richland Hills, Texas was 55,635 / 70,666
Whole page based on the data from 2000 / 2022 when the population of North Richland Hills, Texas was 55,635 / 70,666
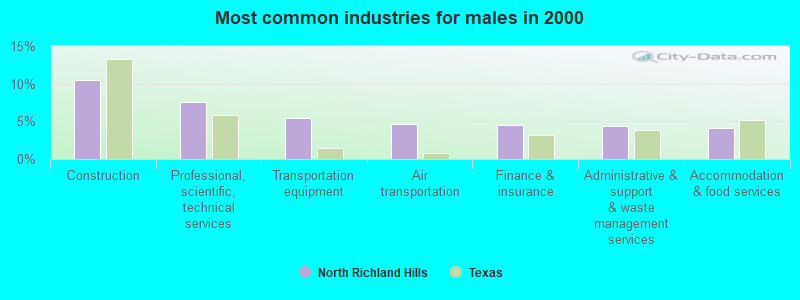
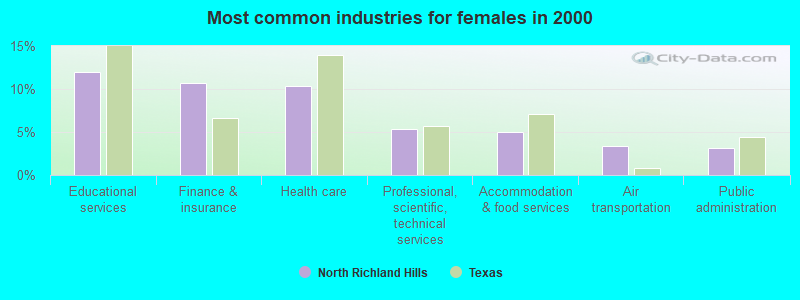
Most common industries
Most common industries | |||
|---|---|---|---|
Industry | All | Males | Females |
| Finance and insurance | 7.3% (2,211) | 4.5% (730) | 10.7% (1,481) |
| Educational services | 6.9% (2,085) | 2.6% (427) | 12.0% (1,658) |
| Professional, scientific, and technical services | 6.5% (1,963) | 7.5% (1,222) | 5.4% (741) |
| Construction | 6.4% (1,940) | 10.4% (1,695) | 1.8% (245) |
| Health care | 6.0% (1,809) | 2.3% (370) | 10.4% (1,439) |
| Accommodation and food services | 4.5% (1,359) | 4.1% (670) | 5.0% (689) |
| Air transportation | 4.1% (1,221) | 4.6% (751) | 3.4% (470) |
| Administrative and support and waste management services | 3.7% (1,123) | 4.4% (712) | 3.0% (411) |
| Transportation equipment | 3.7% (1,122) | 5.4% (875) | 1.8% (247) |
| Public administration | 3.5% (1,047) | 3.7% (608) | 3.2% (439) |
| Food and beverage stores | 2.8% (854) | 3.6% (592) | 1.9% (262) |
| Broadcasting and telecommunications | 2.7% (817) | 2.7% (447) | 2.7% (370) |
| Other transportation, and support activities, and couriers | 2.5% (756) | 3.7% (601) | 1.1% (155) |
| Real estate and rental and leasing | 2.5% (743) | 1.9% (310) | 3.1% (433) |
| Computer and electronic products | 2.2% (665) | 2.5% (408) | 1.9% (257) |
| Department and other general merchandise stores | 2.0% (605) | 1.4% (229) | 2.7% (376) |
| Religious, grantmaking, civic, professional, and similar organizations | 1.8% (547) | 1.3% (208) | 2.4% (339) |
| Repair and maintenance | 1.5% (453) | 2.2% (364) | 0.6% (89) |
| Social assistance | 1.4% (423) | 0.3% (52) | 2.7% (371) |
| Rail transportation | 1.4% (409) | 1.9% (314) | 0.7% (95) |
| Personal and laundry services | 1.4% (407) | 0.8% (127) | 2.0% (280) |
| Motor vehicle and parts dealers | 1.3% (401) | 2.0% (320) | 0.6% (81) |
| Arts, entertainment, and recreation | 1.3% (398) | 1.2% (191) | 1.5% (207) |
| Miscellaneous manufacturing | 1.2% (353) | 1.2% (188) | 1.2% (165) |
| Radio, TV, and computer stores | 1.2% (350) | 1.6% (256) | 0.7% (94) |
| Building material and garden equipment and supplies dealers | 1.1% (346) | 1.5% (236) | 0.8% (110) |
| Used merchandise, gift, novelty, and souvenir, and other miscellaneous stores | 1.0% (310) | 0.7% (113) | 1.4% (197) |
| Truck transportation | 1.0% (287) | 1.4% (226) | 0.4% (61) |
| Electrical and electronic goods merchant wholesalers | 0.9% (260) | 1.0% (163) | 0.7% (97) |
| Publishing, and motion picture and sound recording industries | 0.7% (222) | 0.7% (121) | 0.7% (101) |
| Machinery, equipment, and supplies merchant wholesalers | 0.7% (219) | 0.9% (154) | 0.5% (65) |
| U. S. Postal service | 0.7% (214) | 1.0% (170) | 0.3% (44) |
| Pharmacies and drug stores | 0.7% (211) | 0.4% (65) | 1.1% (146) |
| Furniture and home furnishings, and household appliance stores | 0.7% (208) | 0.6% (95) | 0.8% (113) |
| Clothing and accessories, including shoe, stores | 0.7% (202) | 0.5% (85) | 0.8% (117) |
| Data processing, libraries, and other information services | 0.7% (200) | 0.5% (87) | 0.8% (113) |
| Machinery | 0.6% (186) | 0.8% (137) | 0.4% (49) |
| Groceries and related products merchant wholesalers | 0.6% (182) | 0.7% (119) | 0.5% (63) |
| Metal and metal products | 0.6% (181) | 0.9% (153) | 0.2% (28) |
| Plastics and rubber products | 0.6% (166) | 0.9% (153) | 0.1% (13) |
| Other direct selling establishments | 0.5% (154) | 0.3% (51) | 0.7% (103) |
| Printing and related support activities | 0.5% (150) | 0.5% (75) | 0.5% (75) |
| Chemicals | 0.5% (145) | 0.5% (78) | 0.5% (67) |
| Professional and commercial equipment and supplies merchant wholesalers | 0.5% (142) | 0.5% (86) | 0.4% (56) |
| Utilities | 0.4% (135) | 0.7% (106) | 0.2% (29) |
| Sporting goods, camera, and hobby and toy stores | 0.4% (112) | 0.3% (47) | 0.5% (65) |
| Private households | 0.4% (106) | 0.0% (7) | 0.7% (99) |
| Food | 0.3% (102) | 0.4% (68) | 0.2% (34) |
| Miscellaneous nondurable goods merchant wholesalers | 0.3% (101) | 0.4% (63) | 0.3% (38) |
| Beverage and tobacco products | 0.3% (99) | 0.5% (76) | 0.2% (23) |
| Electrical equipment, appliances, and components | 0.3% (93) | 0.6% (93) | 0.0% (0) |
| Gasoline stations | 0.3% (90) | 0.4% (72) | 0.1% (18) |
| Drugs, sundries, and chemical and allied products merchant wholesalers | 0.3% (83) | 0.4% (57) | 0.2% (26) |
| Paper | 0.2% (73) | 0.3% (54) | 0.1% (19) |
| Miscellaneous durable goods merchant wholesalers | 0.2% (73) | 0.1% (13) | 0.4% (60) |
| Petroleum and petroleum products merchant wholesalers | 0.2% (64) | 0.3% (43) | 0.2% (21) |
| Health and personal care, except drug, stores | 0.2% (58) | 0.1% (9) | 0.4% (49) |
| Hardware, plumbing and heating equipment, and supplies merchant wholesalers | 0.2% (58) | 0.3% (43) | 0.1% (15) |
| Office supplies and stationery stores | 0.2% (56) | 0.1% (24) | 0.2% (32) |
| Jewelry, luggage, and leather goods stores | 0.2% (53) | 0.0% (0) | 0.4% (53) |
| Alcoholic beverages merchant wholesalers | 0.2% (48) | 0.2% (39) | 0.1% (9) |
| Nonmetallic mineral products | 0.2% (48) | 0.2% (39) | 0.1% (9) |
| Electronic shopping and mail-order houses | 0.2% (47) | 0.1% (16) | 0.2% (31) |
| Mining, quarrying, and oil and gas extraction | 0.2% (46) | 0.3% (41) | 0.0% (5) |
| Warehousing and storage | 0.1% (43) | 0.2% (33) | 0.1% (10) |
| Agriculture, forestry, fishing and hunting | 0.1% (40) | 0.1% (9) | 0.2% (31) |
| Management of companies and enterprises | 0.1% (40) | 0.1% (16) | 0.2% (24) |
| Recyclable material merchant wholesalers | 0.1% (35) | 0.1% (20) | 0.1% (15) |
| Motor vehicles, parts and supplies merchant wholesalers | 0.1% (34) | 0.2% (25) | 0.1% (9) |
| Retail florists | 0.1% (33) | 0.2% (26) | 0.1% (7) |
| Book stores and news dealers | 0.1% (33) | 0.1% (18) | 0.1% (15) |
| Furniture and related product manufacturing | 0.1% (32) | 0.2% (32) | 0.0% (0) |
| Music stores | 0.1% (27) | 0.1% (20) | 0.1% (7) |
| Leather and allied products | 0.1% (23) | 0.1% (23) | 0.0% (0) |
| Wood products | 0.1% (20) | 0.1% (20) | 0.0% (0) |
Unemployment in North Richland Hills
- Unemployment by race in 2022
- Unemployment rate for White non-Hispanic residents
- 1.6%Males
- Unemployment rate for Black residents
- 11.7%Males
- 3.8%Females
- Unemployment rate for American Indian and Alaska Native residents
- 6.5%Females
- Unemployment rate for Asian residents
- 1.1%Males
- 4.3%Females
- Unemployment rate for other race residents
- 3.4%Females
- Unemployment rate for two or more race residents
- 3.8%Males
- 2.9%Females
- Unemployment rate for Hispanic or Latino residents
- 3.2%Males
- 2.6%Females
- Unemployment by race in 2000
- Unemployment rate for White non-Hispanic residents
- 3.7%Males
- 4.0%Females
- Unemployment rate for Black residents
- 6.0%Males
- Unemployment rate for American Indian and Alaska Native residents
- 7.0%Males
- Unemployment rate for Asian residents
- 6.5%Males
- Unemployment rate for other race residents
- 5.0%Males
- 3.0%Females
- Unemployment rate for two or more race residents
- 7.2%Females
- Unemployment rate for Hispanic or Latino residents
- 3.1%Males
- 3.7%Females
Unemployment in 2023:
| North Richland Hills: | 2.8% |
| Texas: | 3.5% |
Unemployment in 2022:
| North Richland Hills: | 3.2% |
| Texas: | 3.9% |
Unemployment in 2021:
| North Richland Hills: | 4.6% |
| Texas: | 5.6% |
Unemployment in 2020:
| North Richland Hills: | 6.6% |
| Texas: | 7.7% |
Unemployment in 2019:
| North Richland Hills: | 3.0% |
| Texas: | 3.5% |
Unemployment in 2018:
| North Richland Hills: | 3.2% |
| Texas: | 3.9% |
Unemployment in 2017:
| North Richland Hills: | 3.4% |
| Texas: | 4.3% |
Unemployment in 2016:
| North Richland Hills: | 3.6% |
| Texas: | 4.6% |
Unemployment in 2015:
| North Richland Hills: | 3.6% |
| Texas: | 4.5% |
Unemployment in 2014:
| North Richland Hills: | 4.6% |
| Texas: | 5.2% |
Unemployment in 2013:
| North Richland Hills: | 5.5% |
| Texas: | 6.3% |
Unemployment in 2012:
| North Richland Hills: | 5.9% |
| Texas: | 6.7% |
Unemployment in 2011:
| North Richland Hills: | 7.1% |
| Texas: | 8.0% |
Unemployment in 2010:
| North Richland Hills: | 7.2% |
| Texas: | 8.2% |
Unemployment in 2009:
| North Richland Hills: | 6.0% |
| Texas: | 7.5% |
Unemployment in 2008:
| North Richland Hills: | 4.3% |
| Texas: | 4.9% |
Unemployment in 2007:
| North Richland Hills: | 3.8% |
| Texas: | 4.4% |
Unemployment in 2006:
| North Richland Hills: | 4.2% |
| Texas: | 5.0% |
Unemployment in 2005:
| North Richland Hills: | 4.6% |
| Texas: | 5.5% |
Unemployment in 2004:
| North Richland Hills: | 4.7% |
| Texas: | 6.0% |
Unemployment in 2003:
| North Richland Hills: | 5.3% |
| Texas: | 6.7% |
Unemployment in 2002:
| North Richland Hills: | 5.1% |
| Texas: | 6.3% |
Unemployment in 2001:
| North Richland Hills: | 3.7% |
| Texas: | 5.0% |
Unemployment in 2000:
| North Richland Hills: | 3.0% |
| Texas: | 4.4% |
Unemployment in 1999:
| North Richland Hills: | 2.4% |
| Texas: | 4.7% |
Unemployment in 1998:
| North Richland Hills: | 2.6% |
| Texas: | 5.0% |
Unemployment in 1997:
| North Richland Hills: | 2.8% |
| Texas: | 5.4% |
Unemployment in 1996:
| North Richland Hills: | 3.0% |
| Texas: | 5.8% |
Unemployment in 1995:
| North Richland Hills: | 3.8% |
| Texas: | 6.1% |
Unemployment in 1994:
| North Richland Hills: | 4.3% |
| Texas: | 6.6% |
Unemployment in 1993:
| North Richland Hills: | 4.9% |
| Texas: | 7.2% |
Unemployment in 1992:
| North Richland Hills: | 5.5% |
| Texas: | 7.7% |
Unemployment in 1991:
| North Richland Hills: | 5.4% |
| Texas: | 7.0% |
Unemployment in 1990:
| North Richland Hills: | 4.0% |
| Texas: | 6.4% |
Time leaving home to go to work
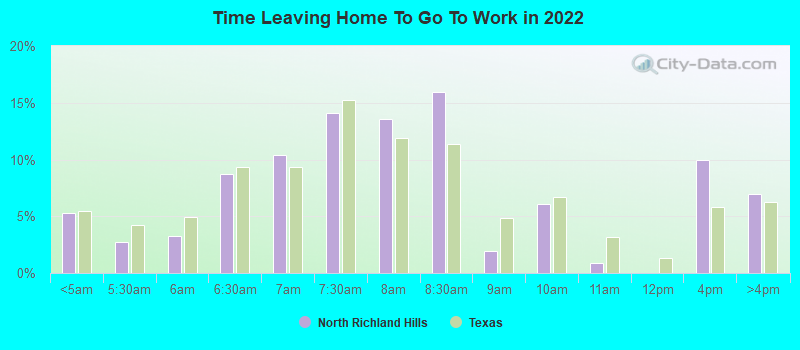
12:00 a.m. to 4:59 a.m.:
| North Richland Hills: | 5.3% (1,584) |
| Texas: | 5.5% (678,264) |
5:00 a.m. to 5:29 a.m.:
| North Richland Hills: | 2.8% (828) |
| Texas: | 4.3% (525,841) |
5:30 a.m. to 5:59 a.m.:
| North Richland Hills: | 3.3% (983) |
| Texas: | 4.9% (603,953) |
6:00 a.m. to 6:29 a.m.:
| North Richland Hills: | 8.8% (2,618) |
| Texas: | 9.4% (1,155,020) |
6:30 a.m. to 6:59 a.m.:
| North Richland Hills: | 10.4% (3,118) |
| Texas: | 9.3% (1,152,822) |
7:00 a.m. to 7:29 a.m.:
| North Richland Hills: | 14.1% (4,223) |
| Texas: | 15.3% (1,885,477) |
7:30 a.m. to 7:59 a.m.:
| North Richland Hills: | 13.6% (4,056) |
| Texas: | 11.9% (1,469,628) |
8:00 a.m. to 8:29 a.m.:
| North Richland Hills: | 15.9% (4,762) |
| Texas: | 11.3% (1,400,175) |
8:30 a.m. to 8:59 a.m.:
| North Richland Hills: | 2.0% (587) |
| Texas: | 4.9% (599,574) |
9:00 a.m. to 9:59 a.m.:
| North Richland Hills: | 6.1% (1,819) |
| Texas: | 6.7% (829,367) |
10:00 a.m. to 10:59 a.m.:
| North Richland Hills: | 0.8% (252) |
| Texas: | 3.2% (390,354) |
12:00 p.m. to 3:59 p.m.:
| North Richland Hills: | 9.9% (2,972) |
| Texas: | 5.8% (720,594) |
4:00 p.m. to 11:59 p.m.:
| North Richland Hills: | 6.9% (2,071) |
| Texas: | 6.3% (777,072) |

<5am:
| North Richland Hills: | 2.3% (675) |
| Texas: | 3.1% (281,361) |
5:30am:
| North Richland Hills: | 3.1% (924) |
| Texas: | 2.9% (262,060) |
6am:
| North Richland Hills: | 4.8% (1,425) |
| Texas: | 4.4% (403,423) |
6:30am:
| North Richland Hills: | 8.9% (2,633) |
| Texas: | 8.8% (808,876) |
7am:
| North Richland Hills: | 10.7% (3,186) |
| Texas: | 10.7% (976,557) |
7:30am:
| North Richland Hills: | 16.8% (5,002) |
| Texas: | 16.4% (1,500,904) |
8am:
| North Richland Hills: | 16.4% (4,870) |
| Texas: | 16.8% (1,536,308) |
8:30am:
| North Richland Hills: | 10.2% (3,018) |
| Texas: | 10.0% (913,601) |
9am:
| North Richland Hills: | 4.0% (1,198) |
| Texas: | 4.4% (398,656) |
10am:
| North Richland Hills: | 5.3% (1,566) |
| Texas: | 5.2% (472,592) |
11am:
| North Richland Hills: | 1.9% (568) |
| Texas: | 2.2% (197,844) |
12pm:
| North Richland Hills: | 0.9% (267) |
| Texas: | 0.9% (86,997) |
4pm:
| North Richland Hills: | 5.7% (1,679) |
| Texas: | 5.5% (503,565) |
>4pm:
| North Richland Hills: | 6.3% (1,882) |
| Texas: | 6.1% (563,107) |

12:00 a.m. to 4:59 a.m. - Males:
| North Richland Hills: | 7.3% (1,021) |
| Texas: | 7.0% (477,284) |
5:00 a.m. to 5:29 a.m. - Males:
| North Richland Hills: | 5.0% (703) |
| Texas: | 5.8% (394,876) |
5:30 a.m. to 5:59 a.m. - Males:
| North Richland Hills: | 7.0% (983) |
| Texas: | 5.9% (402,788) |
6:00 a.m. to 6:29 a.m. - Males:
| North Richland Hills: | 11.4% (1,609) |
| Texas: | 10.9% (751,118) |
6:30 a.m. to 6:59 a.m. - Males:
| North Richland Hills: | 7.6% (1,067) |
| Texas: | 9.5% (652,306) |
7:00 a.m. to 7:29 a.m. - Males:
| North Richland Hills: | 10.2% (1,427) |
| Texas: | 14.1% (970,598) |
7:30 a.m. to 7:59 a.m. - Males:
| North Richland Hills: | 13.6% (1,910) |
| Texas: | 10.2% (696,429) |
8:00 a.m. to 8:29 a.m. - Males:
| North Richland Hills: | 14.9% (2,095) |
| Texas: | 10.6% (729,041) |
8:30 a.m. to 8:59 a.m. - Males:
| North Richland Hills: | 0.7% (102) |
| Texas: | 4.1% (281,762) |
9:00 a.m. to 9:59 a.m. - Males:
| North Richland Hills: | 5.3% (749) |
| Texas: | 5.8% (401,071) |
10:00 a.m. to 10:59 a.m. - Males:
| North Richland Hills: | 0.4% (62) |
| Texas: | 2.7% (186,469) |
12:00 p.m. to 3:59 p.m. - Males:
| North Richland Hills: | 11.4% (1,598) |
| Texas: | 5.8% (397,795) |
4:00 p.m. to 11:59 p.m. - Males:
| North Richland Hills: | 5.2% (729) |
| Texas: | 6.4% (435,950) |

12:00 a.m. to 4:59 a.m. - Females:
| North Richland Hills: | 3.6% (563) |
| Texas: | 3.7% (200,980) |
5:00 a.m. to 5:29 a.m. - Females:
| North Richland Hills: | 0.8% (125) |
| Texas: | 2.4% (130,965) |
6:00 a.m. to 6:29 a.m. - Females:
| North Richland Hills: | 6.4% (1,009) |
| Texas: | 7.4% (403,902) |
6:30 a.m. to 6:59 a.m. - Females:
| North Richland Hills: | 13.0% (2,051) |
| Texas: | 9.1% (500,516) |
7:00 a.m. to 7:29 a.m. - Females:
| North Richland Hills: | 17.7% (2,796) |
| Texas: | 16.7% (914,879) |
7:30 a.m. to 7:59 a.m. - Females:
| North Richland Hills: | 13.6% (2,146) |
| Texas: | 14.1% (773,199) |
8:00 a.m. to 8:29 a.m. - Females:
| North Richland Hills: | 16.9% (2,667) |
| Texas: | 12.2% (671,134) |
8:30 a.m. to 8:59 a.m. - Females:
| North Richland Hills: | 3.1% (485) |
| Texas: | 5.8% (317,812) |
9:00 a.m. to 9:59 a.m. - Females:
| North Richland Hills: | 6.8% (1,070) |
| Texas: | 7.8% (428,296) |
10:00 a.m. to 10:59 a.m. - Females:
| North Richland Hills: | 1.2% (190) |
| Texas: | 3.7% (203,885) |
12:00 p.m. to 3:59 p.m. - Females:
| North Richland Hills: | 8.7% (1,374) |
| Texas: | 5.9% (322,799) |
4:00 p.m. to 11:59 p.m. - Females:
| North Richland Hills: | 8.5% (1,342) |
| Texas: | 6.2% (341,122) |
Travel time to work
Percentage of workers working in this county: 80.3%
Number of people working at home: 4,793 (12.8% of all workers)
Daytime population change due to commuting: -13,465 (-24.2%)
Workers who live and work in this city: 4,377 (14.7%)
Number of people working at home: 4,793 (12.8% of all workers)
Daytime population change due to commuting: -13,465 (-24.2%)
Workers who live and work in this city: 4,377 (14.7%)

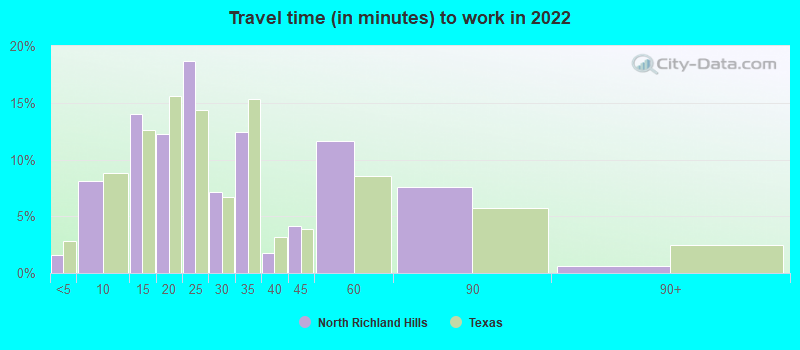

Less than 5 minutes:
| North Richland Hills: | 1.6% (302) |
| Texas: | 2.8% (350,462) |
5 to 9 minutes:
| North Richland Hills: | 8.1% (1,504) |
| Texas: | 8.8% (1,087,762) |
10 to 14 minutes:
| North Richland Hills: | 14.0% (2,604) |
| Texas: | 12.6% (1,550,271) |
15 to 19 minutes:
| North Richland Hills: | 12.2% (2,271) |
| Texas: | 15.6% (1,918,353) |
20 to 24 minutes:
| North Richland Hills: | 18.7% (3,468) |
| Texas: | 14.4% (1,772,079) |
25 to 29 minutes:
| North Richland Hills: | 7.2% (1,331) |
| Texas: | 6.7% (827,833) |
30 to 34 minutes:
| North Richland Hills: | 12.4% (2,308) |
| Texas: | 15.3% (1,887,878) |
35 to 39 minutes:
| North Richland Hills: | 1.8% (332) |
| Texas: | 3.2% (394,170) |
40 to 44 minutes:
| North Richland Hills: | 4.1% (761) |
| Texas: | 3.9% (476,118) |
45 to 59 minutes:
| North Richland Hills: | 11.6% (2,160) |
| Texas: | 8.6% (1,058,376) |
60 to 89 minutes:
| North Richland Hills: | 7.6% (1,412) |
| Texas: | 5.7% (706,002) |
90 or more minutes:
| North Richland Hills: | 0.6% (112) |
| Texas: | 2.4% (299,884) |


Less than 5 minutes:
| North Richland Hills: | 1.3% (379) |
| Texas: | 3.0% (277,642) |
5 to 9 minutes:
| North Richland Hills: | 7.8% (2,323) |
| Texas: | 10.3% (942,891) |
10 to 14 minutes:
| North Richland Hills: | 12.1% (3,605) |
| Texas: | 14.4% (1,317,555) |
15 to 19 minutes:
| North Richland Hills: | 13.3% (3,952) |
| Texas: | 16.0% (1,467,945) |
20 to 24 minutes:
| North Richland Hills: | 16.6% (4,939) |
| Texas: | 13.9% (1,276,781) |
25 to 29 minutes:
| North Richland Hills: | 8.0% (2,388) |
| Texas: | 5.3% (482,838) |
30 to 34 minutes:
| North Richland Hills: | 17.1% (5,076) |
| Texas: | 14.3% (1,309,699) |
35 to 39 minutes:
| North Richland Hills: | 3.3% (966) |
| Texas: | 2.4% (219,873) |
40 to 44 minutes:
| North Richland Hills: | 3.3% (971) |
| Texas: | 3.1% (280,916) |
45 to 59 minutes:
| North Richland Hills: | 7.9% (2,347) |
| Texas: | 7.6% (692,006) |
60 to 89 minutes:
| North Richland Hills: | 4.7% (1,403) |
| Texas: | 4.6% (418,905) |
90 or more minutes:
| North Richland Hills: | 1.8% (544) |
| Texas: | 2.4% (218,800) |

Less than 5 minutes - Males:
| North Richland Hills: | 2.4% (244) |
| Texas: | 2.7% (181,937) |
5 to 9 minutes - Males:
| North Richland Hills: | 4.5% (462) |
| Texas: | 7.6% (522,166) |
10 to 14 minutes - Males:
| North Richland Hills: | 13.8% (1,403) |
| Texas: | 11.5% (785,572) |
15 to 19 minutes - Males:
| North Richland Hills: | 15.0% (1,529) |
| Texas: | 14.6% (1,001,179) |
20 to 24 minutes - Males:
| North Richland Hills: | 20.8% (2,113) |
| Texas: | 13.9% (950,043) |
25 to 29 minutes - Males:
| North Richland Hills: | 7.6% (778) |
| Texas: | 6.7% (457,259) |
30 to 34 minutes - Males:
| North Richland Hills: | 5.2% (527) |
| Texas: | 16.2% (1,110,357) |
35 to 39 minutes - Males:
| North Richland Hills: | 1.9% (194) |
| Texas: | 3.3% (223,512) |
40 to 44 minutes - Males:
| North Richland Hills: | 6.2% (629) |
| Texas: | 4.2% (289,434) |
45 to 59 minutes - Males:
| North Richland Hills: | 8.1% (827) |
| Texas: | 9.3% (639,122) |
60 to 89 minutes - Males:
| North Richland Hills: | 13.4% (1,363) |
| Texas: | 6.8% (467,154) |
90 or more minutes - Males:
| North Richland Hills: | 1.1% (112) |
| Texas: | 3.1% (211,313) |

Less than 5 minutes - Females:
| North Richland Hills: | 0.7% (58) |
| Texas: | 3.1% (168,525) |
5 to 9 minutes - Females:
| North Richland Hills: | 12.4% (1,042) |
| Texas: | 10.3% (565,596) |
10 to 14 minutes - Females:
| North Richland Hills: | 14.3% (1,201) |
| Texas: | 13.9% (764,699) |
15 to 19 minutes - Females:
| North Richland Hills: | 8.9% (742) |
| Texas: | 16.7% (917,174) |
20 to 24 minutes - Females:
| North Richland Hills: | 16.2% (1,355) |
| Texas: | 15.0% (822,036) |
25 to 29 minutes - Females:
| North Richland Hills: | 6.6% (553) |
| Texas: | 6.7% (370,574) |
30 to 34 minutes - Females:
| North Richland Hills: | 21.2% (1,781) |
| Texas: | 14.2% (777,521) |
35 to 39 minutes - Females:
| North Richland Hills: | 1.6% (138) |
| Texas: | 3.1% (170,658) |
40 to 44 minutes - Females:
| North Richland Hills: | 1.6% (132) |
| Texas: | 3.4% (186,684) |
45 to 59 minutes - Females:
| North Richland Hills: | 15.9% (1,333) |
| Texas: | 7.6% (419,254) |
60 to 89 minutes - Females:
| North Richland Hills: | 0.6% (49) |
| Texas: | 4.4% (238,848) |
Means of transportation to work
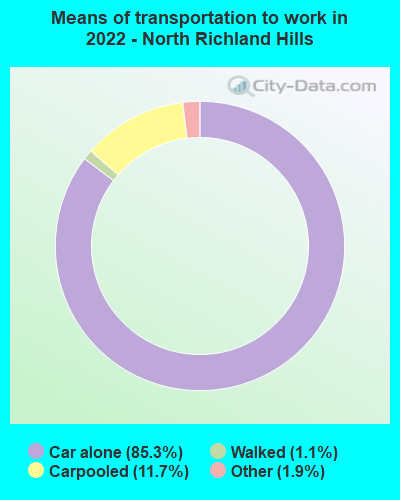

Drove car alone:
| North Richland Hills: | 85.3% (19,296) |
| Texas: | 83.3% (4,557,023) |
Carpooled:
| North Richland Hills: | 11.7% (2,650) |
| Texas: | 11.7% (674,818) |
Bicycle:
| North Richland Hills: | 0.0% (8) |
| Texas: | 0.2% (7,954) |
Walked:
| North Richland Hills: | 1.1% (250) |
| Texas: | 1.7% (99,911) |
Other means:
| North Richland Hills: | 1.9% (421) |
| Texas: | 2.0% (95,481) |


Drove car alone:
| North Richland Hills: | 86.7% (25,728) |
| Texas: | 77.7% (7,115,590) |
Carpooled:
| North Richland Hills: | 8.7% (2,573) |
| Texas: | 14.5% (1,326,012) |
Bus or trolley bus:
| North Richland Hills: | 0.1% (23) |
| Texas: | 1.7% (157,014) |
Ferryboat:
| North Richland Hills: | 0.0% (8) |
| Texas: | 0.0% (738) |
Taxicab:
| North Richland Hills: | 0.0% (7) |
| Texas: | 0.1% (6,102) |
Motorcycle:
| North Richland Hills: | 0.1% (24) |
| Texas: | 0.1% (12,068) |
Bicycle:
| North Richland Hills: | 0.1% (44) |
| Texas: | 0.2% (21,551) |
Walked:
| North Richland Hills: | 0.9% (270) |
| Texas: | 1.9% (173,670) |
Other means:
| North Richland Hills: | 0.7% (216) |
| Texas: | 0.9% (86,692) |


Drove car alone - Males:
| North Richland Hills: | 83.9% (9,009) |
| Texas: | 83.6% (4,557,023) |
Carpooled - Males:
| North Richland Hills: | 13.3% (1,430) |
| Texas: | 11.2% (674,818) |
Bicycle - Males:
| North Richland Hills: | 0.1% (8) |
| Texas: | 0.3% (7,954) |
Walked - Males:
| North Richland Hills: | 1.2% (126) |
| Texas: | 1.7% (99,911) |
Other means - Males:
| North Richland Hills: | 1.5% (159) |
| Texas: | 2.2% (95,481) |


Drove car alone - Females:
| North Richland Hills: | 86.6% (10,361) |
| Texas: | 83.0% (4,557,023) |
Carpooled - Females:
| North Richland Hills: | 10.2% (1,219) |
| Texas: | 12.3% (674,818) |
Walked - Females:
| North Richland Hills: | 1.0% (124) |
| Texas: | 1.8% (99,911) |
Other means - Females:
| North Richland Hills: | 2.2% (265) |
| Texas: | 1.7% (95,481) |
Private vehicle occupancy

Drove alone:
| North Richland Hills: | 88.6% (26,961) |
| Texas: | 87.6% (10,283,021) |
In 2 person carpool:
| North Richland Hills: | 6.4% (1,951) |
| Texas: | 9.0% (1,052,595) |
In 3 person carpool:
| North Richland Hills: | 4.1% (1,255) |
| Texas: | 2.1% (244,139) |
In 4 person carpool:
| North Richland Hills: | 0.3% (87) |
| Texas: | 0.8% (92,732) |
In 5-6 person carpool:
| North Richland Hills: | 0.5% (142) |
| Texas: | 0.4% (44,947) |
In 7+ person carpool:
| North Richland Hills: | 0.1% (35) |
| Texas: | 0.1% (16,725) |

Drove alone:
| North Richland Hills: | 90.9% (25,728) |
| Texas: | 84.3% (7,115,590) |
In 2 person carpool:
| North Richland Hills: | 7.5% (2,134) |
| Texas: | 11.6% (982,994) |
In 3 person carpool:
| North Richland Hills: | 1.0% (279) |
| Texas: | 2.4% (201,602) |
In 4 person carpool:
| North Richland Hills: | 0.2% (49) |
| Texas: | 1.0% (83,518) |
In 5-6 person carpool:
| North Richland Hills: | 0.3% (77) |
| Texas: | 0.5% (40,662) |
In 7+ person carpool:
| North Richland Hills: | 0.1% (34) |
| Texas: | 0.2% (17,236) |
Class of workers
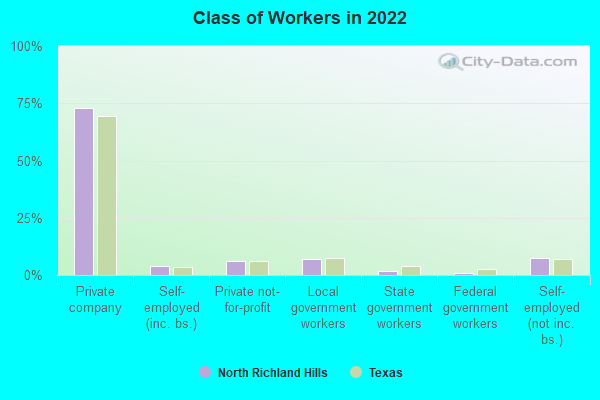
Employee of private company:
| North Richland Hills: | 73.1% (27,215) |
| Texas: | 69.6% (10,139,666) |
Self-employed in own incorporated business:
| North Richland Hills: | 4.1% (1,513) |
| Texas: | 3.5% (516,446) |
Private not-for-profit wage and salary workers:
| North Richland Hills: | 6.0% (2,227) |
| Texas: | 6.0% (870,454) |
Local government workers:
| North Richland Hills: | 7.1% (2,639) |
| Texas: | 7.6% (1,109,799) |
State government workers:
| North Richland Hills: | 1.5% (568) |
| Texas: | 3.8% (558,618) |
Federal government workers:
| North Richland Hills: | 0.7% (256) |
| Texas: | 2.5% (357,298) |
Self-employed workers in own not incorporated business:
| North Richland Hills: | 7.4% (2,763) |
| Texas: | 6.8% (998,270) |
Unpaid family workers:
| North Richland Hills: | 0.2% (64) |
| Texas: | 0.2% (27,882) |

Employee of private company:
| North Richland Hills: | 76.3% (22,957) |
| Texas: | 69.6% (6,425,274) |
Self-employed in own incorporated business:
| North Richland Hills: | 2.2% (676) |
| Texas: | 2.7% (250,864) |
Private not-for-profit wage and salary workers:
| North Richland Hills: | 5.3% (1,607) |
| Texas: | 5.7% (526,631) |
Local government workers:
| North Richland Hills: | 5.7% (1,707) |
| Texas: | 6.6% (608,479) |
State government workers:
| North Richland Hills: | 2.2% (657) |
| Texas: | 5.4% (501,082) |
Federal government workers:
| North Richland Hills: | 2.0% (601) |
| Texas: | 2.6% (237,177) |
Self-employed workers in own not incorporated business:
| North Richland Hills: | 6.1% (1,836) |
| Texas: | 7.1% (653,527) |
Unpaid family workers:
| North Richland Hills: | 0.2% (60) |
| Texas: | 0.3% (31,338) |

Employee of private company - Males:
| North Richland Hills: | 77.1% (14,013) |
| Texas: | 73.1% (5,788,450) |
Self-employed in own incorporated business - Males:
| North Richland Hills: | 6.5% (1,186) |
| Texas: | 4.2% (332,655) |
Private not-for-profit wage and salary workers - Males:
| North Richland Hills: | 2.0% (358) |
| Texas: | 4.1% (323,476) |
Local government workers - Males:
| North Richland Hills: | 3.9% (709) |
| Texas: | 5.1% (405,467) |
State government workers - Males:
| North Richland Hills: | 1.1% (205) |
| Texas: | 3.0% (236,706) |
Federal government workers - Males:
| North Richland Hills: | 0.9% (157) |
| Texas: | 2.7% (211,629) |
Self-employed workers in own not incorporated business - Males:
| North Richland Hills: | 8.5% (1,551) |
| Texas: | 7.7% (609,246) |

Employee of private company - Females:
| North Richland Hills: | 69.2% (13,202) |
| Texas: | 65.4% (4,351,216) |
Self-employed in own incorporated business - Females:
| North Richland Hills: | 1.7% (327) |
| Texas: | 2.8% (183,791) |
Private not-for-profit wage and salary workers - Females:
| North Richland Hills: | 9.8% (1,869) |
| Texas: | 8.2% (546,978) |
Local government workers - Females:
| North Richland Hills: | 10.1% (1,930) |
| Texas: | 10.6% (704,332) |
State government workers - Females:
| North Richland Hills: | 1.9% (363) |
| Texas: | 4.8% (321,912) |
Federal government workers - Females:
| North Richland Hills: | 0.5% (99) |
| Texas: | 2.2% (145,669) |
Self-employed workers in own not incorporated business - Females:
| North Richland Hills: | 6.4% (1,212) |
| Texas: | 5.8% (389,024) |
Unpaid family workers - Females:
| North Richland Hills: | 0.3% (64) |
| Texas: | 0.2% (15,276) |