Latest news about work in Moran, TX collected exclusively by city-data.com from local newspapers, TV, and radio stations
The most common industries in Moran are: Food & beverage stores (16.7% of civilian employees), Educational services (13.3% of civilian employees), Health care (11.1% of civilian employees). 73.5% of workers work in Shackelford County and 10.2% of all workers work at home. 72.1% of workers are employees of private companies, which is 3.6% greater than the rate of 69.6% across the entire state of Texas.
Whole page based on the data from 2000 / 2022 when the population of Moran, Texas was 233 / 174
Most common industries
Most common industries
Industry
All
Males
Females
Food and beverage stores
16.7% (15)
23.4% (11)
9.3% (4)
Educational services
13.3% (12)
10.6% (5)
16.3% (7)
Health care
11.1% (10)
0.0% (0)
23.3% (10)
Mining, quarrying, and oil and gas extraction
8.9% (8)
17.0% (8)
0.0% (0)
Public administration
6.7% (6)
4.3% (2)
9.3% (4)
Finance and insurance
6.7% (6)
0.0% (0)
14.0% (6)
Construction
4.4% (4)
8.5% (4)
0.0% (0)
Accommodation and food services
4.4% (4)
8.5% (4)
0.0% (0)
Repair and maintenance
4.4% (4)
8.5% (4)
0.0% (0)
Furniture and home furnishings, and household appliance stores
3.3% (3)
0.0% (0)
7.0% (3)
Other direct selling establishments
3.3% (3)
0.0% (0)
7.0% (3)
Plastics and rubber products
2.2% (2)
4.3% (2)
0.0% (0)
Machinery
2.2% (2)
4.3% (2)
0.0% (0)
U. S. Postal service
2.2% (2)
0.0% (0)
4.7% (2)
Other transportation, and support activities, and couriers
2.2% (2)
4.3% (2)
0.0% (0)
Utilities
2.2% (2)
0.0% (0)
4.7% (2)
Personal and laundry services
2.2% (2)
0.0% (0)
4.7% (2)
Religious, grantmaking, civic, professional, and similar organizations
2.2% (2)
4.3% (2)
0.0% (0)
Food
1.1% (1)
2.1% (1)
0.0% (0)
Unemployment in Moran
Unemployment by race in 2022
Unemployment rate for White non-Hispanic residents
5.0%Females
Unemployment by race in 2000
Unemployment rate for White non-Hispanic residents
15.1%Males
Unemployment rate for Hispanic or Latino residents
50.0%Males
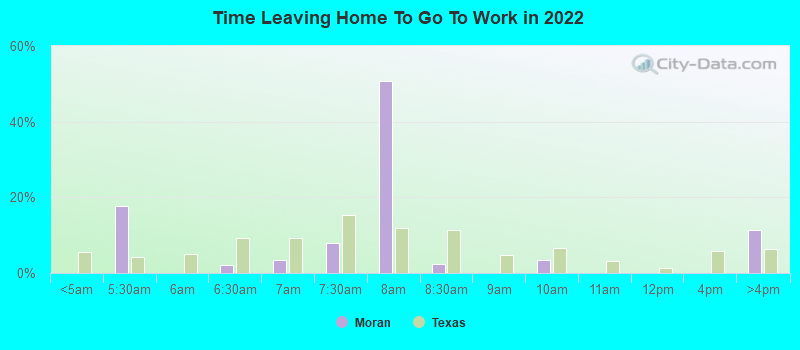
Time leaving home to go to work
5:00 a.m. to 5:29 a.m.:
Moran:
17.6% (16)
Texas:
4.3% (525,841)
6:00 a.m. to 6:29 a.m.:
Moran:
2.2% (2)
Texas:
9.4% (1,155,020)
6:30 a.m. to 6:59 a.m.:
Moran:
3.4% (3)
Texas:
9.3% (1,152,822)
7:00 a.m. to 7:29 a.m.:
Moran:
7.8% (7)
Texas:
15.3% (1,885,477)
7:30 a.m. to 7:59 a.m.:
Moran:
50.8% (45)
Texas:
11.9% (1,469,628)
8:00 a.m. to 8:29 a.m.:
Moran:
2.3% (2)
Texas:
11.3% (1,400,175)
9:00 a.m. to 9:59 a.m.:
Moran:
3.5% (3)
Texas:
6.7% (829,367)
4:00 p.m. to 11:59 p.m.:
Moran:
11.4% (10)
Texas:
6.3% (777,072)
<5am:
Moran:
1.1% (1)
Texas:
3.1% (281,361)
5:30am:
Moran:
2.2% (2)
Texas:
2.9% (262,060)
6:30am:
Moran:
7.8% (7)
Texas:
8.8% (808,876)
7am:
Moran:
26.7% (24)
Texas:
10.7% (976,557)
7:30am:
Moran:
16.7% (15)
Texas:
16.4% (1,500,904)
8am:
Moran:
11.1% (10)
Texas:
16.8% (1,536,308)
8:30am:
Moran:
11.1% (10)
Texas:
10.0% (913,601)
10am:
Moran:
6.7% (6)
Texas:
5.2% (472,592)
4pm:
Moran:
4.4% (4)
Texas:
5.5% (503,565)
>4pm:
Moran:
8.9% (8)
Texas:
6.1% (563,107)
5:00 a.m. to 5:29 a.m. - Males:
Moran:
58.7% (16)
Texas:
5.8% (394,876)
6:00 a.m. to 6:29 a.m. - Males:
Moran:
7.2% (2)
Texas:
10.9% (751,118)
7:00 a.m. to 7:29 a.m. - Males:
Moran:
25.0% (7)
Texas:
14.1% (970,598)
9:00 a.m. to 9:59 a.m. - Males:
Moran:
7.5% (2)
Texas:
5.8% (401,071)
6:30 a.m. to 6:59 a.m. - Females:
Moran:
4.7% (3)
Texas:
9.1% (500,516)
7:30 a.m. to 7:59 a.m. - Females:
Moran:
73.5% (45)
Texas:
14.1% (773,199)
8:00 a.m. to 8:29 a.m. - Females:
Moran:
3.4% (2)
Texas:
12.2% (671,134)
9:00 a.m. to 9:59 a.m. - Females:
Moran:
1.7% (1)
Texas:
7.8% (428,296)
4:00 p.m. to 11:59 p.m. - Females:
Moran:
16.0% (10)
Texas:
6.2% (341,122)
Travel time to work
Percentage of workers working in this county: 73.5% Number of people working at home: 10 (10.2% of all workers)
Less than 5 minutes:
Moran:
16.7% (15)
Texas:
3.0% (277,642)
5 to 9 minutes:
Moran:
3.3% (3)
Texas:
10.3% (942,891)
10 to 14 minutes:
Moran:
4.4% (4)
Texas:
14.4% (1,317,555)
15 to 19 minutes:
Moran:
11.1% (10)
Texas:
16.0% (1,467,945)
20 to 24 minutes:
Moran:
13.3% (12)
Texas:
13.9% (1,276,781)
25 to 29 minutes:
Moran:
4.4% (4)
Texas:
5.3% (482,838)
30 to 34 minutes:
Moran:
16.7% (15)
Texas:
14.3% (1,309,699)
35 to 39 minutes:
Moran:
4.4% (4)
Texas:
2.4% (219,873)
40 to 44 minutes:
Moran:
6.7% (6)
Texas:
3.1% (280,916)
45 to 59 minutes:
Moran:
12.2% (11)
Texas:
7.6% (692,006)
60 to 89 minutes:
Moran:
1.1% (1)
Texas:
4.6% (418,905)
90 or more minutes:
Moran:
2.2% (2)
Texas:
2.4% (218,800)
Means of transportation to work
Drove car alone:
Moran:
82.2% (74)
Texas:
77.7% (7,115,590)
Carpooled:
Moran:
7.8% (7)
Texas:
14.5% (1,326,012)
Walked:
Moran:
4.4% (4)
Texas:
1.9% (173,670)
Other means:
Moran:
2.2% (2)
Texas:
0.9% (86,692)
Private vehicle occupancy
Drove alone:
Moran:
82.2% (60)
Texas:
87.6% (10,283,021)
In 2 person carpool:
Moran:
17.8% (13)
Texas:
9.0% (1,052,595)
Drove alone:
Moran:
91.4% (74)
Texas:
84.3% (7,115,590)
In 2 person carpool:
Moran:
4.9% (4)
Texas:
11.6% (982,994)
In 3 person carpool:
Moran:
3.7% (3)
Texas:
2.4% (201,602)
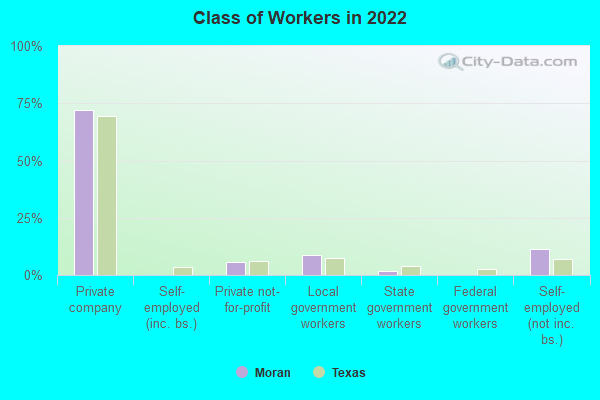
Class of workers
Employee of private company:
Moran:
72.1% (79)
Texas:
69.6% (10,139,666)
Private not-for-profit wage and salary workers:
Moran:
5.8% (6)
Texas:
6.0% (870,454)
Local government workers:
Moran:
8.7% (9)
Texas:
7.6% (1,109,799)
State government workers:
Moran:
1.9% (2)
Texas:
3.8% (558,618)
Self-employed workers in own not incorporated business:
Moran:
11.5% (13)
Texas:
6.8% (998,270)
Employee of private company:
Moran:
63.3% (57)
Texas:
69.6% (6,425,274)
Private not-for-profit wage and salary workers:
Moran:
4.4% (4)
Texas:
5.7% (526,631)
Local government workers:
Moran:
14.4% (13)
Texas:
6.6% (608,479)
State government workers:
Moran:
3.3% (3)
Texas:
5.4% (501,082)
Federal government workers:
Moran:
4.4% (4)
Texas:
2.6% (237,177)
Self-employed workers in own not incorporated business:
Moran:
10.0% (9)
Texas:
7.1% (653,527)
Employee of private company - Males:
Moran:
94.1% (34)
Texas:
73.1% (5,788,450)
Self-employed workers in own not incorporated business - Males:
Moran:
5.9% (2)
Texas:
7.7% (609,246)
Employee of private company - Females:
Moran:
61.4% (45)
Texas:
65.4% (4,351,216)
Private not-for-profit wage and salary workers - Females:
Moran:
8.6% (6)
Texas:
8.2% (546,978)
Local government workers - Females:
Moran:
12.9% (9)
Texas:
10.6% (704,332)
State government workers - Females:
Moran:
2.9% (2)
Texas:
4.8% (321,912)
Self-employed workers in own not incorporated business - Females:
Moran:
14.3% (10)
Texas:
5.8% (389,024)
Discuss Moran, Texas (TX) on our hugely popular Texas forum.