Work and Jobs in Laguna, California (CA) Detailed Stats
Occupations, Industries, Unemployment, Workers, Commute

Recent posts about work in Laguna, California on our local forum with over 2,400,000 registered users:
 | State, Federal, County jobs in San Diego or nearby? (13 replies) |
| CA Urban Areas Top Median Income Ranking For Dual-Income Families (5 replies) |
| Laguna vs. Newport - Which is better? (31 replies) |
| 2020 Census: CA Places by Average Family Income, $250,000+ (4 replies) |
| Laguna Hills vs Carlsbad/Oceanside for relocating military officer (4 replies) |
| Laguna Beach (17 replies) |
Latest news about work in Laguna, CA collected exclusively by city-data.com from local newspapers, TV, and radio stations
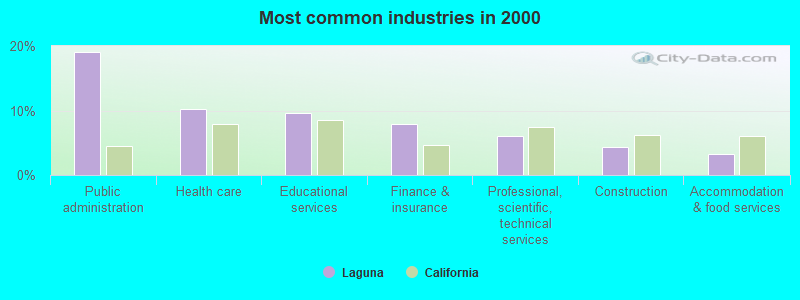
The most common industries in Laguna are: Public administration (19.1% of civilian employees), Health care (10.2% of civilian employees), Educational services (9.6% of civilian employees). 53.0% of workers are employees of private companies, which is 28.2% less than the rate of 68.0% across the entire state of California.
Most common industries
Most common industries | |||
|---|---|---|---|
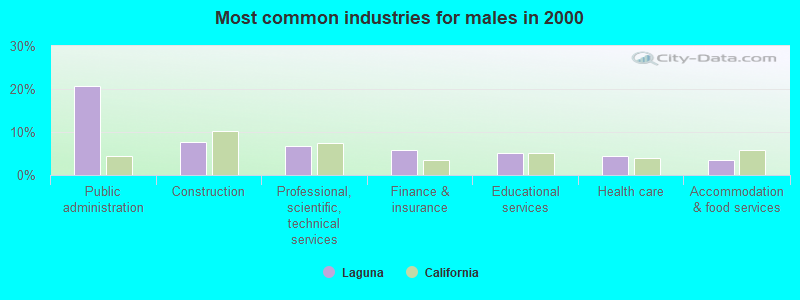
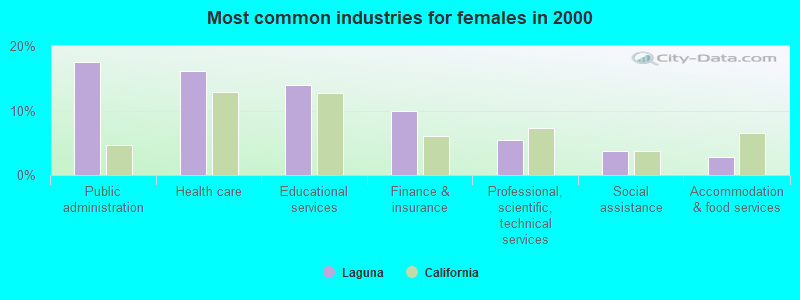
Industry | All | Males | Females |
| Public administration | 19.1% (3,302) | 20.6% (1,802) | 17.5% (1,500) |
| Health care | 10.2% (1,762) | 4.4% (383) | 16.1% (1,379) |
| Educational services | 9.6% (1,658) | 5.2% (456) | 14.0% (1,202) |
| Finance and insurance | 7.9% (1,368) | 5.9% (517) | 9.9% (851) |
| Professional, scientific, and technical services | 6.1% (1,050) | 6.7% (585) | 5.4% (465) |
| Construction | 4.3% (749) | 7.8% (680) | 0.8% (69) |
| Accommodation and food services | 3.2% (552) | 3.6% (311) | 2.8% (241) |
| Computer and electronic products | 3.0% (520) | 3.5% (303) | 2.5% (217) |
| Food and beverage stores | 2.7% (460) | 2.8% (248) | 2.5% (212) |
| Broadcasting and telecommunications | 2.6% (451) | 2.7% (240) | 2.5% (211) |
| Administrative and support and waste management services | 2.5% (436) | 3.0% (265) | 2.0% (171) |
| Social assistance | 2.3% (399) | 0.9% (77) | 3.8% (322) |
| Real estate and rental and leasing | 2.0% (350) | 2.1% (180) | 2.0% (170) |
| Other transportation, and support activities, and couriers | 1.6% (280) | 2.2% (189) | 1.1% (91) |
| Religious, grantmaking, civic, professional, and similar organizations | 1.5% (264) | 1.4% (120) | 1.7% (144) |
| Department and other general merchandise stores | 1.2% (213) | 0.9% (81) | 1.5% (132) |
| Arts, entertainment, and recreation | 1.2% (212) | 1.3% (118) | 1.1% (94) |
| Personal and laundry services | 1.2% (210) | 0.9% (75) | 1.6% (135) |
| Truck transportation | 1.0% (180) | 1.9% (168) | 0.1% (12) |
| Utilities | 0.9% (164) | 0.9% (83) | 0.9% (81) |
| U. S. Postal service | 0.9% (158) | 1.2% (109) | 0.6% (49) |
| Publishing, and motion picture and sound recording industries | 0.9% (157) | 1.2% (106) | 0.6% (51) |
| Food | 0.8% (147) | 1.1% (100) | 0.5% (47) |
| Repair and maintenance | 0.8% (147) | 1.5% (128) | 0.2% (19) |
| Motor vehicle and parts dealers | 0.8% (139) | 1.5% (128) | 0.1% (11) |
| Groceries and related products merchant wholesalers | 0.7% (120) | 1.1% (100) | 0.2% (20) |
| Professional and commercial equipment and supplies merchant wholesalers | 0.6% (111) | 0.9% (78) | 0.4% (33) |
| Radio, TV, and computer stores | 0.5% (95) | 0.8% (70) | 0.3% (25) |
| Used merchandise, gift, novelty, and souvenir, and other miscellaneous stores | 0.5% (94) | 0.5% (45) | 0.6% (49) |
| Miscellaneous manufacturing | 0.5% (89) | 0.6% (49) | 0.5% (40) |
| Metal and metal products | 0.5% (81) | 0.6% (55) | 0.3% (26) |
| Other direct selling establishments | 0.5% (78) | 0.3% (26) | 0.6% (52) |
| Clothing and accessories, including shoe, stores | 0.4% (75) | 0.4% (35) | 0.5% (40) |
| Transportation equipment | 0.4% (74) | 0.8% (74) | 0.0% (0) |
| Pharmacies and drug stores | 0.4% (71) | 0.2% (16) | 0.6% (55) |
| Air transportation | 0.4% (65) | 0.5% (41) | 0.3% (24) |
| Building material and garden equipment and supplies dealers | 0.4% (63) | 0.5% (40) | 0.3% (23) |
| Chemicals | 0.4% (61) | 0.5% (45) | 0.2% (16) |
| Electrical and electronic goods merchant wholesalers | 0.4% (61) | 0.4% (36) | 0.3% (25) |
| Agriculture, forestry, fishing and hunting | 0.3% (60) | 0.5% (45) | 0.2% (15) |
| Warehousing and storage | 0.3% (52) | 0.6% (52) | 0.0% (0) |
| Gasoline stations | 0.3% (51) | 0.4% (35) | 0.2% (16) |
| Printing and related support activities | 0.3% (50) | 0.4% (38) | 0.1% (12) |
| Machinery, equipment, and supplies merchant wholesalers | 0.3% (49) | 0.5% (42) | 0.1% (7) |
| Furniture and home furnishings, and household appliance stores | 0.3% (49) | 0.2% (20) | 0.3% (29) |
| Motor vehicles, parts and supplies merchant wholesalers | 0.2% (37) | 0.4% (37) | 0.0% (0) |
| Miscellaneous nondurable goods merchant wholesalers | 0.2% (36) | 0.1% (10) | 0.3% (26) |
| Plastics and rubber products | 0.2% (36) | 0.3% (30) | 0.1% (6) |
| Book stores and news dealers | 0.2% (32) | 0.3% (24) | 0.1% (8) |
| Data processing, libraries, and other information services | 0.2% (32) | 0.1% (13) | 0.2% (19) |
| Rail transportation | 0.2% (27) | 0.1% (11) | 0.2% (16) |
| Paper | 0.2% (27) | 0.3% (22) | 0.1% (5) |
| Petroleum and petroleum products merchant wholesalers | 0.1% (21) | 0.2% (21) | 0.0% (0) |
| Office supplies and stationery stores | 0.1% (19) | 0.1% (7) | 0.1% (12) |
| Machinery | 0.1% (19) | 0.0% (4) | 0.2% (15) |
| Paper and paper products merchant wholesalers | 0.1% (18) | 0.2% (18) | 0.0% (0) |
| Furniture and related product manufacturing | 0.1% (18) | 0.2% (18) | 0.0% (0) |
| Sporting goods, camera, and hobby and toy stores | 0.1% (18) | 0.0% (0) | 0.2% (18) |
| Alcoholic beverages merchant wholesalers | 0.1% (18) | 0.2% (18) | 0.0% (0) |
| Lumber and other construction materials merchant wholesalers | 0.1% (17) | 0.2% (17) | 0.0% (0) |
| Apparel, fabrics, and notions merchant wholesalers | 0.1% (14) | 0.2% (14) | 0.0% (0) |
| Wood products | 0.1% (14) | 0.2% (14) | 0.0% (0) |
| Furniture and home furnishing merchant wholesalers | 0.1% (11) | 0.1% (11) | 0.0% (0) |
| Hardware, plumbing and heating equipment, and supplies merchant wholesalers | 0.1% (10) | 0.1% (10) | 0.0% (0) |
| Miscellaneous durable goods merchant wholesalers | 0.1% (9) | 0.1% (9) | 0.0% (0) |
| Electrical equipment, appliances, and components | 0.1% (9) | 0.1% (9) | 0.0% (0) |
Unemployment in Laguna
- Unemployment by race in 2000
- Unemployment rate for White non-Hispanic residents
- 2.1%Males
- 2.8%Females
- Unemployment rate for Black residents
- 3.2%Males
- 7.4%Females
- Unemployment rate for American Indian and Alaska Native residents
- 26.9%Males
- 20.0%Females
- Unemployment rate for Asian residents
- 6.2%Males
- 2.8%Females
- Unemployment rate for other race residents
- 3.4%Males
- Unemployment rate for two or more race residents
- 1.2%Males
- 3.3%Females
- Unemployment rate for Hispanic or Latino residents
- 5.8%Males
- 2.1%Females
Time leaving home to go to work

<5am:
| Laguna: | 2.5% (421) |
| California: | 4.2% (606,086) |
5:30am:
| Laguna: | 2.3% (382) |
| California: | 3.6% (523,209) |
6am:
| Laguna: | 4.4% (743) |
| California: | 4.8% (692,256) |
6:30am:
| Laguna: | 8.6% (1,465) |
| California: | 8.4% (1,216,867) |
7am:
| Laguna: | 13.4% (2,273) |
| California: | 9.4% (1,362,830) |
7:30am:
| Laguna: | 19.1% (3,237) |
| California: | 13.8% (2,006,950) |
8am:
| Laguna: | 14.4% (2,445) |
| California: | 13.7% (1,986,831) |
8:30am:
| Laguna: | 9.5% (1,607) |
| California: | 10.9% (1,577,815) |
9am:
| Laguna: | 4.3% (734) |
| California: | 5.4% (778,152) |
10am:
| Laguna: | 5.3% (892) |
| California: | 6.7% (972,355) |
11am:
| Laguna: | 1.4% (245) |
| California: | 2.9% (414,479) |
12pm:
| Laguna: | 1.1% (184) |
| California: | 1.3% (189,005) |
4pm:
| Laguna: | 5.3% (893) |
| California: | 6.0% (865,284) |
>4pm:
| Laguna: | 5.1% (862) |
| California: | 5.3% (776,167) |
Travel time to work
Daytime population change due to commuting: -12,516 (-36.5%)
Workers who live and work in this place: 1,570 (9.3%)
Workers who live and work in this place: 1,570 (9.3%)


Less than 5 minutes:
| Laguna: | 0.9% (148) |
| California: | 2.2% (324,703) |
5 to 9 minutes:
| Laguna: | 6.7% (1,137) |
| California: | 8.8% (1,280,443) |
10 to 14 minutes:
| Laguna: | 8.7% (1,479) |
| California: | 13.3% (1,930,263) |
15 to 19 minutes:
| Laguna: | 7.0% (1,182) |
| California: | 14.9% (2,157,970) |
20 to 24 minutes:
| Laguna: | 14.7% (2,490) |
| California: | 13.8% (2,004,060) |
25 to 29 minutes:
| Laguna: | 10.6% (1,802) |
| California: | 5.4% (782,241) |
30 to 34 minutes:
| Laguna: | 20.9% (3,536) |
| California: | 13.9% (2,025,657) |
35 to 39 minutes:
| Laguna: | 5.1% (860) |
| California: | 2.5% (366,487) |
40 to 44 minutes:
| Laguna: | 5.3% (904) |
| California: | 3.6% (528,043) |
45 to 59 minutes:
| Laguna: | 10.4% (1,758) |
| California: | 7.9% (1,151,598) |
60 to 89 minutes:
| Laguna: | 3.5% (586) |
| California: | 6.4% (933,123) |
90 or more minutes:
| Laguna: | 3.0% (501) |
| California: | 3.3% (483,698) |
Means of transportation to work


Drove car alone:
| Laguna: | 78.8% (13,347) |
| California: | 71.8% (10,432,462) |
Carpooled:
| Laguna: | 15.0% (2,535) |
| California: | 14.5% (2,113,313) |
Bus or trolley bus:
| Laguna: | 1.6% (270) |
| California: | 3.8% (549,425) |
Streetcar or trolley car:
| Laguna: | 0.2% (33) |
| California: | 0.1% (21,158) |
Motorcycle:
| Laguna: | 0.1% (25) |
| California: | 0.2% (36,262) |
Bicycle:
| Laguna: | 0.2% (37) |
| California: | 0.8% (120,567) |
Walked:
| Laguna: | 0.5% (89) |
| California: | 2.9% (414,581) |
Other means:
| Laguna: | 0.3% (47) |
| California: | 0.8% (115,064) |
Private vehicle occupancy

Drove alone:
| Laguna: | 84.0% (13,347) |
| California: | 83.2% (10,432,462) |
In 2 person carpool:
| Laguna: | 12.7% (2,019) |
| California: | 12.5% (1,564,905) |
In 3 person carpool:
| Laguna: | 2.3% (358) |
| California: | 2.6% (330,732) |
In 4 person carpool:
| Laguna: | 0.7% (118) |
| California: | 1.0% (119,364) |
In 5-6 person carpool:
| Laguna: | 0.2% (33) |
| California: | 0.5% (57,036) |
In 7+ person carpool:
| Laguna: | 0.0% (7) |
| California: | 0.3% (41,276) |
Class of workers
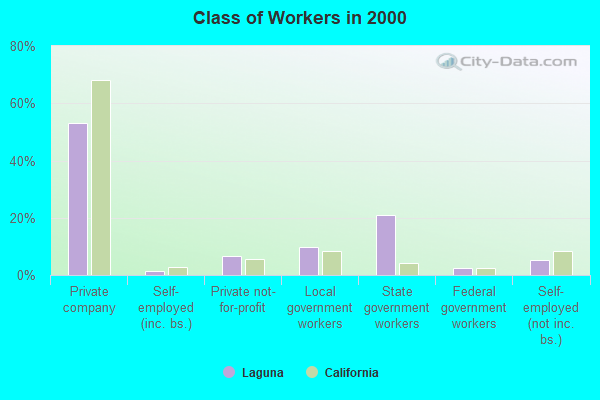
Employee of private company:
| Laguna: | 53.0% (9,193) |
| California: | 68.0% (10,009,465) |
Self-employed in own incorporated business:
| Laguna: | 1.5% (255) |
| California: | 2.7% (402,392) |
Private not-for-profit wage and salary workers:
| Laguna: | 6.7% (1,160) |
| California: | 5.7% (845,536) |
Local government workers:
| Laguna: | 9.9% (1,715) |
| California: | 8.3% (1,218,764) |
State government workers:
| Laguna: | 20.9% (3,624) |
| California: | 4.0% (594,953) |
Federal government workers:
| Laguna: | 2.5% (429) |
| California: | 2.3% (344,354) |
Self-employed workers in own not incorporated business:
| Laguna: | 5.2% (908) |
| California: | 8.5% (1,249,530) |
Unpaid family workers:
| Laguna: | 0.3% (45) |
| California: | 0.4% (53,934) |

Employee of private company - Males:
| Laguna: | 56.3% (4,928) |
| California: | 71.1% (5,716,697) |
Self-employed in own incorporated business - Males:
| Laguna: | 1.7% (152) |
| California: | 3.6% (290,657) |
Private not-for-profit wage and salary workers - Males:
| Laguna: | 4.1% (360) |
| California: | 3.8% (303,997) |
Local government workers - Males:
| Laguna: | 9.0% (784) |
| California: | 6.2% (495,927) |
State government workers - Males:
| Laguna: | 19.5% (1,703) |
| California: | 3.2% (255,434) |
Federal government workers - Males:
| Laguna: | 3.1% (275) |
| California: | 2.5% (198,555) |
Self-employed workers in own not incorporated business - Males:
| Laguna: | 6.0% (523) |
| California: | 9.5% (760,853) |
Unpaid family workers - Males:
| Laguna: | 0.2% (21) |
| California: | 0.3% (23,230) |

Employee of private company - Females:
| Laguna: | 49.7% (4,265) |
| California: | 64.3% (4,292,768) |
Self-employed in own incorporated business - Females:
| Laguna: | 1.2% (103) |
| California: | 1.7% (111,735) |
Private not-for-profit wage and salary workers - Females:
| Laguna: | 9.3% (800) |
| California: | 8.1% (541,539) |
Local government workers - Females:
| Laguna: | 10.8% (931) |
| California: | 10.8% (722,837) |
State government workers - Females:
| Laguna: | 22.4% (1,921) |
| California: | 5.1% (339,519) |
Federal government workers - Females:
| Laguna: | 1.8% (154) |
| California: | 2.2% (145,799) |
Self-employed workers in own not incorporated business - Females:
| Laguna: | 4.5% (385) |
| California: | 7.3% (488,677) |
Unpaid family workers - Females:
| Laguna: | 0.3% (24) |
| California: | 0.5% (30,704) |