Work and Jobs in Huntington Beach, California (CA) Detailed Stats
Occupations, Industries, Unemployment, Workers, Commute
Settings
X


Recent posts about work in Huntington Beach, California on our local forum with over 2,400,000 registered users:
 | New Job in Huntington Beach... unsure of commute anymore (19 replies) |
| OC Real Estate: Huntington Beach Condos on Leased Land (2 replies) |
| Jobs in schools (1 reply) |
| Advice on the Huntington Beach area (4 replies) |
| Need help deciding between San Clemete, Dana Point or Huntington Beach (34 replies) |
| Relocating to Huntington beach from Midwest (32 replies) |
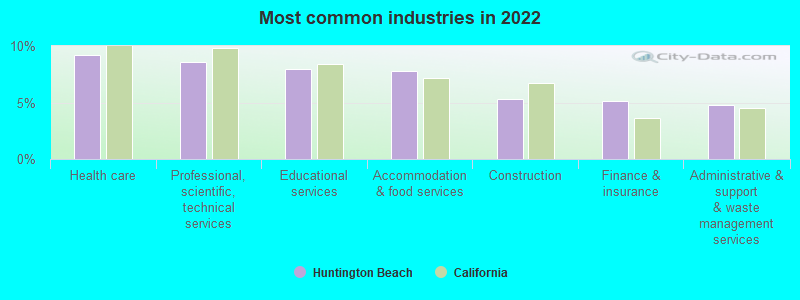
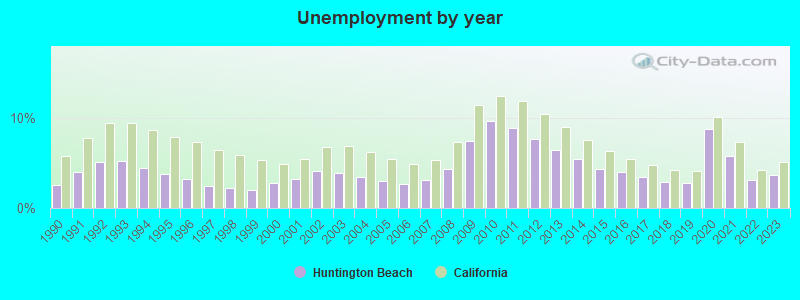
The unemployment rate in 2023 in Huntington Beach, CA was 3.7%, which was 37.8% less than the unemployment rate of 5.1% across the entire state of California. Compared to the unemployment rate of 6.4% in 2013, this represents a decrease of 73.0%. According to 2022 data, the most common industries in Huntington Beach are: Health care (9.2% of civilian employees), Professional, scientific, technical services (8.5% of civilian employees), Educational services (8.0% of civilian employees). 84.3% of workers work in Orange County and 20.4% of all workers work at home. 67.3% of workers are employees of private companies, which is about the same as the rate of 66.5% across the entire state of California.
Whole page based on the data from 2000 / 2022 when the population of Huntington Beach, California was 189,594 / 194,306
Whole page based on the data from 2000 / 2022 when the population of Huntington Beach, California was 189,594 / 194,306
Most common industries


Most common industries | Most common industries | |||||
|---|---|---|---|---|---|---|
Industry | All | Males | Females | All | Males | Females |
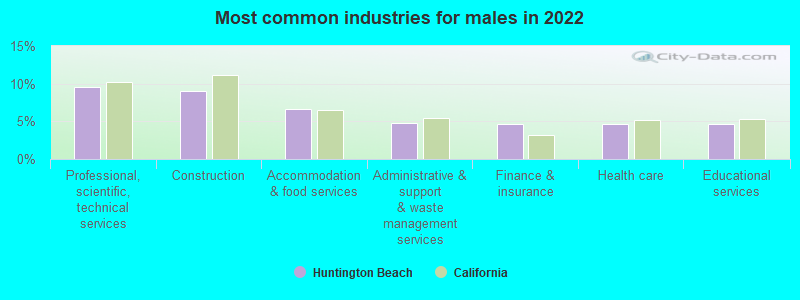
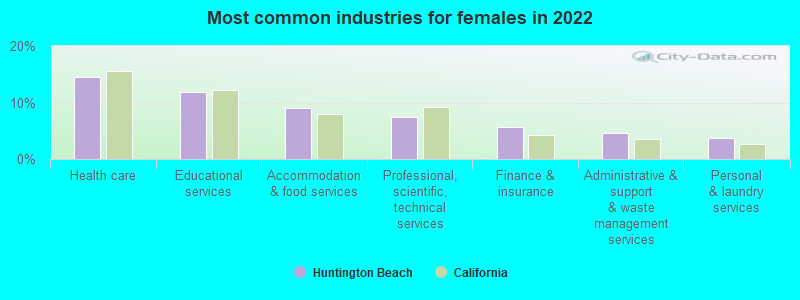
| Health care | 9.2% (10,368) | 4.6% (2,792) | 14.5% (7,576) | 7.5% (7,670) | 4.1% (2,354) | 11.5% (5,316) |
| Professional, scientific, and technical services | 8.5% (9,608) | 9.5% (5,730) | 7.4% (3,878) | 9.0% (9,302) | 9.3% (5,274) | 8.7% (4,028) |
| Educational services | 8.0% (8,966) | 4.6% (2,791) | 11.8% (6,175) | 8.4% (8,671) | 4.6% (2,600) | 13.2% (6,071) |
| Accommodation and food services | 7.8% (8,728) | 6.7% (4,011) | 9.0% (4,717) | 5.0% (5,092) | 4.6% (2,593) | 5.4% (2,499) |
| Construction | 5.3% (5,979) | 9.0% (5,420) | 1.1% (559) | 5.9% (6,067) | 9.5% (5,394) | 1.5% (673) |
| Finance and insurance | 5.1% (5,769) | 4.6% (2,793) | 5.7% (2,976) | 6.2% (6,382) | 4.7% (2,654) | 8.1% (3,728) |
| Administrative and support and waste management services | 4.8% (5,348) | 4.8% (2,905) | 4.7% (2,443) | 3.6% (3,737) | 3.7% (2,123) | 3.5% (1,614) |
| Public administration | 3.7% (4,212) | 4.2% (2,541) | 3.2% (1,671) | 3.7% (3,781) | 4.4% (2,511) | 2.8% (1,270) |
| Real estate and rental and leasing | 3.2% (3,599) | 2.9% (1,749) | 3.5% (1,850) | 3.0% (3,067) | 2.6% (1,503) | 3.4% (1,564) |
| Transportation equipment | 2.9% (3,307) | 4.3% (2,588) | 1.4% (719) | 4.8% (4,905) | 6.1% (3,481) | 3.1% (1,424) |
| Arts, entertainment, and recreation | 2.4% (2,698) | 2.3% (1,356) | 2.6% (1,342) | 2.0% (2,030) | 2.2% (1,231) | 1.7% (799) |
| Personal and laundry services | 2.2% (2,490) | 1.0% (589) | 3.6% (1,901) | 1.8% (1,850) | 1.1% (625) | 2.7% (1,225) |
| Other transportation, and support activities, and couriers | 2.0% (2,208) | 2.5% (1,494) | 1.4% (714) | 1.3% (1,350) | 1.8% (1,045) | 0.7% (305) |
| Clothing and accessories, including shoe, stores | 1.8% (2,035) | 1.1% (680) | 2.6% (1,355) | 0.9% (893) | 0.5% (295) | 1.3% (598) |
| Food and beverage stores | 1.8% (2,032) | 1.8% (1,073) | 1.8% (959) | 1.8% (1,871) | 1.7% (964) | 2.0% (907) |
| Broadcasting and telecommunications | 1.7% (1,944) | 2.4% (1,412) | 1.0% (532) | 1.5% (1,591) | 1.7% (974) | 1.3% (617) |
| Miscellaneous manufacturing | 1.6% (1,848) | 2.1% (1,275) | 1.1% (573) | 2.0% (2,056) | 2.1% (1,207) | 1.8% (849) |
| Computer and electronic products | 1.5% (1,678) | 1.8% (1,103) | 1.1% (575) | 2.3% (2,340) | 2.8% (1,608) | 1.6% (732) |
| Social assistance | 1.4% (1,619) | 0.4% (243) | 2.6% (1,376) | 1.2% (1,273) | 0.2% (124) | 2.5% (1,149) |
| Department and other general merchandise stores | 1.4% (1,525) | 0.8% (495) | 2.0% (1,030) | 1.2% (1,192) | 0.7% (385) | 1.8% (807) |
| Metal and metal products | 1.3% (1,489) | 1.7% (994) | 0.9% (495) | 1.3% (1,331) | 1.9% (1,075) | 0.6% (256) |
| Publishing, and motion picture and sound recording industries | 1.1% (1,281) | 1.5% (925) | 0.7% (356) | 1.1% (1,112) | 1.0% (571) | 1.2% (541) |
| Repair and maintenance | 1.1% (1,240) | 1.7% (1,021) | 0.4% (219) | 1.5% (1,556) | 2.3% (1,303) | 0.5% (253) |
| Utilities | 1.0% (1,167) | 1.5% (917) | 0.5% (250) | 0.8% (832) | 1.0% (591) | 0.5% (241) |
| Building material and garden equipment and supplies dealers | 1.0% (1,106) | 1.3% (773) | 0.6% (333) | 0.8% (788) | 0.9% (493) | 0.6% (295) |
| Religious, grantmaking, civic, professional, and similar organizations | 1.0% (1,093) | 1.0% (584) | 1.0% (509) | 1.1% (1,096) | 0.8% (443) | 1.4% (653) |
| Radio, TV, and computer stores | 1.0% (1,081) | 1.2% (732) | 0.7% (349) | 1.1% (1,171) | 1.3% (760) | 0.9% (411) |
| Motor vehicle and parts dealers | 0.9% (958) | 1.5% (885) | 0.1% (73) | 1.3% (1,360) | 1.8% (1,031) | 0.7% (329) |
| Used merchandise, gift, novelty, and souvenir, and other miscellaneous stores | 0.8% (921) | 0.7% (413) | 1.0% (508) | 0.6% (649) | 0.5% (289) | 0.8% (360) |
| Machinery | 0.7% (825) | 1.2% (740) | 0.2% (85) | 0.6% (631) | 0.8% (459) | 0.4% (172) |
| Sporting goods, camera, and hobby and toy stores | 0.7% (809) | 1.1% (680) | 0.2% (129) | 0.4% (443) | 0.5% (272) | 0.4% (171) |
| Private households | 0.7% (806) | 0.2% (109) | 1.3% (697) | 0.3% (360) | 0.1% (44) | 0.7% (316) |
| Chemicals | 0.6% (717) | 0.7% (402) | 0.6% (315) | 0.6% (665) | 0.6% (319) | 0.8% (346) |
| Air transportation | 0.6% (673) | 0.4% (257) | 0.8% (416) | 0.7% (752) | 0.7% (421) | 0.7% (331) |
| Electrical and electronic goods merchant wholesalers | 0.5% (609) | 0.6% (340) | 0.5% (269) | 0.6% (603) | 0.8% (440) | 0.4% (163) |
| Pharmacies and drug stores | 0.5% (599) | 0.3% (170) | 0.8% (429) | 0.5% (539) | 0.4% (251) | 0.6% (288) |
| Professional and commercial equipment and supplies merchant wholesalers | 0.5% (571) | 0.7% (400) | 0.3% (171) | 0.8% (811) | 0.9% (532) | 0.6% (279) |
| Food | 0.5% (550) | 0.5% (274) | 0.5% (276) | 0.4% (362) | 0.4% (200) | 0.4% (162) |
| Apparel | 0.4% (493) | 0.3% (158) | 0.6% (335) | 0.5% (549) | 0.4% (218) | 0.7% (331) |
| Groceries and related products merchant wholesalers | 0.4% (482) | 0.6% (373) | 0.2% (109) | 0.6% (589) | 0.8% (432) | 0.3% (157) |
| Printing and related support activities | 0.4% (477) | 0.6% (350) | 0.2% (127) | 0.6% (658) | 0.8% (449) | 0.5% (209) |
| Drugs, sundries, and chemical and allied products merchant wholesalers | 0.4% (464) | 0.3% (195) | 0.5% (269) | 0.2% (230) | 0.2% (128) | 0.2% (102) |
| Other direct selling establishments | 0.4% (451) | 0.4% (259) | 0.4% (192) | 0.6% (628) | 0.4% (249) | 0.8% (379) |
| Agriculture, forestry, fishing and hunting | 0.4% (445) | 0.3% (185) | 0.5% (260) | 0.1% (86) | 0.1% (64) | 0.0% (22) |
| Petroleum and coal products | 0.3% (378) | 0.6% (350) | 0.1% (28) | 0.3% (352) | 0.6% (329) | 0.0% (23) |
| Furniture and home furnishings, and household appliance stores | 0.3% (368) | 0.4% (232) | 0.3% (136) | 0.5% (489) | 0.4% (242) | 0.5% (247) |
| Machinery, equipment, and supplies merchant wholesalers | 0.3% (365) | 0.4% (254) | 0.2% (111) | 0.5% (499) | 0.7% (376) | 0.3% (123) |
| Truck transportation | 0.3% (319) | 0.5% (284) | 0.1% (35) | 0.7% (753) | 1.0% (571) | 0.4% (182) |
| Electrical equipment, appliances, and components | 0.3% (308) | 0.4% (232) | 0.1% (76) | 0.4% (362) | 0.4% (245) | 0.3% (117) |
| Miscellaneous nondurable goods merchant wholesalers | 0.3% (297) | 0.4% (253) | 0.1% (44) | 0.7% (721) | 0.9% (507) | 0.5% (214) |
| Health and personal care, except drug, stores | 0.2% (276) | 0.2% (97) | 0.3% (179) | 0.2% (245) | 0.2% (93) | 0.3% (152) |
| Water transportation | 0.2% (258) | 0.4% (215) | 0.1% (43) | 0.1% (79) | 0.1% (33) | 0.1% (46) |
| Miscellaneous durable goods merchant wholesalers | 0.2% (247) | 0.4% (213) | 0.1% (34) | 0.4% (393) | 0.5% (271) | 0.3% (122) |
| U. S. Postal service | 0.2% (247) | 0.3% (167) | 0.2% (80) | 0.4% (366) | 0.4% (254) | 0.2% (112) |
| Hardware, plumbing and heating equipment, and supplies merchant wholesalers | 0.2% (246) | 0.4% (228) | 0.0% (18) | 0.2% (180) | 0.2% (94) | 0.2% (86) |
| Management of companies and enterprises | 0.2% (241) | 0.0% (13) | 0.4% (228) | 0.0% (48) | 0.0% (10) | 0.1% (38) |
| Warehousing and storage | 0.2% (218) | 0.3% (204) | 0.0% (14) | 0.1% (124) | 0.1% (79) | 0.1% (45) |
| Nonmetallic mineral products | 0.2% (196) | 0.2% (128) | 0.1% (68) | 0.3% (262) | 0.4% (208) | 0.1% (54) |
| Electronic shopping and mail-order houses | 0.2% (195) | 0.2% (127) | 0.1% (68) | 0.3% (299) | 0.3% (182) | 0.3% (117) |
| Gasoline stations | 0.2% (189) | 0.2% (117) | 0.1% (72) | 0.2% (225) | 0.3% (180) | 0.1% (45) |
| Paper | 0.2% (187) | 0.2% (150) | 0.1% (37) | 0.2% (168) | 0.2% (126) | 0.1% (42) |
| Data processing, libraries, and other information services | 0.2% (178) | 0.1% (59) | 0.2% (119) | 0.5% (520) | 0.6% (313) | 0.4% (207) |
| Apparel, fabrics, and notions merchant wholesalers | 0.2% (170) | 0.2% (99) | 0.1% (71) | 0.1% (152) | 0.1% (75) | 0.2% (77) |
| Office supplies and stationery stores | 0.1% (164) | 0.2% (97) | 0.1% (67) | 0.2% (197) | 0.3% (147) | 0.1% (50) |
| Jewelry, luggage, and leather goods stores | 0.1% (154) | 0.1% (34) | 0.2% (120) | 0.1% (143) | 0.2% (98) | 0.1% (45) |
| Mining, quarrying, and oil and gas extraction | 0.1% (145) | 0.2% (133) | 0.0% (12) | 0.2% (165) | 0.2% (133) | 0.1% (32) |
| Plastics and rubber products | 0.1% (142) | 0.1% (75) | 0.1% (67) | 0.4% (451) | 0.6% (366) | 0.2% (85) |
| Motor vehicles, parts and supplies merchant wholesalers | 0.1% (128) | 0.2% (103) | 0.0% (25) | 0.6% (567) | 0.8% (445) | 0.3% (122) |
| Furniture and related product manufacturing | 0.1% (123) | 0.2% (108) | 0.0% (15) | 0.3% (320) | 0.4% (255) | 0.1% (65) |
| Furniture and home furnishing merchant wholesalers | 0.1% (117) | 0.0% (17) | 0.2% (100) | 0.1% (129) | 0.1% (49) | 0.2% (80) |
| Lumber and other construction materials merchant wholesalers | 0.1% (101) | 0.2% (101) | 0.0% (0) | 0.1% (89) | 0.1% (84) | 0.0% (5) |
| Paper and paper products merchant wholesalers | 0.1% (95) | 0.1% (78) | 0.0% (17) | 0.2% (186) | 0.2% (101) | 0.2% (85) |
| Alcoholic beverages merchant wholesalers | 0.1% (94) | 0.0% (19) | 0.1% (75) | 0.1% (100) | 0.2% (90) | 0.0% (10) |
| Textile mills and textile products | 0.1% (93) | 0.1% (37) | 0.1% (56) | 0.2% (244) | 0.3% (156) | 0.2% (88) |
| Recyclable material merchant wholesalers | 0.1% (78) | 0.1% (63) | 0.0% (15) | 0.1% (77) | 0.1% (57) | 0.0% (20) |
| Wood products | 0.1% (75) | 0.1% (54) | 0.0% (21) | 0.1% (129) | 0.2% (103) | 0.1% (26) |
| Music stores | 0.1% (70) | 0.1% (70) | 0.0% (0) | 0.2% (171) | 0.2% (92) | 0.2% (79) |
| Beverage and tobacco products | 0.1% (69) | 0.1% (54) | 0.0% (15) | 0.1% (118) | 0.1% (70) | 0.1% (48) |
| Petroleum and petroleum products merchant wholesalers | 0.0% (54) | 0.1% (54) | 0.0% (0) | 0.1% (150) | 0.2% (117) | 0.1% (33) |
| Book stores and news dealers | 0.0% (34) | 0.1% (34) | 0.0% (0) | 0.1% (120) | 0.1% (45) | 0.2% (75) |
| Rail transportation | 0.0% (9) | 0.0% (9) | 0.0% (0) | 0.1% (62) | 0.1% (62) | 0.0% (0) |
Unemployment in Huntington Beach
- Unemployment by race in 2022
- Unemployment rate for White non-Hispanic residents
- 5.8%Males
- 2.5%Females
- Unemployment rate for Black residents
- 15.1%Males
- 19.4%Females
- Unemployment rate for American Indian and Alaska Native residents
- 3.0%Males
- 3.7%Females
- Unemployment rate for Asian residents
- 6.6%Males
- 2.9%Females
- Unemployment rate for other race residents
- 0.8%Males
- 3.1%Females
- Unemployment rate for two or more race residents
- 4.9%Males
- 4.5%Females
- Unemployment rate for Hispanic or Latino residents
- 2.8%Males
- 4.7%Females
- Unemployment by race in 2000
- Unemployment rate for White non-Hispanic residents
- 3.7%Males
- 3.5%Females
- Unemployment rate for Black residents
- 7.5%Males
- 7.4%Females
- Unemployment rate for American Indian and Alaska Native residents
- 3.9%Males
- 4.3%Females
- Unemployment rate for Asian residents
- 3.8%Males
- 2.6%Females
- Unemployment rate for other race residents
- 6.1%Males
- 6.4%Females
- Unemployment rate for two or more race residents
- 8.5%Males
- 3.7%Females
- Unemployment rate for Hispanic or Latino residents
- 5.2%Males
- 5.6%Females
Unemployment in 2023:
| Huntington Beach: | 3.7% |
| California: | 5.1% |
Unemployment in 2022:
| Huntington Beach: | 3.1% |
| California: | 4.2% |
Unemployment in 2021:
| Huntington Beach: | 5.8% |
| California: | 7.3% |
Unemployment in 2020:
| Huntington Beach: | 8.8% |
| California: | 10.1% |
Unemployment in 2019:
| Huntington Beach: | 2.8% |
| California: | 4.1% |
Unemployment in 2018:
| Huntington Beach: | 2.9% |
| California: | 4.2% |
Unemployment in 2017:
| Huntington Beach: | 3.5% |
| California: | 4.8% |
Unemployment in 2016:
| Huntington Beach: | 4.0% |
| California: | 5.5% |
Unemployment in 2015:
| Huntington Beach: | 4.3% |
| California: | 6.3% |
Unemployment in 2014:
| Huntington Beach: | 5.4% |
| California: | 7.6% |
Unemployment in 2013:
| Huntington Beach: | 6.4% |
| California: | 9.0% |
Unemployment in 2012:
| Huntington Beach: | 7.7% |
| California: | 10.5% |
Unemployment in 2011:
| Huntington Beach: | 8.9% |
| California: | 11.9% |
Unemployment in 2010:
| Huntington Beach: | 9.7% |
| California: | 12.5% |
Unemployment in 2009:
| Huntington Beach: | 7.4% |
| California: | 11.5% |
Unemployment in 2008:
| Huntington Beach: | 4.3% |
| California: | 7.3% |
Unemployment in 2007:
| Huntington Beach: | 3.1% |
| California: | 5.3% |
Unemployment in 2006:
| Huntington Beach: | 2.7% |
| California: | 4.9% |
Unemployment in 2005:
| Huntington Beach: | 3.0% |
| California: | 5.4% |
Unemployment in 2004:
| Huntington Beach: | 3.4% |
| California: | 6.2% |
Unemployment in 2003:
| Huntington Beach: | 3.9% |
| California: | 6.9% |
Unemployment in 2002:
| Huntington Beach: | 4.1% |
| California: | 6.8% |
Unemployment in 2001:
| Huntington Beach: | 3.2% |
| California: | 5.5% |
Unemployment in 2000:
| Huntington Beach: | 2.8% |
| California: | 4.9% |
Unemployment in 1999:
| Huntington Beach: | 2.0% |
| California: | 5.3% |
Unemployment in 1998:
| Huntington Beach: | 2.2% |
| California: | 5.9% |
Unemployment in 1997:
| Huntington Beach: | 2.5% |
| California: | 6.4% |
Unemployment in 1996:
| Huntington Beach: | 3.2% |
| California: | 7.3% |
Unemployment in 1995:
| Huntington Beach: | 3.8% |
| California: | 7.9% |
Unemployment in 1994:
| Huntington Beach: | 4.4% |
| California: | 8.7% |
Unemployment in 1993:
| Huntington Beach: | 5.2% |
| California: | 9.5% |
Unemployment in 1992:
| Huntington Beach: | 5.1% |
| California: | 9.4% |
Unemployment in 1991:
| Huntington Beach: | 4.0% |
| California: | 7.8% |
Unemployment in 1990:
| Huntington Beach: | 2.6% |
| California: | 5.8% |
Time leaving home to go to work
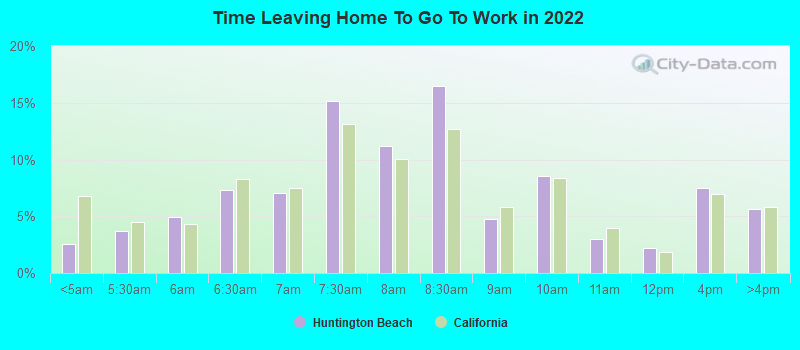
12:00 a.m. to 4:59 a.m.:
| Huntington Beach: | 2.6% (2,127) |
| California: | 6.8% (1,050,902) |
5:00 a.m. to 5:29 a.m.:
| Huntington Beach: | 3.7% (3,005) |
| California: | 4.5% (692,772) |
5:30 a.m. to 5:59 a.m.:
| Huntington Beach: | 4.9% (4,034) |
| California: | 4.3% (665,475) |
6:00 a.m. to 6:29 a.m.:
| Huntington Beach: | 7.3% (5,959) |
| California: | 8.3% (1,273,588) |
6:30 a.m. to 6:59 a.m.:
| Huntington Beach: | 7.1% (5,786) |
| California: | 7.5% (1,156,338) |
7:00 a.m. to 7:29 a.m.:
| Huntington Beach: | 15.1% (12,401) |
| California: | 13.2% (2,027,702) |
7:30 a.m. to 7:59 a.m.:
| Huntington Beach: | 11.2% (9,172) |
| California: | 10.1% (1,550,402) |
8:00 a.m. to 8:29 a.m.:
| Huntington Beach: | 16.4% (13,462) |
| California: | 12.7% (1,953,986) |
8:30 a.m. to 8:59 a.m.:
| Huntington Beach: | 4.8% (3,907) |
| California: | 5.8% (890,950) |
9:00 a.m. to 9:59 a.m.:
| Huntington Beach: | 8.5% (6,985) |
| California: | 8.4% (1,288,499) |
10:00 a.m. to 10:59 a.m.:
| Huntington Beach: | 3.0% (2,483) |
| California: | 4.0% (613,193) |
11:00 a.m. to 11:59 a.m.:
| Huntington Beach: | 2.2% (1,802) |
| California: | 1.8% (280,975) |
12:00 p.m. to 3:59 p.m.:
| Huntington Beach: | 7.5% (6,128) |
| California: | 7.0% (1,075,505) |
4:00 p.m. to 11:59 p.m.:
| Huntington Beach: | 5.7% (4,630) |
| California: | 5.8% (891,240) |

<5am:
| Huntington Beach: | 2.4% (2,479) |
| California: | 4.2% (606,086) |
5:30am:
| Huntington Beach: | 3.2% (3,263) |
| California: | 3.6% (523,209) |
6am:
| Huntington Beach: | 4.6% (4,710) |
| California: | 4.8% (692,256) |
6:30am:
| Huntington Beach: | 8.6% (8,745) |
| California: | 8.4% (1,216,867) |
7am:
| Huntington Beach: | 10.1% (10,235) |
| California: | 9.4% (1,362,830) |
7:30am:
| Huntington Beach: | 15.7% (15,882) |
| California: | 13.8% (2,006,950) |
8am:
| Huntington Beach: | 13.7% (13,898) |
| California: | 13.7% (1,986,831) |
8:30am:
| Huntington Beach: | 11.3% (11,476) |
| California: | 10.9% (1,577,815) |
9am:
| Huntington Beach: | 5.7% (5,812) |
| California: | 5.4% (778,152) |
10am:
| Huntington Beach: | 7.0% (7,083) |
| California: | 6.7% (972,355) |
11am:
| Huntington Beach: | 3.0% (3,041) |
| California: | 2.9% (414,479) |
12pm:
| Huntington Beach: | 1.1% (1,082) |
| California: | 1.3% (189,005) |
4pm:
| Huntington Beach: | 4.7% (4,780) |
| California: | 6.0% (865,284) |
>4pm:
| Huntington Beach: | 4.4% (4,490) |
| California: | 5.3% (776,167) |

12:00 a.m. to 4:59 a.m. - Males:
| Huntington Beach: | 3.8% (1,647) |
| California: | 8.7% (747,612) |
5:00 a.m. to 5:29 a.m. - Males:
| Huntington Beach: | 5.9% (2,571) |
| California: | 6.0% (509,420) |
5:30 a.m. to 5:59 a.m. - Males:
| Huntington Beach: | 6.4% (2,808) |
| California: | 5.2% (448,269) |
6:00 a.m. to 6:29 a.m. - Males:
| Huntington Beach: | 7.1% (3,101) |
| California: | 9.8% (842,941) |
6:30 a.m. to 6:59 a.m. - Males:
| Huntington Beach: | 8.8% (3,842) |
| California: | 7.7% (657,557) |
7:00 a.m. to 7:29 a.m. - Males:
| Huntington Beach: | 13.2% (5,756) |
| California: | 12.4% (1,058,532) |
7:30 a.m. to 7:59 a.m. - Males:
| Huntington Beach: | 9.0% (3,910) |
| California: | 8.2% (702,727) |
8:00 a.m. to 8:29 a.m. - Males:
| Huntington Beach: | 15.2% (6,626) |
| California: | 11.5% (984,538) |
8:30 a.m. to 8:59 a.m. - Males:
| Huntington Beach: | 4.5% (1,962) |
| California: | 4.8% (414,815) |
9:00 a.m. to 9:59 a.m. - Males:
| Huntington Beach: | 8.2% (3,589) |
| California: | 7.7% (655,038) |
10:00 a.m. to 10:59 a.m. - Males:
| Huntington Beach: | 2.4% (1,056) |
| California: | 3.5% (301,425) |
11:00 a.m. to 11:59 a.m. - Males:
| Huntington Beach: | 1.8% (797) |
| California: | 1.7% (141,620) |
12:00 p.m. to 3:59 p.m. - Males:
| Huntington Beach: | 8.4% (3,666) |
| California: | 7.0% (594,847) |
4:00 p.m. to 11:59 p.m. - Males:
| Huntington Beach: | 5.3% (2,306) |
| California: | 5.8% (499,471) |

12:00 a.m. to 4:59 a.m. - Females:
| Huntington Beach: | 1.3% (480) |
| California: | 4.4% (303,290) |
5:00 a.m. to 5:29 a.m. - Females:
| Huntington Beach: | 1.1% (434) |
| California: | 2.7% (183,352) |
5:30 a.m. to 5:59 a.m. - Females:
| Huntington Beach: | 3.2% (1,226) |
| California: | 3.2% (217,206) |
6:00 a.m. to 6:29 a.m. - Females:
| Huntington Beach: | 7.5% (2,858) |
| California: | 6.3% (430,647) |
6:30 a.m. to 6:59 a.m. - Females:
| Huntington Beach: | 5.1% (1,944) |
| California: | 7.3% (498,781) |
7:00 a.m. to 7:29 a.m. - Females:
| Huntington Beach: | 17.4% (6,645) |
| California: | 14.1% (969,170) |
7:30 a.m. to 7:59 a.m. - Females:
| Huntington Beach: | 13.8% (5,262) |
| California: | 12.4% (847,675) |
8:00 a.m. to 8:29 a.m. - Females:
| Huntington Beach: | 17.9% (6,836) |
| California: | 14.1% (969,448) |
8:30 a.m. to 8:59 a.m. - Females:
| Huntington Beach: | 5.1% (1,945) |
| California: | 6.9% (476,135) |
9:00 a.m. to 9:59 a.m. - Females:
| Huntington Beach: | 8.9% (3,396) |
| California: | 9.2% (633,461) |
10:00 a.m. to 10:59 a.m. - Females:
| Huntington Beach: | 3.7% (1,427) |
| California: | 4.5% (311,768) |
11:00 a.m. to 11:59 a.m. - Females:
| Huntington Beach: | 2.6% (1,005) |
| California: | 2.0% (139,355) |
12:00 p.m. to 3:59 p.m. - Females:
| Huntington Beach: | 6.4% (2,462) |
| California: | 7.0% (480,658) |
4:00 p.m. to 11:59 p.m. - Females:
| Huntington Beach: | 6.1% (2,324) |
| California: | 5.7% (391,769) |
Travel time to work
Percentage of workers working in this county: 84.3%
Number of people working at home: 20,927 (20.4% of all workers)
Daytime population change due to commuting: -32,498 (-17.1%)
Workers who live and work in this city: 24,457 (24.1%)
Number of people working at home: 20,927 (20.4% of all workers)
Daytime population change due to commuting: -32,498 (-17.1%)
Workers who live and work in this city: 24,457 (24.1%)

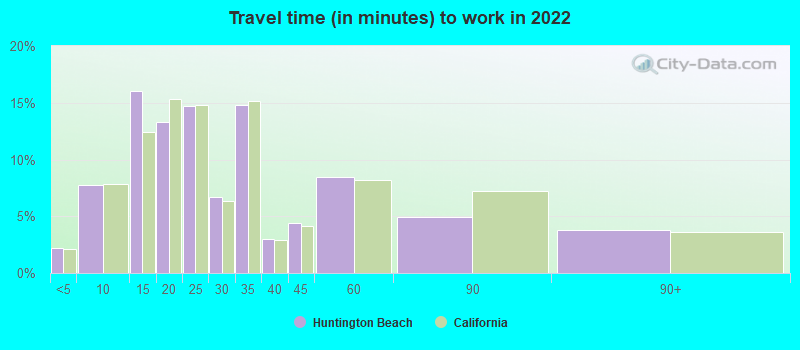

Less than 5 minutes:
| Huntington Beach: | 2.2% (1,513) |
| California: | 2.1% (323,064) |
5 to 9 minutes:
| Huntington Beach: | 7.7% (5,370) |
| California: | 7.8% (1,208,682) |
10 to 14 minutes:
| Huntington Beach: | 16.0% (11,131) |
| California: | 12.4% (1,917,610) |
15 to 19 minutes:
| Huntington Beach: | 13.3% (9,259) |
| California: | 15.3% (2,367,483) |
20 to 24 minutes:
| Huntington Beach: | 14.7% (10,244) |
| California: | 14.8% (2,279,693) |
25 to 29 minutes:
| Huntington Beach: | 6.7% (4,672) |
| California: | 6.4% (981,997) |
30 to 34 minutes:
| Huntington Beach: | 14.8% (10,302) |
| California: | 15.2% (2,339,223) |
35 to 39 minutes:
| Huntington Beach: | 3.0% (2,101) |
| California: | 2.9% (453,226) |
40 to 44 minutes:
| Huntington Beach: | 4.4% (3,061) |
| California: | 4.1% (637,781) |
45 to 59 minutes:
| Huntington Beach: | 8.4% (5,870) |
| California: | 8.2% (1,259,482) |
60 to 89 minutes:
| Huntington Beach: | 4.9% (3,444) |
| California: | 7.2% (1,111,698) |
90 or more minutes:
| Huntington Beach: | 3.8% (2,629) |
| California: | 3.6% (552,805) |


Less than 5 minutes:
| Huntington Beach: | 1.7% (1,732) |
| California: | 2.2% (324,703) |
5 to 9 minutes:
| Huntington Beach: | 7.5% (7,596) |
| California: | 8.8% (1,280,443) |
10 to 14 minutes:
| Huntington Beach: | 10.2% (10,318) |
| California: | 13.3% (1,930,263) |
15 to 19 minutes:
| Huntington Beach: | 11.3% (11,435) |
| California: | 14.9% (2,157,970) |
20 to 24 minutes:
| Huntington Beach: | 13.6% (13,823) |
| California: | 13.8% (2,004,060) |
25 to 29 minutes:
| Huntington Beach: | 6.2% (6,252) |
| California: | 5.4% (782,241) |
30 to 34 minutes:
| Huntington Beach: | 17.5% (17,749) |
| California: | 13.9% (2,025,657) |
35 to 39 minutes:
| Huntington Beach: | 3.6% (3,618) |
| California: | 2.5% (366,487) |
40 to 44 minutes:
| Huntington Beach: | 5.6% (5,710) |
| California: | 3.6% (528,043) |
45 to 59 minutes:
| Huntington Beach: | 10.2% (10,364) |
| California: | 7.9% (1,151,598) |
60 to 89 minutes:
| Huntington Beach: | 6.1% (6,218) |
| California: | 6.4% (933,123) |
90 or more minutes:
| Huntington Beach: | 2.1% (2,161) |
| California: | 3.3% (483,698) |

Less than 5 minutes - Males:
| Huntington Beach: | 2.3% (928) |
| California: | 2.0% (173,603) |
5 to 9 minutes - Males:
| Huntington Beach: | 6.7% (2,761) |
| California: | 6.8% (580,822) |
10 to 14 minutes - Males:
| Huntington Beach: | 16.0% (6,558) |
| California: | 11.4% (974,497) |
15 to 19 minutes - Males:
| Huntington Beach: | 11.8% (4,831) |
| California: | 14.5% (1,239,386) |
20 to 24 minutes - Males:
| Huntington Beach: | 13.6% (5,585) |
| California: | 14.3% (1,223,429) |
25 to 29 minutes - Males:
| Huntington Beach: | 5.2% (2,154) |
| California: | 6.4% (545,844) |
30 to 34 minutes - Males:
| Huntington Beach: | 16.1% (6,613) |
| California: | 15.8% (1,352,210) |
35 to 39 minutes - Males:
| Huntington Beach: | 1.9% (760) |
| California: | 3.0% (253,732) |
40 to 44 minutes - Males:
| Huntington Beach: | 5.5% (2,239) |
| California: | 4.4% (376,144) |
45 to 59 minutes - Males:
| Huntington Beach: | 9.1% (3,725) |
| California: | 8.9% (762,659) |
60 to 89 minutes - Males:
| Huntington Beach: | 7.2% (2,937) |
| California: | 8.3% (711,394) |
90 or more minutes - Males:
| Huntington Beach: | 4.8% (1,984) |
| California: | 4.4% (378,954) |

Less than 5 minutes - Females:
| Huntington Beach: | 2.1% (585) |
| California: | 2.2% (149,461) |
5 to 9 minutes - Females:
| Huntington Beach: | 9.1% (2,609) |
| California: | 9.2% (627,860) |
10 to 14 minutes - Females:
| Huntington Beach: | 16.0% (4,573) |
| California: | 13.7% (943,113) |
15 to 19 minutes - Females:
| Huntington Beach: | 15.5% (4,428) |
| California: | 16.4% (1,128,097) |
20 to 24 minutes - Females:
| Huntington Beach: | 16.3% (4,659) |
| California: | 15.4% (1,056,264) |
25 to 29 minutes - Females:
| Huntington Beach: | 8.8% (2,518) |
| California: | 6.4% (436,153) |
30 to 34 minutes - Females:
| Huntington Beach: | 12.9% (3,689) |
| California: | 14.4% (987,013) |
35 to 39 minutes - Females:
| Huntington Beach: | 4.7% (1,341) |
| California: | 2.9% (199,494) |
40 to 44 minutes - Females:
| Huntington Beach: | 2.9% (822) |
| California: | 3.8% (261,637) |
45 to 59 minutes - Females:
| Huntington Beach: | 7.5% (2,145) |
| California: | 7.2% (496,823) |
60 to 89 minutes - Females:
| Huntington Beach: | 1.8% (507) |
| California: | 5.8% (400,304) |
90 or more minutes - Females:
| Huntington Beach: | 2.3% (645) |
| California: | 2.5% (173,851) |
Means of transportation to work
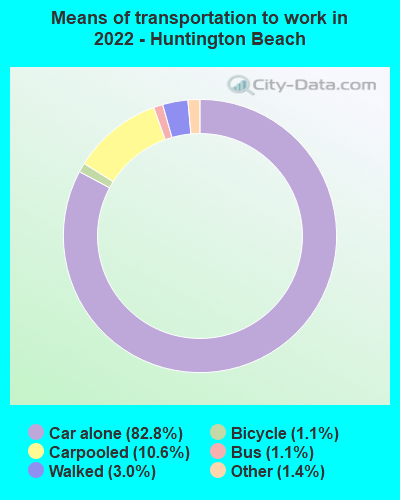

Drove car alone:
| Huntington Beach: | 82.8% (57,601) |
| California: | 79.1% (5,345,368) |
Carpooled:
| Huntington Beach: | 10.6% (7,345) |
| California: | 11.9% (878,699) |
Bus:
| Huntington Beach: | 1.1% (796) |
| California: | 2.2% (170,574) |
Bicycle:
| Huntington Beach: | 1.1% (756) |
| California: | 0.9% (39,197) |
Walked:
| Huntington Beach: | 3.0% (2,103) |
| California: | 2.9% (218,374) |
Other means:
| Huntington Beach: | 1.4% (995) |
| California: | 2.1% (137,489) |


Drove car alone:
| Huntington Beach: | 82.7% (83,745) |
| California: | 71.8% (10,432,462) |
Carpooled:
| Huntington Beach: | 9.0% (9,110) |
| California: | 14.5% (2,113,313) |
Bus or trolley bus:
| Huntington Beach: | 1.0% (1,023) |
| California: | 3.8% (549,425) |
Streetcar or trolley car:
| Huntington Beach: | 0.0% (26) |
| California: | 0.1% (21,158) |
Subway or elevated:
| Huntington Beach: | 0.0% (16) |
| California: | 0.7% (107,711) |
Railroad:
| Huntington Beach: | 0.0% (37) |
| California: | 0.3% (41,022) |
Ferryboat:
| Huntington Beach: | 0.0% (26) |
| California: | 0.0% (6,831) |
Taxicab:
| Huntington Beach: | 0.0% (12) |
| California: | 0.1% (9,890) |
Motorcycle:
| Huntington Beach: | 0.2% (243) |
| California: | 0.2% (36,262) |
Bicycle:
| Huntington Beach: | 0.8% (790) |
| California: | 0.8% (120,567) |
Walked:
| Huntington Beach: | 1.5% (1,503) |
| California: | 2.9% (414,581) |
Other means:
| Huntington Beach: | 0.4% (445) |
| California: | 0.8% (115,064) |


Drove car alone - Males:
| Huntington Beach: | 84.0% (34,483) |
| California: | 80.0% (5,345,368) |
Carpooled - Males:
| Huntington Beach: | 9.2% (3,795) |
| California: | 11.1% (878,699) |
Bus - Males:
| Huntington Beach: | 1.3% (540) |
| California: | 2.0% (170,574) |
Bicycle - Males:
| Huntington Beach: | 1.8% (756) |
| California: | 1.1% (39,197) |
Walked - Males:
| Huntington Beach: | 2.5% (1,041) |
| California: | 2.7% (218,374) |
Other means - Males:
| Huntington Beach: | 1.1% (460) |
| California: | 2.1% (137,489) |


Drove car alone - Females:
| Huntington Beach: | 81.1% (23,118) |
| California: | 77.9% (5,345,368) |
Carpooled - Females:
| Huntington Beach: | 12.4% (3,550) |
| California: | 12.8% (878,699) |
Bus - Females:
| Huntington Beach: | 0.9% (256) |
| California: | 2.5% (170,574) |
Walked - Females:
| Huntington Beach: | 3.7% (1,062) |
| California: | 3.2% (218,374) |
Other means - Females:
| Huntington Beach: | 1.9% (535) |
| California: | 2.0% (137,489) |
Private vehicle occupancy

Drove alone:
| Huntington Beach: | 90.9% (72,015) |
| California: | 86.9% (12,187,486) |
In 2 person carpool:
| Huntington Beach: | 6.4% (5,074) |
| California: | 9.2% (1,295,561) |
In 3 person carpool:
| Huntington Beach: | 1.4% (1,148) |
| California: | 2.2% (309,969) |
In 4 person carpool:
| Huntington Beach: | 0.4% (352) |
| California: | 0.9% (126,987) |
In 5-6 person carpool:
| Huntington Beach: | 0.5% (375) |
| California: | 0.5% (70,825) |
In 7+ person carpool:
| Huntington Beach: | 0.0% (30) |
| California: | 0.2% (28,258) |

Drove alone:
| Huntington Beach: | 90.2% (83,745) |
| California: | 83.2% (10,432,462) |
In 2 person carpool:
| Huntington Beach: | 7.9% (7,341) |
| California: | 12.5% (1,564,905) |
In 3 person carpool:
| Huntington Beach: | 1.3% (1,163) |
| California: | 2.6% (330,732) |
In 4 person carpool:
| Huntington Beach: | 0.3% (253) |
| California: | 1.0% (119,364) |
In 5-6 person carpool:
| Huntington Beach: | 0.2% (160) |
| California: | 0.5% (57,036) |
In 7+ person carpool:
| Huntington Beach: | 0.2% (193) |
| California: | 0.3% (41,276) |
Class of workers
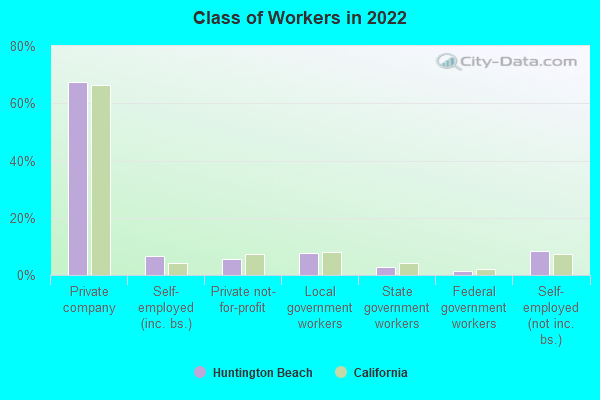
Employee of private company:
| Huntington Beach: | 67.3% (70,664) |
| California: | 66.5% (12,596,030) |
Self-employed in own incorporated business:
| Huntington Beach: | 6.6% (6,968) |
| California: | 4.1% (784,709) |
Private not-for-profit wage and salary workers:
| Huntington Beach: | 5.4% (5,716) |
| California: | 7.5% (1,417,407) |
Local government workers:
| Huntington Beach: | 7.6% (7,984) |
| California: | 8.2% (1,547,056) |
State government workers:
| Huntington Beach: | 2.9% (3,015) |
| California: | 4.1% (780,915) |
Federal government workers:
| Huntington Beach: | 1.5% (1,612) |
| California: | 2.0% (369,858) |
Self-employed workers in own not incorporated business:
| Huntington Beach: | 8.5% (8,916) |
| California: | 7.4% (1,410,735) |
Unpaid family workers:
| Huntington Beach: | 0.1% (94) |
| California: | 0.2% (36,267) |

Employee of private company:
| Huntington Beach: | 70.5% (72,473) |
| California: | 68.0% (10,009,465) |
Self-employed in own incorporated business:
| Huntington Beach: | 3.6% (3,754) |
| California: | 2.7% (402,392) |
Private not-for-profit wage and salary workers:
| Huntington Beach: | 4.3% (4,457) |
| California: | 5.7% (845,536) |
Local government workers:
| Huntington Beach: | 8.4% (8,601) |
| California: | 8.3% (1,218,764) |
State government workers:
| Huntington Beach: | 3.1% (3,237) |
| California: | 4.0% (594,953) |
Federal government workers:
| Huntington Beach: | 1.0% (1,022) |
| California: | 2.3% (344,354) |
Self-employed workers in own not incorporated business:
| Huntington Beach: | 8.7% (8,959) |
| California: | 8.5% (1,249,530) |
Unpaid family workers:
| Huntington Beach: | 0.4% (363) |
| California: | 0.4% (53,934) |

Employee of private company - Males:
| Huntington Beach: | 69.0% (39,139) |
| California: | 70.3% (7,191,252) |
Self-employed in own incorporated business - Males:
| Huntington Beach: | 8.3% (4,691) |
| California: | 4.9% (504,764) |
Private not-for-profit wage and salary workers - Males:
| Huntington Beach: | 2.7% (1,510) |
| California: | 5.2% (529,122) |
Local government workers - Males:
| Huntington Beach: | 5.8% (3,297) |
| California: | 6.0% (610,331) |
State government workers - Males:
| Huntington Beach: | 3.0% (1,680) |
| California: | 3.4% (343,636) |
Federal government workers - Males:
| Huntington Beach: | 1.5% (843) |
| California: | 2.1% (209,874) |
Self-employed workers in own not incorporated business - Males:
| Huntington Beach: | 9.8% (5,580) |
| California: | 8.1% (824,359) |

Employee of private company - Females:
| Huntington Beach: | 65.4% (31,525) |
| California: | 62.0% (5,404,778) |
Self-employed in own incorporated business - Females:
| Huntington Beach: | 4.7% (2,277) |
| California: | 3.2% (279,945) |
Private not-for-profit wage and salary workers - Females:
| Huntington Beach: | 8.7% (4,206) |
| California: | 10.2% (888,285) |
Local government workers - Females:
| Huntington Beach: | 9.7% (4,687) |
| California: | 10.8% (936,725) |
State government workers - Females:
| Huntington Beach: | 2.8% (1,335) |
| California: | 5.0% (437,279) |
Federal government workers - Females:
| Huntington Beach: | 1.6% (769) |
| California: | 1.8% (159,984) |
Self-employed workers in own not incorporated business - Females:
| Huntington Beach: | 6.9% (3,336) |
| California: | 6.7% (586,376) |
Unpaid family workers - Females:
| Huntington Beach: | 0.2% (94) |
| California: | 0.2% (18,345) |