Work and Jobs in Falkner, Mississippi (MS) Detailed Stats
Data:
Unemployment (%)
Unemployment (% change since 2000)
Unemployment (%) - White
Unemployment (% change since 2000) - White
Unemployment (%) - Black or African American
Unemployment (% change since 2000) - Black or African American
Unemployment (%) - Asian
Unemployment (% change since 2000) - Asian
Unemployment (%) - Hispanic or Latino
Unemployment (% change since 2000) - Hispanic or Latino
Unemployment (%) - American Indian and Alaska Native
Unemployment (% change since 2000) - American Indian and Alaska Native
Unemployment (%) - Multirace
Unemployment (% change since 2000) - Multirace
Unemployment (%) - Other Race
Unemployment (% change since 2000) - Other Race
Industry diversity
Most Common Industries - Agriculture, forestry, fishing and hunting, and mining (%)
Most Common Industries - Agriculture, forestry, fishing and hunting (%)
Most Common Industries - Mining, quarrying, and oil and gas extraction (%)
Most Common Industries - Construction (%)
Most Common Industries - Manufacturing (%)
Most Common Industries - Wholesale trade (%)
Most Common Industries - Retail trade (%)
Most Common Industries - Transportation and warehousing, and utilities (%)
Most Common Industries - Transportation and warehousing (%)
Most Common Industries - Utilities (%)
Most Common Industries - Information (%)
Most Common Industries - Finance and insurance, and real estate and rental and leasing (%)
Most Common Industries - Finance and insurance (%)
Most Common Industries - Real estate and rental and leasing (%)
Most Common Industries - Professional, scientific, and management, and administrative and waste management services (%)
Most Common Industries - Professional, scientific, and technical services (%)
Most Common Industries - Management of companies and enterprises (%)
Most Common Industries - Administrative and support and waste management services (%)
Most Common Industries - Educational services, and health care and social assistance (%)
Most Common Industries - Educational services (%)
Most Common Industries - Health care and social assistance (%)
Most Common Industries - Arts, entertainment, and recreation, and accommodation and food services (%)
Most Common Industries - Arts, entertainment, and recreation (%)
Most Common Industries - Accommodation and food services (%)
Most Common Industries - Other services, except public administration (%)
Most Common Industries - Public administration (%)
Occupation diversity
Most Common Occupations - Management, business, science, and arts occupations (%)
Most Common Occupations - Management, business, and financial occupations (%)
Most Common Occupations - Management occupations (%)
Most Common Occupations - Business and financial operations occupations (%)
Most Common Occupations - Computer, engineering, and science occupations (%)
Most Common Occupations - Computer and mathematical occupations (%)
Most Common Occupations - Architecture and engineering occupations (%)
Most Common Occupations - Life, physical, and social science occupations (%)
Most Common Occupations - Education, legal, community service, arts, and media occupations (%)
Most Common Occupations - Community and social service occupations (%)
Most Common Occupations - Legal occupations (%)
Most Common Occupations - Education, training, and library occupations (%)
Most Common Occupations - Arts, design, entertainment, sports, and media occupations (%)
Most Common Occupations - Healthcare practitioners and technical occupations (%)
Most Common Occupations - Health diagnosing and treating practitioners and other technical occupations (%)
Most Common Occupations - Health technologists and technicians (%)
Most Common Occupations - Service occupations (%)
Most Common Occupations - Healthcare support occupations (%)
Most Common Occupations - Protective service occupations (%)
Most Common Occupations - Fire fighting and prevention, and other protective service workers including supervisors (%)
Most Common Occupations - Law enforcement workers including supervisors (%)
Most Common Occupations - Food preparation and serving related occupations (%)
Most Common Occupations - Building and grounds cleaning and maintenance occupations (%)
Most Common Occupations - Personal care and service occupations (%)
Most Common Occupations - Sales and office occupations (%)
Most Common Occupations - Sales and related occupations (%)
Most Common Occupations - Office and administrative support occupations (%)
Most Common Occupations - Natural resources, construction, and maintenance occupations (%)
Most Common Occupations - Farming, fishing, and forestry occupations (%)
Most Common Occupations - Construction and extraction occupations (%)
Most Common Occupations - Installation, maintenance, and repair occupations (%)
Most Common Occupations - Production, transportation, and material moving occupations (%)
Most Common Occupations - Production occupations (%)
Most Common Occupations - Transportation occupations (%)
Most Common Occupations - Material moving occupations (%)
Private vehicle occupancy - Drove alone (% change since 2000)
Private vehicle occupancy - Carpooled (%)
Private vehicle occupancy - Carpooled (% change since 2000)
Private vehicle occupancy - In 2-person carpool (%)
Private vehicle occupancy - In 2-person carpool (% change since 2000)
Private vehicle occupancy - In 3-person carpool (%)
Private vehicle occupancy - In 3-person carpool (% change since 2000)
Private vehicle occupancy - In 4-person carpool (%)
Private vehicle occupancy - In 4-person carpool (% change since 2000)
Private vehicle occupancy - In 5- or 6-person carpool (%)
Private vehicle occupancy - In 5- or 6-person carpool (% change since 2000)
Private vehicle occupancy - In 7-or-more-person carpool (%)
Private vehicle occupancy - In 7-or-more-person carpool (% change since 2000)
Time Leaving Home To Go To Work - 12:00 a.m. to 4:59 a.m. (%)
Time Leaving Home To Go To Work - 12:00 a.m. to 4:59 a.m. (% change since 2000)
Time Leaving Home To Go To Work - 5:00 a.m. to 5:59 a.m. (%)
Time Leaving Home To Go To Work - 5:00 a.m. to 5:59 a.m. (% change since 2000)
Time Leaving Home To Go To Work - 6:00 a.m. to 6:59 a.m. (%)
Time Leaving Home To Go To Work - 6:00 a.m. to 6:59 a.m. (% change since 2000)
Time Leaving Home To Go To Work - 7:00 a.m. to 7:59 a.m. (%)
Time Leaving Home To Go To Work - 7:00 a.m. to 7:59 a.m. (% change since 2000)
Time Leaving Home To Go To Work - 8:00 a.m. to 8:59 a.m. (%)
Time Leaving Home To Go To Work - 8:00 a.m. to 8:59 a.m. (% change since 2000)
Time Leaving Home To Go To Work - 9:00 a.m. to 9:59 a.m. (%)
Time Leaving Home To Go To Work - 9:00 a.m. to 9:59 a.m. (% change since 2000)
Time Leaving Home To Go To Work - 10:00 a.m. to 10:59 a.m. (%)
Time Leaving Home To Go To Work - 10:00 a.m. to 10:59 a.m. (% change since 2000)
Time Leaving Home To Go To Work - 11:00 a.m. to 11:59 a.m. (%)
Time Leaving Home To Go To Work - 11:00 a.m. to 11:59 a.m. (% change since 2000)
Time Leaving Home To Go To Work - 12:00 p.m. to 3:59 p.m. (%)
Time Leaving Home To Go To Work - 12:00 p.m. to 3:59 p.m. (% change since 2000)
Time Leaving Home To Go To Work - 4:00 p.m. to 11:59 p.m. (%)
Time Leaving Home To Go To Work - 4:00 p.m. to 11:59 p.m. (% change since 2000)
Class of Workers - Employee of private company (%)
Class of Workers - Employee of private company (% change since 2000)
Class of Workers - Self-employed in own incorporated business (%)
Class of Workers - Self-employed in own incorporated business (% change since 2000)
Class of Workers - Private not-for-profit wage and salary workers (%)
Class of Workers - Private not-for-profit wage and salary workers (% change since 2000)
Class of Workers - Local government workers (%)
Class of Workers - Local government workers (% change since 2000)
Class of Workers - State government workers (%)
Class of Workers - State government workers (% change since 2000)
Class of Workers - Federal government workers (%)
Class of Workers - Federal government workers (% change since 2000)
Class of Workers - Self-employed workers in own not incorporated business and Unpaid family workers (%)
Class of Workers - Self-employed workers in own not incorporated business and Unpaid family workers (% change since 2000)
Means of transportation to work - Drove car alone (%)
Means of transportation to work - Drove car alone (% change since 2000)
Means of transportation to work - Carpooled (%)
Means of transportation to work - Carpooled (% change since 2000)
Means of transportation to work - Public transportation (%)
Means of transportation to work - Public transportation (% change since 2000)
Means of transportation to work - Bus or trolley bus (%)
Means of transportation to work - Bus or trolley bus (% change since 2000)
Means of transportation to work - Streetcar or trolley car (%)
Means of transportation to work - Streetcar or trolley car (% change since 2000)
Means of transportation to work - Subway or elevated (%)
Means of transportation to work - Subway or elevated (% change since 2000)
Means of transportation to work - Railroad (%)
Means of transportation to work - Railroad (% change since 2000)
Means of transportation to work - Ferryboat (%)
Means of transportation to work - Ferryboat (% change since 2000)
Means of transportation to work - Taxicab (%)
Means of transportation to work - Taxicab (% change since 2000)
Means of transportation to work - Motorcycle (%)
Means of transportation to work - Motorcycle (% change since 2000)
Means of transportation to work - Bicycle (%)
Means of transportation to work - Bicycle (% change since 2000)
Means of transportation to work - Walked (%)
Means of transportation to work - Walked (% change since 2000)
Means of transportation to work - Other means (%)
Means of transportation to work - Other means (% change since 2000)
Working at home (%)
Working at home (% change since 2000)
Travel time to work - Less than 5 minutes (%)
Travel time to work - Less than 5 minutes (% change since 2000)
Travel time to work - 5 to 9 minutes (%)
Travel time to work - 5 to 9 minutes (% change since 2000)
Travel time to work - 10 to 19 minutes (%)
Travel time to work - 10 to 19 minutes (% change since 2000)
Travel time to work - 20 to 29 minutes (%)
Travel time to work - 20 to 29 minutes (% change since 2000)
Travel time to work - 30 to 39 minutes (%)
Travel time to work - 30 to 39 minutes (% change since 2000)
Travel time to work - 40 to 59 minutes (%)
Travel time to work - 40 to 59 minutes (% change since 2000)
Travel time to work - 60 to 89 minutes (%)
Travel time to work - 60 to 89 minutes (% change since 2000)
Travel time to work - 90 or more minutes (%)
Travel time to work - 90 or more minutes (% change since 2000)
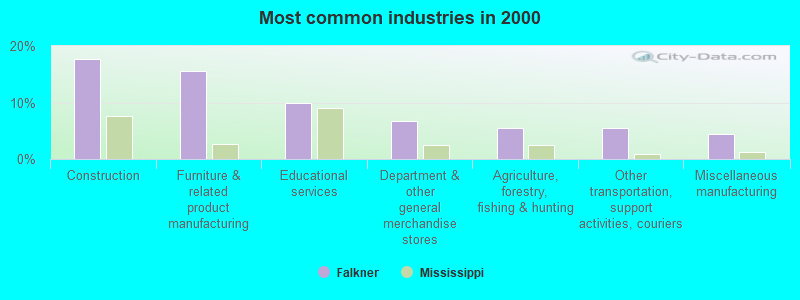
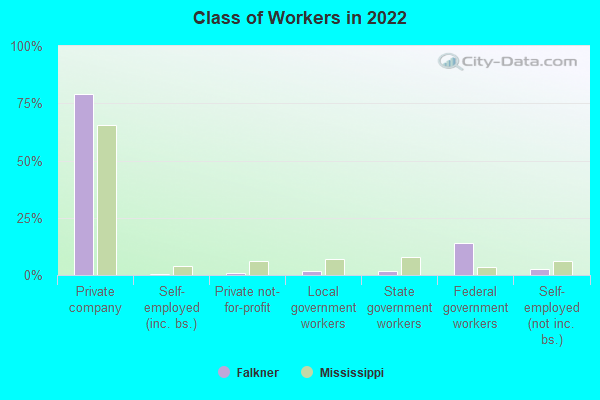
The most common industries in Falkner are: Construction (17.8% of civilian employees), Furniture & related product manufacturing (15.6% of civilian employees), Educational services (10.0% of civilian employees). 73.0% of workers work in Tippah County and 3.9% of all workers work at home. 79.1% of workers are employees of private companies, which is 17.4% greater than the rate of 65.3% across the entire state of Mississippi.
Whole page based on the data from 2000 / 2022 when the population of Falkner, Mississippi was 212 / 807
Most common industries
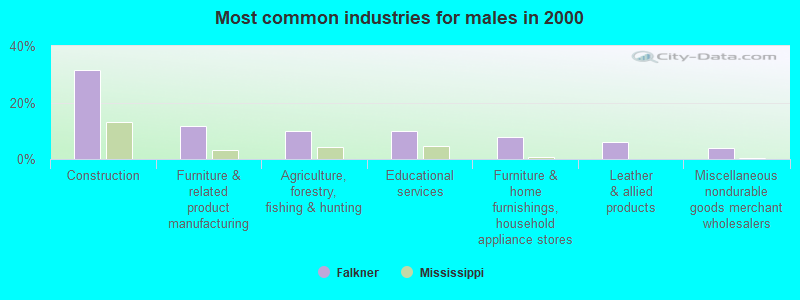
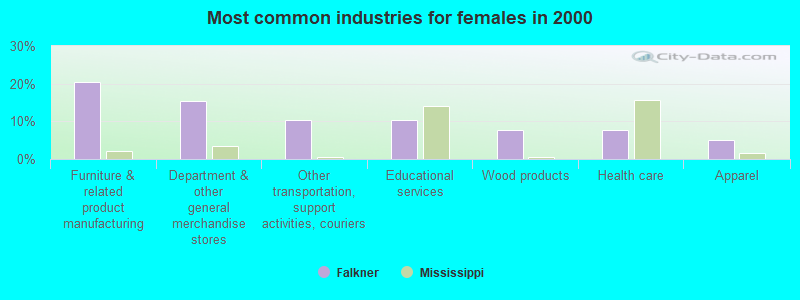
Most common industries Industry All Males Females
Construction 17.8% 31.4% 0.0% Furniture and related product manufacturing 15.6% 11.8% 20.5% Educational services 10.0% 9.8% 10.3% Department and other general merchandise stores 6.7% 0.0% 15.4% Agriculture, forestry, fishing and hunting 5.6% 9.8% 0.0% Other transportation, and support activities, and couriers 5.6% 2.0% 10.3% Miscellaneous manufacturing 4.4% 3.9% 5.1% Furniture and home furnishings, and household appliance stores 4.4% 7.8% 0.0% Leather and allied products 3.3% 5.9% 0.0% Wood products 3.3% 0.0% 7.7% Health care 3.3% 0.0% 7.7% Apparel 2.2% 0.0% 5.1% Miscellaneous nondurable goods merchant wholesalers 2.2% 3.9% 0.0% Public administration 2.2% 0.0% 5.1% Professional, scientific, and technical services 2.2% 0.0% 5.1% Religious, grantmaking, civic, professional, and similar organizations 2.2% 3.9% 0.0% Private households 2.2% 0.0% 5.1% Plastics and rubber products 1.1% 2.0% 0.0% Machinery 1.1% 2.0% 0.0% Groceries and related products merchant wholesalers 1.1% 2.0% 0.0% Finance and insurance 1.1% 2.0% 0.0% Arts, entertainment, and recreation 1.1% 0.0% 2.6% Accommodation and food services 1.1% 2.0% 0.0%
Unemployment in Falkner Unemployment by race in 2022
Unemployment rate for White non-Hispanic residents 7.5% Males9.7% FemalesUnemployment rate for Black residents 32.9% Males30.7% FemalesUnemployment by race in 2000
Unemployment rate for White non-Hispanic residents 5.7% Females
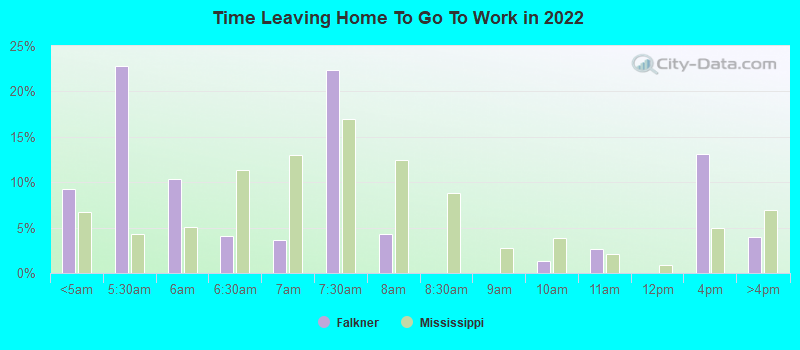
Time leaving home to go to work 12:00 a.m. to 4:59 a.m.: Falkner:
9.3% (21)Mississippi:
6.7% (79,011)
5:00 a.m. to 5:29 a.m.: Falkner:
22.8% (51)Mississippi:
4.4% (51,439)
5:30 a.m. to 5:59 a.m.: Falkner:
10.3% (23)Mississippi:
5.0% (59,537)
6:00 a.m. to 6:29 a.m.: Falkner:
4.1% (9)Mississippi:
11.3% (133,877)
6:30 a.m. to 6:59 a.m.: Falkner:
3.7% (8)Mississippi:
13.0% (153,080)
7:00 a.m. to 7:29 a.m.: Falkner:
22.4% (50)Mississippi:
16.9% (200,266)
7:30 a.m. to 7:59 a.m.: Falkner:
4.3% (10)Mississippi:
12.5% (147,603)
9:00 a.m. to 9:59 a.m.: Falkner:
1.3% (3)Mississippi:
3.8% (45,125)
10:00 a.m. to 10:59 a.m.: Falkner:
2.7% (6)Mississippi:
2.1% (24,276)
12:00 p.m. to 3:59 p.m.: Falkner:
13.1% (29)Mississippi:
5.0% (58,682)
4:00 p.m. to 11:59 p.m.: Falkner:
4.0% (9)Mississippi:
6.9% (81,661)
<5am: Falkner:
2.3% (2)Mississippi:
4.3% (50,086)
5:30am: Falkner:
2.3% (2)Mississippi:
3.4% (39,399)
6am: Falkner:
3.4% (3)Mississippi:
5.4% (62,297)
6:30am: Falkner:
23.9% (21)Mississippi:
10.7% (125,036)
7am: Falkner:
19.3% (17)Mississippi:
14.0% (163,121)
7:30am: Falkner:
29.5% (26)Mississippi:
15.7% (182,928)
8am: Falkner:
4.5% (4)Mississippi:
15.7% (182,414)
8:30am: Falkner:
2.3% (2)Mississippi:
6.9% (80,436)
4pm: Falkner:
9.1% (8)Mississippi:
6.6% (77,163)
12:00 a.m. to 4:59 a.m. - Males: Falkner:
2.5% (2)Mississippi:
8.8% (54,252)
5:00 a.m. to 5:29 a.m. - Males: Falkner:
25.3% (22)Mississippi:
5.9% (36,183)
5:30 a.m. to 5:59 a.m. - Males: Falkner:
21.3% (18)Mississippi:
6.3% (38,697)
6:00 a.m. to 6:29 a.m. - Males: Falkner:
6.0% (5)Mississippi:
13.6% (83,465)
6:30 a.m. to 6:59 a.m. - Males: Falkner:
3.6% (3)Mississippi:
12.8% (78,604)
7:00 a.m. to 7:29 a.m. - Males: Falkner:
16.1% (14)Mississippi:
15.4% (94,605)
7:30 a.m. to 7:59 a.m. - Males: Falkner:
4.3% (4)Mississippi:
9.4% (57,558)
12:00 p.m. to 3:59 p.m. - Males: Falkner:
7.6% (7)Mississippi:
4.7% (28,857)
4:00 p.m. to 11:59 p.m. - Males: Falkner:
10.0% (9)Mississippi:
6.8% (41,602)
12:00 a.m. to 4:59 a.m. - Females: Falkner:
13.2% (18)Mississippi:
4.4% (24,759)
5:00 a.m. to 5:29 a.m. - Females: Falkner:
22.8% (32)Mississippi:
2.7% (15,256)
5:30 a.m. to 5:59 a.m. - Females: Falkner:
3.5% (5)Mississippi:
3.7% (20,840)
6:00 a.m. to 6:29 a.m. - Females: Falkner:
2.9% (4)Mississippi:
8.9% (50,412)
6:30 a.m. to 6:59 a.m. - Females: Falkner:
3.8% (5)Mississippi:
13.1% (74,476)
7:00 a.m. to 7:29 a.m. - Females: Falkner:
25.7% (36)Mississippi:
18.6% (105,661)
7:30 a.m. to 7:59 a.m. - Females: Falkner:
4.4% (6)Mississippi:
15.8% (90,045)
9:00 a.m. to 9:59 a.m. - Females: Falkner:
1.9% (3)Mississippi:
4.4% (24,778)
10:00 a.m. to 10:59 a.m. - Females: Falkner:
4.1% (6)Mississippi:
2.4% (13,376)
12:00 p.m. to 3:59 p.m. - Females: Falkner:
16.9% (23)Mississippi:
5.2% (29,825)
Travel time to work Percentage of workers working in this county: 73.0%Number of people working at home: 9 (3.9% of all workers )
Less than 5 minutes: Falkner:
2.3% (2)Mississippi:
3.7% (43,278)
5 to 9 minutes: Falkner:
6.8% (6)Mississippi:
12.3% (142,991)
10 to 14 minutes: Falkner:
4.5% (4)Mississippi:
16.2% (188,931)
15 to 19 minutes: Falkner:
18.2% (16)Mississippi:
17.0% (197,875)
20 to 24 minutes: Falkner:
18.2% (16)Mississippi:
14.0% (163,362)
25 to 29 minutes: Falkner:
1.1% (1)Mississippi:
5.2% (60,981)
30 to 34 minutes: Falkner:
8.0% (7)Mississippi:
12.7% (147,453)
35 to 39 minutes: Falkner:
4.5% (4)Mississippi:
2.1% (24,839)
40 to 44 minutes: Falkner:
6.8% (6)Mississippi:
2.2% (25,310)
45 to 59 minutes: Falkner:
10.2% (9)Mississippi:
5.9% (68,120)
90 or more minutes: Falkner:
15.9% (14)Mississippi:
3.1% (36,405)
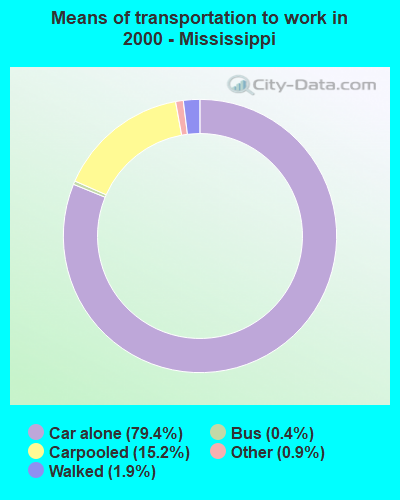
Means of transportation to work Drove car alone: Falkner:
80.7% (71)Mississippi:
79.4% (924,506)
Carpooled: Falkner:
13.6% (12)Mississippi:
15.2% (176,465)
Walked: Falkner:
2.3% (2)Mississippi:
1.9% (21,868)
Private vehicle occupancy Drove alone: Falkner:
90.6% (204)Mississippi:
89.5% (1,024,151)
In 2 person carpool: Falkner:
8.9% (20)Mississippi:
7.6% (87,211)
Drove alone: Falkner:
85.5% (71)Mississippi:
84.0% (924,506)
In 2 person carpool: Falkner:
14.5% (12)Mississippi:
12.0% (131,637)
Class of workers
Employee of private company: Falkner:
79.1% (191)Mississippi:
65.3% (821,247)
Self-employed in own incorporated business: Falkner:
0.4% (1)Mississippi:
3.8% (47,388)
Private not-for-profit wage and salary workers: Falkner:
0.8% (2)Mississippi:
6.2% (77,572)
Local government workers: Falkner:
1.7% (4)Mississippi:
7.2% (90,424)
State government workers: Falkner:
1.7% (4)Mississippi:
7.9% (98,947)
Federal government workers: Falkner:
13.8% (33)Mississippi:
3.5% (43,958)
Self-employed workers in own not incorporated business: Falkner:
2.5% (6)Mississippi:
6.0% (75,827)
Employee of private company: Falkner:
65.6% (59)Mississippi:
67.9% (796,519)
Private not-for-profit wage and salary workers: Falkner:
2.2% (2)Mississippi:
4.8% (56,264)
Local government workers: Falkner:
6.7% (6)Mississippi:
6.0% (70,288)
State government workers: Falkner:
5.6% (5)Mississippi:
8.4% (98,464)
Federal government workers: Falkner:
2.2% (2)Mississippi:
3.2% (37,771)
Self-employed workers in own not incorporated business: Falkner:
15.6% (14)Mississippi:
6.4% (75,022)
Unpaid family workers: Falkner:
2.2% (2)Mississippi:
0.4% (4,344)
Employee of private company - Males: Falkner:
90.6% (78)Mississippi:
68.3% (437,426)
Self-employed in own incorporated business - Males: Falkner:
1.2% (1)Mississippi:
4.8% (30,659)
Local government workers - Males: Falkner:
3.5% (3)Mississippi:
5.6% (35,801)
Self-employed workers in own not incorporated business - Males: Falkner:
4.7% (4)Mississippi:
7.5% (48,100)
Employee of private company - Females: Falkner:
72.7% (113)Mississippi:
62.2% (383,821)
Private not-for-profit wage and salary workers - Females: Falkner:
1.3% (2)Mississippi:
8.3% (51,258)
Local government workers - Females: Falkner:
0.6% (1)Mississippi:
8.8% (54,623)
State government workers - Females: Falkner:
2.6% (4)Mississippi:
10.0% (61,628)
Federal government workers - Females: Falkner:
21.4% (33)Mississippi:
3.3% (20,371)
Self-employed workers in own not incorporated business - Females: Falkner:
1.3% (2)Mississippi:
4.5% (27,727)