Work and Jobs in East Canadian, Oklahoma (OK) Detailed Stats
Occupations, Industries, Unemployment, Workers, Commute
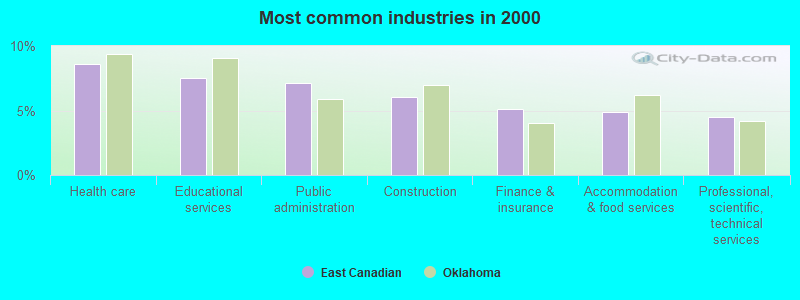
The most common industries in East Canadian are: Health care (8.6% of civilian employees), Educational services (7.5% of civilian employees), Public administration (7.1% of civilian employees). 68.8% of workers are employees of private companies, which is 5.6% greater than the rate of 65.0% across the entire state of Oklahoma.
Most common industries
Most common industries | |||
|---|---|---|---|
Industry | All | Males | Females |
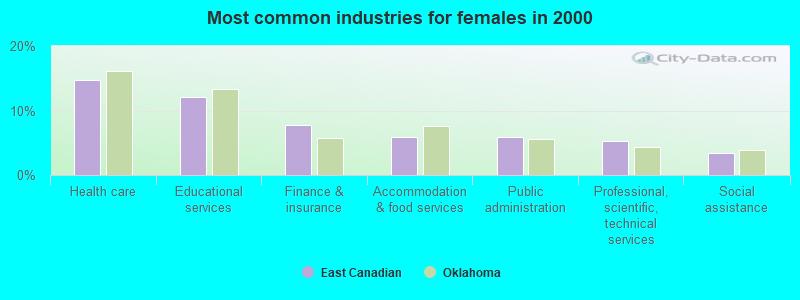
| Health care | 8.6% (2,765) | 3.4% (594) | 14.7% (2,171) |
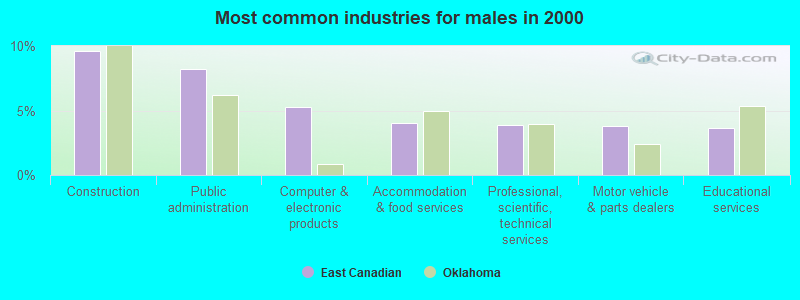
| Educational services | 7.5% (2,409) | 3.6% (629) | 12.1% (1,780) |
| Public administration | 7.1% (2,293) | 8.2% (1,428) | 5.9% (865) |
| Construction | 6.0% (1,929) | 9.6% (1,670) | 1.8% (259) |
| Finance and insurance | 5.1% (1,640) | 2.9% (503) | 7.7% (1,137) |
| Accommodation and food services | 4.9% (1,576) | 4.0% (700) | 5.9% (876) |
| Professional, scientific, and technical services | 4.5% (1,448) | 3.9% (672) | 5.3% (776) |
| Computer and electronic products | 4.1% (1,316) | 5.2% (910) | 2.7% (406) |
| Motor vehicle and parts dealers | 2.5% (803) | 3.8% (665) | 0.9% (138) |
| Real estate and rental and leasing | 2.3% (741) | 1.9% (333) | 2.8% (408) |
| Truck transportation | 2.3% (739) | 3.4% (597) | 1.0% (142) |
| Administrative and support and waste management services | 2.3% (736) | 2.2% (380) | 2.4% (356) |
| Repair and maintenance | 2.2% (712) | 3.5% (607) | 0.7% (105) |
| Machinery | 2.2% (695) | 3.1% (537) | 1.1% (158) |
| Food and beverage stores | 1.9% (623) | 1.5% (259) | 2.5% (364) |
| Transportation equipment | 1.9% (596) | 2.8% (480) | 0.8% (116) |
| Mining, quarrying, and oil and gas extraction | 1.8% (589) | 2.4% (410) | 1.2% (179) |
| Department and other general merchandise stores | 1.7% (561) | 1.3% (230) | 2.2% (331) |
| Social assistance | 1.7% (548) | 0.2% (34) | 3.5% (514) |
| Broadcasting and telecommunications | 1.5% (486) | 1.6% (284) | 1.4% (202) |
| Personal and laundry services | 1.5% (467) | 0.7% (120) | 2.3% (347) |
| Religious, grantmaking, civic, professional, and similar organizations | 1.4% (462) | 1.2% (201) | 1.8% (261) |
| Plastics and rubber products | 1.4% (449) | 2.1% (358) | 0.6% (91) |
| Metal and metal products | 1.2% (401) | 2.0% (351) | 0.3% (50) |
| Other transportation, and support activities, and couriers | 1.1% (358) | 1.6% (275) | 0.6% (83) |
| Building material and garden equipment and supplies dealers | 1.1% (343) | 1.5% (264) | 0.5% (79) |
| Utilities | 1.1% (339) | 1.5% (262) | 0.5% (77) |
| Agriculture, forestry, fishing and hunting | 1.0% (331) | 1.5% (265) | 0.4% (66) |
| Miscellaneous manufacturing | 0.9% (303) | 1.1% (187) | 0.8% (116) |
| Groceries and related products merchant wholesalers | 0.9% (294) | 1.0% (171) | 0.8% (123) |
| Air transportation | 0.9% (286) | 0.7% (113) | 1.2% (173) |
| Machinery, equipment, and supplies merchant wholesalers | 0.9% (278) | 1.3% (220) | 0.4% (58) |
| Arts, entertainment, and recreation | 0.9% (273) | 0.8% (146) | 0.9% (127) |
| U. S. Postal service | 0.7% (237) | 1.0% (176) | 0.4% (61) |
| Sporting goods, camera, and hobby and toy stores | 0.7% (234) | 0.6% (110) | 0.8% (124) |
| Printing and related support activities | 0.6% (207) | 0.8% (132) | 0.5% (75) |
| Furniture and home furnishings, and household appliance stores | 0.6% (186) | 0.7% (129) | 0.4% (57) |
| Food | 0.6% (181) | 0.7% (116) | 0.4% (65) |
| Pharmacies and drug stores | 0.5% (169) | 0.3% (44) | 0.8% (125) |
| Other direct selling establishments | 0.5% (162) | 0.4% (65) | 0.7% (97) |
| Motor vehicles, parts and supplies merchant wholesalers | 0.5% (153) | 0.8% (145) | 0.1% (8) |
| Radio, TV, and computer stores | 0.4% (138) | 0.5% (95) | 0.3% (43) |
| Electrical and electronic goods merchant wholesalers | 0.4% (138) | 0.7% (118) | 0.1% (20) |
| Data processing, libraries, and other information services | 0.4% (136) | 0.3% (45) | 0.6% (91) |
| Used merchandise, gift, novelty, and souvenir, and other miscellaneous stores | 0.4% (132) | 0.2% (35) | 0.7% (97) |
| Clothing and accessories, including shoe, stores | 0.4% (130) | 0.2% (41) | 0.6% (89) |
| Retail florists | 0.4% (124) | 0.1% (19) | 0.7% (105) |
| Professional and commercial equipment and supplies merchant wholesalers | 0.4% (123) | 0.5% (86) | 0.3% (37) |
| Paper | 0.4% (119) | 0.5% (80) | 0.3% (39) |
| Gasoline stations | 0.4% (113) | 0.3% (52) | 0.4% (61) |
| Chemicals | 0.3% (109) | 0.3% (59) | 0.3% (50) |
| Publishing, and motion picture and sound recording industries | 0.3% (103) | 0.4% (64) | 0.3% (39) |
| Petroleum and petroleum products merchant wholesalers | 0.3% (100) | 0.4% (76) | 0.2% (24) |
| Private households | 0.3% (90) | 0.1% (12) | 0.5% (78) |
| Furniture and related product manufacturing | 0.2% (79) | 0.4% (61) | 0.1% (18) |
| Warehousing and storage | 0.2% (78) | 0.3% (59) | 0.1% (19) |
| Electrical equipment, appliances, and components | 0.2% (77) | 0.2% (40) | 0.3% (37) |
| Drugs, sundries, and chemical and allied products merchant wholesalers | 0.2% (76) | 0.3% (44) | 0.2% (32) |
| Paper and paper products merchant wholesalers | 0.2% (74) | 0.3% (49) | 0.2% (25) |
| Hardware, plumbing and heating equipment, and supplies merchant wholesalers | 0.2% (74) | 0.4% (62) | 0.1% (12) |
| Health and personal care, except drug, stores | 0.2% (73) | 0.2% (33) | 0.3% (40) |
| Miscellaneous nondurable goods merchant wholesalers | 0.2% (71) | 0.2% (42) | 0.2% (29) |
| Lumber and other construction materials merchant wholesalers | 0.2% (63) | 0.4% (63) | 0.0% (0) |
| Nonmetallic mineral products | 0.2% (61) | 0.2% (34) | 0.2% (27) |
| Miscellaneous durable goods merchant wholesalers | 0.2% (58) | 0.3% (52) | 0.0% (6) |
| Vending machine operators | 0.2% (51) | 0.2% (30) | 0.1% (21) |
| Wood products | 0.1% (44) | 0.2% (33) | 0.1% (11) |
| Rail transportation | 0.1% (37) | 0.2% (37) | 0.0% (0) |
| Furniture and home furnishing merchant wholesalers | 0.1% (33) | 0.1% (16) | 0.1% (17) |
| Metals and minerals, except petroleum, merchant wholesalers | 0.1% (24) | 0.1% (24) | 0.0% (0) |
| Alcoholic beverages merchant wholesalers | 0.1% (19) | 0.1% (19) | 0.0% (0) |
Unemployment in East Canadian
- Unemployment by race in 2000
- Unemployment rate for White non-Hispanic residents
- 2.8%Males
- 3.2%Females
- Unemployment rate for Black residents
- 5.4%Females
- Unemployment rate for American Indian and Alaska Native residents
- 1.1%Males
- 0.7%Females
- Unemployment rate for Asian residents
- 1.9%Males
- 1.9%Females
- Unemployment rate for other race residents
- 6.2%Females
- Unemployment rate for two or more race residents
- 3.6%Males
- 8.3%Females
- Unemployment rate for Hispanic or Latino residents
- 4.3%Males
- 8.3%Females
Time leaving home to go to work

<5am:
| East Canadian: | 1.9% (591) |
| Oklahoma: | 3.2% (49,592) |
5:30am:
| East Canadian: | 1.9% (600) |
| Oklahoma: | 2.6% (39,776) |
6am:
| East Canadian: | 3.9% (1,239) |
| Oklahoma: | 4.1% (63,119) |
6:30am:
| East Canadian: | 8.2% (2,597) |
| Oklahoma: | 7.4% (113,788) |
7am:
| East Canadian: | 11.0% (3,512) |
| Oklahoma: | 9.7% (148,896) |
7:30am:
| East Canadian: | 17.9% (5,697) |
| Oklahoma: | 14.8% (228,201) |
8am:
| East Canadian: | 19.0% (6,029) |
| Oklahoma: | 18.7% (288,028) |
8:30am:
| East Canadian: | 10.6% (3,363) |
| Oklahoma: | 10.3% (158,266) |
9am:
| East Canadian: | 3.9% (1,232) |
| Oklahoma: | 4.5% (69,899) |
10am:
| East Canadian: | 4.0% (1,284) |
| Oklahoma: | 4.8% (73,878) |
11am:
| East Canadian: | 1.9% (612) |
| Oklahoma: | 2.1% (31,864) |
12pm:
| East Canadian: | 0.5% (171) |
| Oklahoma: | 0.9% (14,019) |
4pm:
| East Canadian: | 6.2% (1,983) |
| Oklahoma: | 6.8% (105,387) |
>4pm:
| East Canadian: | 6.6% (2,112) |
| Oklahoma: | 7.0% (107,522) |
Travel time to work


Less than 5 minutes:
| East Canadian: | 2.1% (681) |
| Oklahoma: | 4.6% (70,320) |
5 to 9 minutes:
| East Canadian: | 8.6% (2,732) |
| Oklahoma: | 13.9% (214,722) |
10 to 14 minutes:
| East Canadian: | 12.2% (3,865) |
| Oklahoma: | 17.2% (264,471) |
15 to 19 minutes:
| East Canadian: | 16.2% (5,141) |
| Oklahoma: | 16.9% (260,374) |
20 to 24 minutes:
| East Canadian: | 22.2% (7,047) |
| Oklahoma: | 14.3% (220,827) |
25 to 29 minutes:
| East Canadian: | 8.9% (2,837) |
| Oklahoma: | 5.2% (79,892) |
30 to 34 minutes:
| East Canadian: | 17.2% (5,459) |
| Oklahoma: | 11.4% (175,459) |
35 to 39 minutes:
| East Canadian: | 2.1% (653) |
| Oklahoma: | 1.8% (27,812) |
40 to 44 minutes:
| East Canadian: | 1.8% (577) |
| Oklahoma: | 2.0% (30,825) |
45 to 59 minutes:
| East Canadian: | 3.4% (1,068) |
| Oklahoma: | 4.7% (72,663) |
60 to 89 minutes:
| East Canadian: | 1.3% (402) |
| Oklahoma: | 2.8% (43,861) |
90 or more minutes:
| East Canadian: | 1.8% (560) |
| Oklahoma: | 2.0% (31,009) |
Means of transportation to work

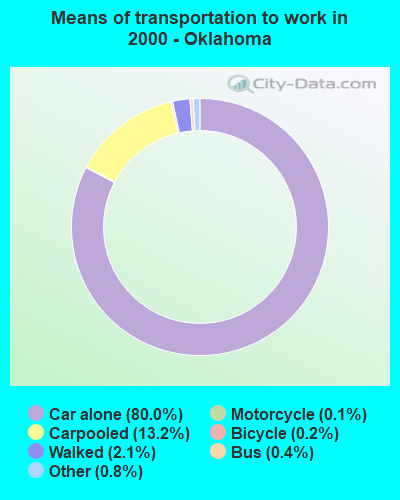
Drove car alone:
| East Canadian: | 86.9% (27,629) |
| Oklahoma: | 80.0% (1,231,711) |
Carpooled:
| East Canadian: | 9.6% (3,043) |
| Oklahoma: | 13.2% (203,444) |
Bus or trolley bus:
| East Canadian: | 0.0% (14) |
| Oklahoma: | 0.4% (5,675) |
Subway or elevated:
| East Canadian: | 0.0% (2) |
| Oklahoma: | 0.0% (135) |
Railroad:
| East Canadian: | 0.0% (5) |
| Oklahoma: | 0.0% (83) |
Taxicab:
| East Canadian: | 0.0% (7) |
| Oklahoma: | 0.1% (1,272) |
Motorcycle:
| East Canadian: | 0.1% (19) |
| Oklahoma: | 0.1% (1,639) |
Bicycle:
| East Canadian: | 0.0% (10) |
| Oklahoma: | 0.2% (2,910) |
Walked:
| East Canadian: | 0.5% (168) |
| Oklahoma: | 2.1% (32,796) |
Other means:
| East Canadian: | 0.4% (125) |
| Oklahoma: | 0.8% (12,279) |
Private vehicle occupancy

Drove alone:
| East Canadian: | 90.1% (27,629) |
| Oklahoma: | 85.8% (1,231,711) |
In 2 person carpool:
| East Canadian: | 8.3% (2,549) |
| Oklahoma: | 11.1% (159,539) |
In 3 person carpool:
| East Canadian: | 1.2% (353) |
| Oklahoma: | 2.0% (29,245) |
In 4 person carpool:
| East Canadian: | 0.2% (62) |
| Oklahoma: | 0.7% (9,499) |
In 5-6 person carpool:
| East Canadian: | 0.1% (16) |
| Oklahoma: | 0.3% (3,652) |
In 7+ person carpool:
| East Canadian: | 0.2% (63) |
| Oklahoma: | 0.1% (1,509) |
Class of workers
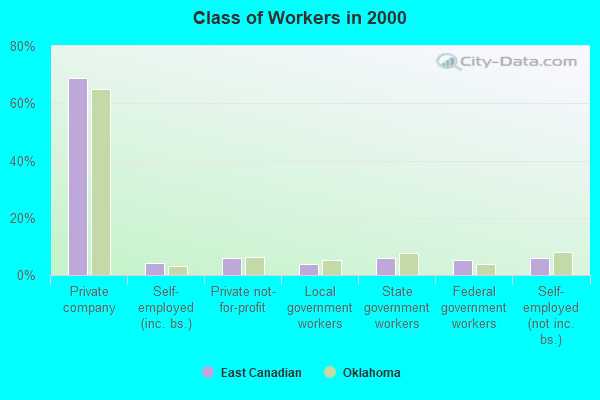
Employee of private company:
| East Canadian: | 68.8% (22,088) |
| Oklahoma: | 65.0% (1,003,702) |
Self-employed in own incorporated business:
| East Canadian: | 4.0% (1,294) |
| Oklahoma: | 3.3% (50,535) |
Private not-for-profit wage and salary workers:
| East Canadian: | 5.9% (1,886) |
| Oklahoma: | 6.4% (98,161) |
Local government workers:
| East Canadian: | 3.9% (1,260) |
| Oklahoma: | 5.3% (81,853) |
State government workers:
| East Canadian: | 5.8% (1,872) |
| Oklahoma: | 7.5% (116,288) |
Federal government workers:
| East Canadian: | 5.3% (1,689) |
| Oklahoma: | 3.9% (60,976) |
Self-employed workers in own not incorporated business:
| East Canadian: | 6.0% (1,913) |
| Oklahoma: | 8.2% (126,134) |
Unpaid family workers:
| East Canadian: | 0.3% (107) |
| Oklahoma: | 0.5% (7,647) |

Employee of private company - Males:
| East Canadian: | 70.8% (12,272) |
| Oklahoma: | 67.0% (557,664) |
Self-employed in own incorporated business - Males:
| East Canadian: | 5.6% (966) |
| Oklahoma: | 4.4% (36,546) |
Private not-for-profit wage and salary workers - Males:
| East Canadian: | 3.0% (523) |
| Oklahoma: | 4.0% (32,993) |
Local government workers - Males:
| East Canadian: | 3.8% (661) |
| Oklahoma: | 4.8% (39,929) |
State government workers - Males:
| East Canadian: | 3.8% (656) |
| Oklahoma: | 5.4% (44,698) |
Federal government workers - Males:
| East Canadian: | 6.1% (1,065) |
| Oklahoma: | 4.2% (34,671) |
Self-employed workers in own not incorporated business - Males:
| East Canadian: | 6.7% (1,159) |
| Oklahoma: | 10.0% (82,902) |
Unpaid family workers - Males:
| East Canadian: | 0.2% (40) |
| Oklahoma: | 0.4% (3,527) |

Employee of private company - Females:
| East Canadian: | 66.5% (9,816) |
| Oklahoma: | 62.6% (446,038) |
Self-employed in own incorporated business - Females:
| East Canadian: | 2.2% (328) |
| Oklahoma: | 2.0% (13,989) |
Private not-for-profit wage and salary workers - Females:
| East Canadian: | 9.2% (1,363) |
| Oklahoma: | 9.1% (65,168) |
Local government workers - Females:
| East Canadian: | 4.1% (599) |
| Oklahoma: | 5.9% (41,924) |
State government workers - Females:
| East Canadian: | 8.2% (1,216) |
| Oklahoma: | 10.0% (71,590) |
Federal government workers - Females:
| East Canadian: | 4.2% (624) |
| Oklahoma: | 3.7% (26,305) |
Self-employed workers in own not incorporated business - Females:
| East Canadian: | 5.1% (754) |
| Oklahoma: | 6.1% (43,232) |
Unpaid family workers - Females:
| East Canadian: | 0.5% (67) |
| Oklahoma: | 0.6% (4,120) |