Work and Jobs in Chili, New York (NY) Detailed Stats
Occupations, Industries, Unemployment, Workers, Commute
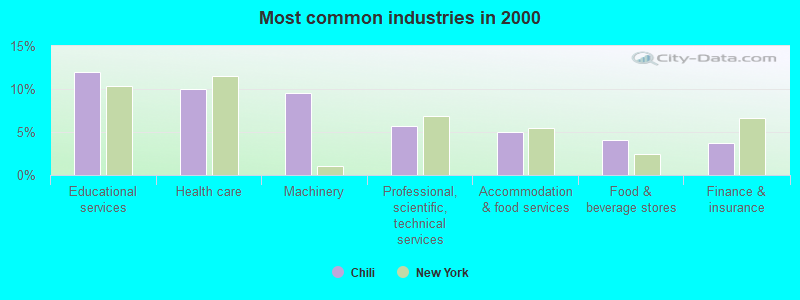
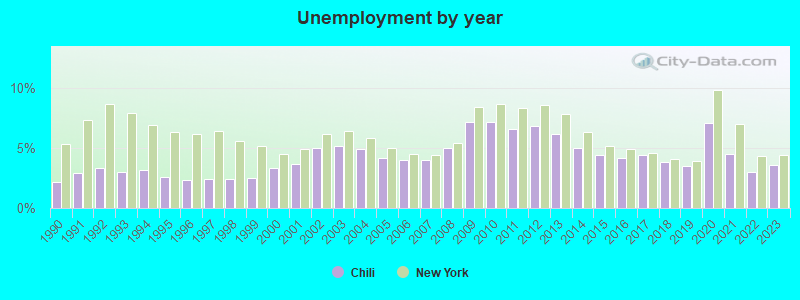
The unemployment rate in 2023 in Chili, NY was 3.6%, which was 22.2% less than the unemployment rate of 4.4% across the entire state of New York. Compared to the unemployment rate of 6.2% in 2013, this represents a decrease of 72.2%. The most common industries in Chili are: Educational services (11.9% of civilian employees), Health care (10.0% of civilian employees), Machinery (9.5% of civilian employees). 72.5% of workers are employees of private companies, which is 12.1% greater than the rate of 63.7% across the entire state of New York.
Most common industries
Most common industries | |||
|---|---|---|---|
Industry | All | Males | Females |
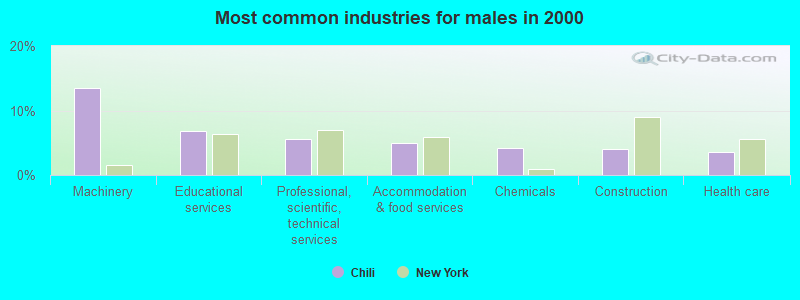
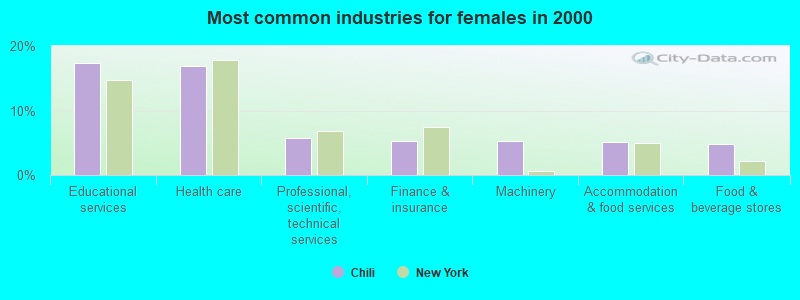
| Educational services | 11.9% (1,698) | 6.8% (502) | 17.4% (1,196) |
| Health care | 10.0% (1,424) | 3.6% (267) | 16.8% (1,157) |
| Machinery | 9.5% (1,354) | 13.5% (992) | 5.3% (362) |
| Professional, scientific, and technical services | 5.7% (808) | 5.7% (416) | 5.7% (392) |
| Accommodation and food services | 5.0% (716) | 4.9% (361) | 5.2% (355) |
| Food and beverage stores | 4.1% (581) | 3.4% (252) | 4.8% (329) |
| Finance and insurance | 3.7% (531) | 2.3% (168) | 5.3% (363) |
| Public administration | 3.0% (425) | 3.4% (248) | 2.6% (177) |
| Chemicals | 3.0% (420) | 4.2% (308) | 1.6% (112) |
| Construction | 2.7% (378) | 4.0% (296) | 1.2% (82) |
| Miscellaneous manufacturing | 2.5% (360) | 2.7% (198) | 2.4% (162) |
| Transportation equipment | 2.4% (339) | 3.5% (260) | 1.2% (79) |
| Administrative and support and waste management services | 2.4% (336) | 3.1% (226) | 1.6% (110) |
| Broadcasting and telecommunications | 1.9% (271) | 2.0% (147) | 1.8% (124) |
| Metal and metal products | 1.8% (261) | 3.0% (220) | 0.6% (41) |
| Personal and laundry services | 1.6% (225) | 0.7% (52) | 2.5% (173) |
| Real estate and rental and leasing | 1.5% (208) | 1.5% (111) | 1.4% (97) |
| Social assistance | 1.4% (199) | 0.2% (18) | 2.6% (181) |
| Computer and electronic products | 1.3% (182) | 1.7% (127) | 0.8% (55) |
| Printing and related support activities | 1.3% (179) | 1.9% (141) | 0.6% (38) |
| Arts, entertainment, and recreation | 1.2% (175) | 1.3% (93) | 1.2% (82) |
| Religious, grantmaking, civic, professional, and similar organizations | 1.2% (173) | 1.0% (72) | 1.5% (101) |
| Repair and maintenance | 1.2% (173) | 2.1% (155) | 0.3% (18) |
| Motor vehicle and parts dealers | 1.2% (168) | 2.0% (145) | 0.3% (23) |
| Building material and garden equipment and supplies dealers | 1.2% (164) | 1.8% (135) | 0.4% (29) |
| Truck transportation | 1.1% (163) | 1.8% (135) | 0.4% (28) |
| Department and other general merchandise stores | 1.1% (154) | 0.6% (46) | 1.6% (108) |
| Plastics and rubber products | 1.1% (150) | 1.0% (75) | 1.1% (75) |
| Other transportation, and support activities, and couriers | 0.8% (120) | 1.2% (90) | 0.4% (30) |
| Utilities | 0.8% (114) | 0.8% (62) | 0.8% (52) |
| Data processing, libraries, and other information services | 0.8% (111) | 0.2% (18) | 1.4% (93) |
| U. S. Postal service | 0.7% (96) | 0.9% (69) | 0.4% (27) |
| Publishing, and motion picture and sound recording industries | 0.7% (94) | 0.6% (47) | 0.7% (47) |
| Radio, TV, and computer stores | 0.7% (94) | 1.0% (72) | 0.3% (22) |
| Gasoline stations | 0.7% (93) | 0.9% (66) | 0.4% (27) |
| Pharmacies and drug stores | 0.6% (90) | 0.6% (47) | 0.6% (43) |
| Machinery, equipment, and supplies merchant wholesalers | 0.6% (89) | 0.9% (66) | 0.3% (23) |
| Groceries and related products merchant wholesalers | 0.6% (84) | 1.1% (84) | 0.0% (0) |
| Professional and commercial equipment and supplies merchant wholesalers | 0.5% (69) | 0.8% (57) | 0.2% (12) |
| Furniture and home furnishings, and household appliance stores | 0.4% (62) | 0.4% (28) | 0.5% (34) |
| Miscellaneous nondurable goods merchant wholesalers | 0.4% (53) | 0.5% (37) | 0.2% (16) |
| Sporting goods, camera, and hobby and toy stores | 0.4% (53) | 0.2% (16) | 0.5% (37) |
| Alcoholic beverages merchant wholesalers | 0.4% (53) | 0.7% (53) | 0.0% (0) |
| Electrical and electronic goods merchant wholesalers | 0.4% (53) | 0.6% (45) | 0.1% (8) |
| Private households | 0.3% (48) | 0.0% (0) | 0.7% (48) |
| Paper | 0.3% (46) | 0.5% (36) | 0.1% (10) |
| Clothing and accessories, including shoe, stores | 0.3% (45) | 0.2% (18) | 0.4% (27) |
| Other direct selling establishments | 0.3% (44) | 0.5% (37) | 0.1% (7) |
| Used merchandise, gift, novelty, and souvenir, and other miscellaneous stores | 0.3% (42) | 0.0% (0) | 0.6% (42) |
| Air transportation | 0.2% (35) | 0.3% (19) | 0.2% (16) |
| Electronic shopping and mail-order houses | 0.2% (33) | 0.1% (5) | 0.4% (28) |
| Food | 0.2% (29) | 0.2% (12) | 0.2% (17) |
| Health and personal care, except drug, stores | 0.2% (29) | 0.1% (10) | 0.3% (19) |
| Electrical equipment, appliances, and components | 0.2% (26) | 0.4% (26) | 0.0% (0) |
| Hardware, plumbing and heating equipment, and supplies merchant wholesalers | 0.2% (25) | 0.3% (25) | 0.0% (0) |
| Jewelry, luggage, and leather goods stores | 0.2% (24) | 0.0% (0) | 0.3% (24) |
| Motor vehicles, parts and supplies merchant wholesalers | 0.2% (23) | 0.2% (16) | 0.1% (7) |
| Music stores | 0.2% (22) | 0.1% (11) | 0.2% (11) |
| Book stores and news dealers | 0.1% (21) | 0.0% (0) | 0.3% (21) |
| Miscellaneous durable goods merchant wholesalers | 0.1% (21) | 0.1% (11) | 0.1% (10) |
| Paper and paper products merchant wholesalers | 0.1% (19) | 0.3% (19) | 0.0% (0) |
| Petroleum and petroleum products merchant wholesalers | 0.1% (19) | 0.2% (13) | 0.1% (6) |
| Nonmetallic mineral products | 0.1% (17) | 0.2% (17) | 0.0% (0) |
| Leather and allied products | 0.1% (16) | 0.0% (0) | 0.2% (16) |
| Office supplies and stationery stores | 0.1% (16) | 0.0% (0) | 0.2% (16) |
| Metals and minerals, except petroleum, merchant wholesalers | 0.1% (12) | 0.2% (12) | 0.0% (0) |
| Mining, quarrying, and oil and gas extraction | 0.1% (9) | 0.1% (9) | 0.0% (0) |
| Lumber and other construction materials merchant wholesalers | 0.1% (9) | 0.1% (9) | 0.0% (0) |
| Wood products | 0.1% (8) | 0.1% (8) | 0.0% (0) |
Unemployment in Chili
- Unemployment by race in 2000
- Unemployment rate for White non-Hispanic residents
- 5.6%Males
- 3.1%Females
- Unemployment rate for Black residents
- 12.4%Males
- 5.1%Females
- Unemployment rate for Asian residents
- 39.6%Males
- Unemployment rate for two or more race residents
- 3.4%Males
- 18.1%Females
- Unemployment rate for Hispanic or Latino residents
- 15.1%Males
Unemployment in 2023:
| Chili: | 3.6% |
| New York: | 4.4% |
Unemployment in 2022:
| Chili: | 3.0% |
| New York: | 4.3% |
Unemployment in 2021:
| Chili: | 4.5% |
| New York: | 7.0% |
Unemployment in 2020:
| Chili: | 7.1% |
| New York: | 9.8% |
Unemployment in 2019:
| Chili: | 3.5% |
| New York: | 3.9% |
Unemployment in 2018:
| Chili: | 3.8% |
| New York: | 4.1% |
Unemployment in 2017:
| Chili: | 4.4% |
| New York: | 4.6% |
Unemployment in 2016:
| Chili: | 4.2% |
| New York: | 4.9% |
Unemployment in 2015:
| Chili: | 4.4% |
| New York: | 5.2% |
Unemployment in 2014:
| Chili: | 5.0% |
| New York: | 6.3% |
Unemployment in 2013:
| Chili: | 6.2% |
| New York: | 7.8% |
Unemployment in 2012:
| Chili: | 6.8% |
| New York: | 8.6% |
Unemployment in 2011:
| Chili: | 6.6% |
| New York: | 8.3% |
Unemployment in 2010:
| Chili: | 7.2% |
| New York: | 8.7% |
Unemployment in 2009:
| Chili: | 7.2% |
| New York: | 8.4% |
Unemployment in 2008:
| Chili: | 5.0% |
| New York: | 5.4% |
Unemployment in 2007:
| Chili: | 4.0% |
| New York: | 4.4% |
Unemployment in 2006:
| Chili: | 4.0% |
| New York: | 4.5% |
Unemployment in 2005:
| Chili: | 4.2% |
| New York: | 5.0% |
Unemployment in 2004:
| Chili: | 4.9% |
| New York: | 5.8% |
Unemployment in 2003:
| Chili: | 5.2% |
| New York: | 6.4% |
Unemployment in 2002:
| Chili: | 5.0% |
| New York: | 6.2% |
Unemployment in 2001:
| Chili: | 3.7% |
| New York: | 4.9% |
Unemployment in 2000:
| Chili: | 3.3% |
| New York: | 4.5% |
Unemployment in 1999:
| Chili: | 2.5% |
| New York: | 5.2% |
Unemployment in 1998:
| Chili: | 2.4% |
| New York: | 5.6% |
Unemployment in 1997:
| Chili: | 2.4% |
| New York: | 6.4% |
Unemployment in 1996:
| Chili: | 2.3% |
| New York: | 6.2% |
Unemployment in 1995:
| Chili: | 2.6% |
| New York: | 6.3% |
Unemployment in 1994:
| Chili: | 3.2% |
| New York: | 6.9% |
Unemployment in 1993:
| Chili: | 3.0% |
| New York: | 7.9% |
Unemployment in 1992:
| Chili: | 3.3% |
| New York: | 8.7% |
Unemployment in 1991:
| Chili: | 2.9% |
| New York: | 7.3% |
Unemployment in 1990:
| Chili: | 2.2% |
| New York: | 5.3% |
Time leaving home to go to work

<5am:
| Chili: | 2.7% (383) |
| New York: | 2.4% (194,562) |
5:30am:
| Chili: | 1.5% (213) |
| New York: | 2.1% (174,328) |
6am:
| Chili: | 3.9% (542) |
| New York: | 3.1% (253,826) |
6:30am:
| Chili: | 7.6% (1,071) |
| New York: | 7.0% (573,349) |
7am:
| Chili: | 12.0% (1,675) |
| New York: | 8.6% (706,982) |
7:30am:
| Chili: | 14.4% (2,017) |
| New York: | 14.0% (1,147,579) |
8am:
| Chili: | 16.1% (2,249) |
| New York: | 14.8% (1,213,706) |
8:30am:
| Chili: | 12.5% (1,747) |
| New York: | 13.9% (1,144,298) |
9am:
| Chili: | 6.5% (910) |
| New York: | 7.5% (614,475) |
10am:
| Chili: | 5.1% (715) |
| New York: | 7.2% (593,377) |
11am:
| Chili: | 1.0% (146) |
| New York: | 2.7% (224,011) |
12pm:
| Chili: | 0.6% (88) |
| New York: | 1.3% (105,049) |
4pm:
| Chili: | 6.9% (967) |
| New York: | 6.3% (517,309) |
>4pm:
| Chili: | 7.4% (1,033) |
| New York: | 6.1% (501,196) |
Travel time to work


Less than 5 minutes:
| Chili: | 2.8% (388) |
| New York: | 2.7% (219,036) |
5 to 9 minutes:
| Chili: | 9.7% (1,363) |
| New York: | 8.3% (680,270) |
10 to 14 minutes:
| Chili: | 15.8% (2,220) |
| New York: | 11.6% (956,590) |
15 to 19 minutes:
| Chili: | 20.1% (2,813) |
| New York: | 12.4% (1,020,084) |
20 to 24 minutes:
| Chili: | 25.2% (3,526) |
| New York: | 12.3% (1,013,757) |
25 to 29 minutes:
| Chili: | 7.7% (1,073) |
| New York: | 4.9% (399,384) |
30 to 34 minutes:
| Chili: | 9.5% (1,333) |
| New York: | 12.9% (1,058,688) |
35 to 39 minutes:
| Chili: | 1.4% (191) |
| New York: | 2.5% (203,722) |
40 to 44 minutes:
| Chili: | 1.2% (169) |
| New York: | 4.1% (340,311) |
45 to 59 minutes:
| Chili: | 2.0% (287) |
| New York: | 9.8% (806,556) |
60 to 89 minutes:
| Chili: | 1.7% (237) |
| New York: | 10.3% (848,185) |
90 or more minutes:
| Chili: | 1.1% (156) |
| New York: | 5.1% (417,464) |
Means of transportation to work


Drove car alone:
| Chili: | 86.6% (12,128) |
| New York: | 56.3% (4,620,178) |
Carpooled:
| Chili: | 8.0% (1,123) |
| New York: | 9.2% (756,918) |
Bus or trolley bus:
| Chili: | 0.4% (59) |
| New York: | 5.8% (475,389) |
Subway or elevated:
| Chili: | 0.2% (27) |
| New York: | 14.8% (1,217,009) |
Ferryboat:
| Chili: | 0.0% (7) |
| New York: | 0.1% (11,626) |
Motorcycle:
| Chili: | 0.1% (16) |
| New York: | 0.0% (3,625) |
Bicycle:
| Chili: | 0.2% (34) |
| New York: | 0.3% (25,036) |
Walked:
| Chili: | 2.3% (317) |
| New York: | 6.2% (511,721) |
Other means:
| Chili: | 0.3% (45) |
| New York: | 0.5% (40,375) |
Private vehicle occupancy

Drove alone:
| Chili: | 91.5% (12,128) |
| New York: | 85.9% (4,620,178) |
In 2 person carpool:
| Chili: | 8.0% (1,058) |
| New York: | 11.0% (590,255) |
In 3 person carpool:
| Chili: | 0.4% (57) |
| New York: | 1.8% (96,470) |
In 4 person carpool:
| Chili: | 0.1% (8) |
| New York: | 0.7% (36,112) |
Class of workers
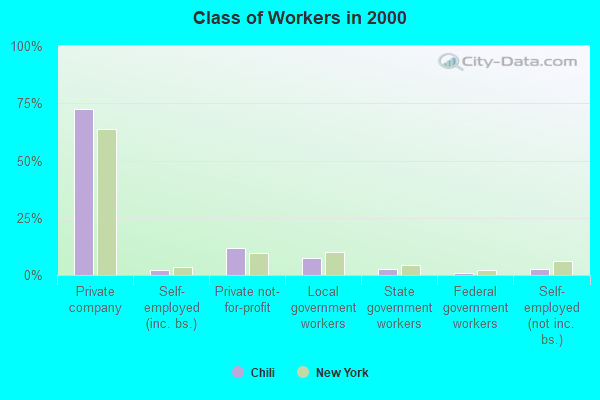
Employee of private company:
| Chili: | 72.5% (10,313) |
| New York: | 63.7% (5,340,134) |
Self-employed in own incorporated business:
| Chili: | 2.2% (318) |
| New York: | 3.4% (283,619) |
Private not-for-profit wage and salary workers:
| Chili: | 11.6% (1,647) |
| New York: | 9.7% (810,356) |
Local government workers:
| Chili: | 7.6% (1,086) |
| New York: | 10.2% (858,120) |
State government workers:
| Chili: | 2.4% (343) |
| New York: | 4.6% (383,673) |
Federal government workers:
| Chili: | 1.0% (143) |
| New York: | 2.2% (185,100) |
Self-employed workers in own not incorporated business:
| Chili: | 2.6% (369) |
| New York: | 6.0% (501,068) |
Unpaid family workers:
| Chili: | 0.0% (5) |
| New York: | 0.2% (20,918) |

Employee of private company - Males:
| Chili: | 79.7% (5,867) |
| New York: | 66.2% (2,902,064) |
Self-employed in own incorporated business - Males:
| Chili: | 3.2% (235) |
| New York: | 4.9% (215,651) |
Private not-for-profit wage and salary workers - Males:
| Chili: | 6.5% (478) |
| New York: | 6.3% (277,787) |
Local government workers - Males:
| Chili: | 5.3% (387) |
| New York: | 8.7% (380,426) |
State government workers - Males:
| Chili: | 1.2% (85) |
| New York: | 4.1% (181,784) |
Federal government workers - Males:
| Chili: | 1.3% (95) |
| New York: | 2.3% (102,647) |
Self-employed workers in own not incorporated business - Males:
| Chili: | 2.9% (210) |
| New York: | 7.1% (312,497) |

Employee of private company - Females:
| Chili: | 64.7% (4,446) |
| New York: | 60.9% (2,438,070) |
Self-employed in own incorporated business - Females:
| Chili: | 1.2% (83) |
| New York: | 1.7% (67,968) |
Private not-for-profit wage and salary workers - Females:
| Chili: | 17.0% (1,169) |
| New York: | 13.3% (532,569) |
Local government workers - Females:
| Chili: | 10.2% (699) |
| New York: | 11.9% (477,694) |
State government workers - Females:
| Chili: | 3.8% (258) |
| New York: | 5.0% (201,889) |
Federal government workers - Females:
| Chili: | 0.7% (48) |
| New York: | 2.1% (82,453) |
Self-employed workers in own not incorporated business - Females:
| Chili: | 2.3% (159) |
| New York: | 4.7% (188,571) |
Unpaid family workers - Females:
| Chili: | 0.1% (5) |
| New York: | 0.3% (11,448) |