Work and Jobs in Central Pencader, Delaware (DE) Detailed Stats
Occupations, Industries, Unemployment, Workers, Commute
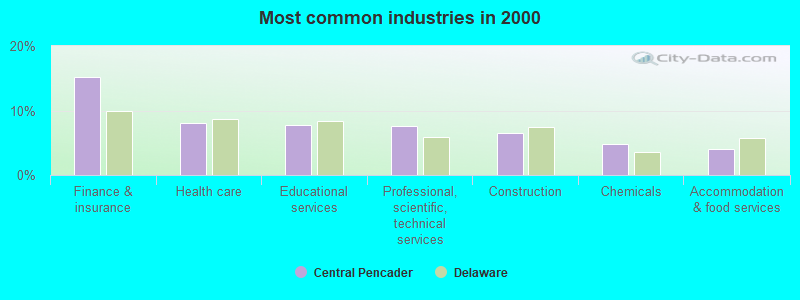
The most common industries in Central Pencader are: Finance & insurance (15.1% of civilian employees), Health care (8.0% of civilian employees), Educational services (7.7% of civilian employees). 76.9% of workers are employees of private companies, which is 8.5% greater than the rate of 70.4% across the entire state of Delaware.
Most common industries
Most common industries | |||
|---|---|---|---|
Industry | All | Males | Females |
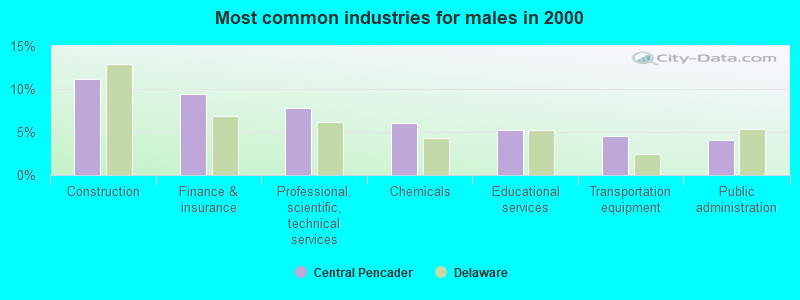
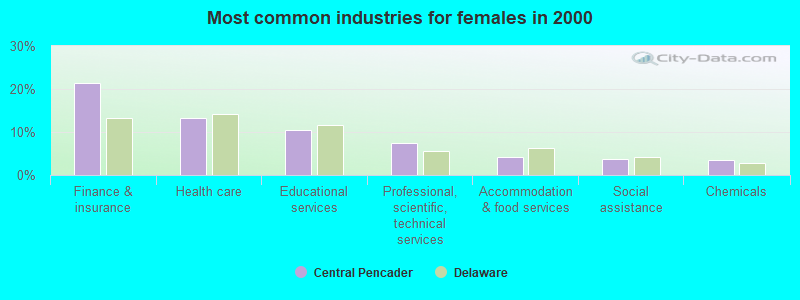
| Finance and insurance | 15.1% (2,639) | 9.4% (866) | 21.5% (1,773) |
| Health care | 8.0% (1,398) | 3.3% (299) | 13.3% (1,099) |
| Educational services | 7.7% (1,343) | 5.2% (482) | 10.4% (861) |
| Professional, scientific, and technical services | 7.7% (1,337) | 7.8% (714) | 7.6% (623) |
| Construction | 6.5% (1,141) | 11.2% (1,028) | 1.4% (113) |
| Chemicals | 4.8% (845) | 6.0% (551) | 3.6% (294) |
| Accommodation and food services | 4.0% (698) | 3.9% (354) | 4.2% (344) |
| Public administration | 3.3% (578) | 4.1% (372) | 2.5% (206) |
| Transportation equipment | 3.1% (540) | 4.5% (412) | 1.6% (128) |
| Administrative and support and waste management services | 2.9% (500) | 3.6% (328) | 2.1% (172) |
| Social assistance | 1.9% (331) | 0.3% (31) | 3.6% (300) |
| Miscellaneous manufacturing | 1.8% (307) | 1.4% (129) | 2.2% (178) |
| Food and beverage stores | 1.7% (294) | 1.4% (127) | 2.0% (167) |
| Arts, entertainment, and recreation | 1.6% (275) | 2.0% (186) | 1.1% (89) |
| Department and other general merchandise stores | 1.4% (251) | 1.2% (109) | 1.7% (142) |
| Religious, grantmaking, civic, professional, and similar organizations | 1.4% (246) | 1.2% (113) | 1.6% (133) |
| Broadcasting and telecommunications | 1.4% (245) | 1.8% (169) | 0.9% (76) |
| Utilities | 1.3% (229) | 2.0% (186) | 0.5% (43) |
| Truck transportation | 1.3% (218) | 1.8% (162) | 0.7% (56) |
| Repair and maintenance | 1.2% (210) | 2.3% (210) | 0.0% (0) |
| U. S. Postal service | 1.2% (201) | 1.5% (134) | 0.8% (67) |
| Motor vehicle and parts dealers | 1.2% (201) | 1.9% (172) | 0.4% (29) |
| Metal and metal products | 1.1% (196) | 1.8% (167) | 0.4% (29) |
| Personal and laundry services | 1.0% (171) | 0.2% (16) | 1.9% (155) |
| Other transportation, and support activities, and couriers | 0.9% (161) | 1.2% (110) | 0.6% (51) |
| Pharmacies and drug stores | 0.9% (153) | 0.6% (51) | 1.2% (102) |
| Building material and garden equipment and supplies dealers | 0.8% (144) | 1.2% (111) | 0.4% (33) |
| Machinery | 0.8% (142) | 1.2% (113) | 0.4% (29) |
| Professional and commercial equipment and supplies merchant wholesalers | 0.8% (139) | 1.1% (98) | 0.5% (41) |
| Petroleum and coal products | 0.7% (127) | 1.3% (116) | 0.1% (11) |
| Computer and electronic products | 0.7% (124) | 0.9% (85) | 0.5% (39) |
| Real estate and rental and leasing | 0.7% (120) | 0.1% (8) | 1.4% (112) |
| Plastics and rubber products | 0.7% (119) | 1.0% (96) | 0.3% (23) |
| Clothing and accessories, including shoe, stores | 0.6% (96) | 0.0% (0) | 1.2% (96) |
| Rail transportation | 0.5% (95) | 0.9% (86) | 0.1% (9) |
| Printing and related support activities | 0.5% (88) | 0.8% (72) | 0.2% (16) |
| Other direct selling establishments | 0.5% (85) | 0.6% (56) | 0.4% (29) |
| Data processing, libraries, and other information services | 0.5% (80) | 0.7% (62) | 0.2% (18) |
| Used merchandise, gift, novelty, and souvenir, and other miscellaneous stores | 0.4% (74) | 0.2% (17) | 0.7% (57) |
| Electronic shopping and mail-order houses | 0.4% (72) | 0.1% (13) | 0.7% (59) |
| Furniture and home furnishings, and household appliance stores | 0.4% (68) | 0.3% (25) | 0.5% (43) |
| Alcoholic beverages merchant wholesalers | 0.4% (67) | 0.4% (39) | 0.3% (28) |
| Radio, TV, and computer stores | 0.3% (57) | 0.3% (25) | 0.4% (32) |
| Health and personal care, except drug, stores | 0.3% (54) | 0.1% (9) | 0.5% (45) |
| Food | 0.3% (53) | 0.3% (29) | 0.3% (24) |
| Air transportation | 0.3% (53) | 0.5% (46) | 0.1% (7) |
| Machinery, equipment, and supplies merchant wholesalers | 0.3% (47) | 0.5% (47) | 0.0% (0) |
| Miscellaneous nondurable goods merchant wholesalers | 0.3% (44) | 0.4% (34) | 0.1% (10) |
| Drugs, sundries, and chemical and allied products merchant wholesalers | 0.2% (43) | 0.2% (20) | 0.3% (23) |
| Groceries and related products merchant wholesalers | 0.2% (42) | 0.3% (28) | 0.2% (14) |
| Music stores | 0.2% (42) | 0.3% (32) | 0.1% (10) |
| Agriculture, forestry, fishing and hunting | 0.2% (38) | 0.3% (31) | 0.1% (7) |
| Furniture and home furnishing merchant wholesalers | 0.2% (35) | 0.3% (27) | 0.1% (8) |
| Publishing, and motion picture and sound recording industries | 0.2% (35) | 0.4% (35) | 0.0% (0) |
| Vending machine operators | 0.2% (34) | 0.3% (23) | 0.1% (11) |
| Textile mills and textile products | 0.2% (34) | 0.2% (19) | 0.2% (15) |
| Paper | 0.2% (32) | 0.3% (23) | 0.1% (9) |
| Motor vehicles, parts and supplies merchant wholesalers | 0.2% (31) | 0.2% (19) | 0.1% (12) |
| Hardware, plumbing and heating equipment, and supplies merchant wholesalers | 0.2% (31) | 0.2% (22) | 0.1% (9) |
| Private households | 0.2% (31) | 0.0% (0) | 0.4% (31) |
| Electrical and electronic goods merchant wholesalers | 0.2% (30) | 0.3% (30) | 0.0% (0) |
| Lumber and other construction materials merchant wholesalers | 0.2% (30) | 0.3% (30) | 0.0% (0) |
| Sporting goods, camera, and hobby and toy stores | 0.2% (27) | 0.1% (12) | 0.2% (15) |
| Nonmetallic mineral products | 0.2% (27) | 0.2% (14) | 0.2% (13) |
| Retail florists | 0.1% (24) | 0.0% (0) | 0.3% (24) |
| Gasoline stations | 0.1% (23) | 0.2% (17) | 0.1% (6) |
| Miscellaneous durable goods merchant wholesalers | 0.1% (23) | 0.3% (23) | 0.0% (0) |
| Warehousing and storage | 0.1% (22) | 0.2% (22) | 0.0% (0) |
| Furniture and related product manufacturing | 0.1% (19) | 0.1% (12) | 0.1% (7) |
| Wood products | 0.1% (18) | 0.2% (18) | 0.0% (0) |
| Metals and minerals, except petroleum, merchant wholesalers | 0.1% (18) | 0.1% (9) | 0.1% (9) |
| Beverage and tobacco products | 0.1% (17) | 0.2% (17) | 0.0% (0) |
| Fuel dealers | 0.1% (10) | 0.1% (10) | 0.0% (0) |
Unemployment in Central Pencader
- Unemployment by race in 2000
- Unemployment rate for White non-Hispanic residents
- 3.3%Males
- 2.5%Females
- Unemployment rate for Black residents
- 4.8%Males
- 6.7%Females
- Unemployment rate for Asian residents
- 4.9%Males
- 3.2%Females
- Unemployment rate for other race residents
- 15.6%Males
- Unemployment rate for Hispanic or Latino residents
- 5.8%Males
Time leaving home to go to work

<5am:
| Central Pencader: | 2.6% (449) |
| Delaware: | 2.8% (10,365) |
5:30am:
| Central Pencader: | 2.8% (488) |
| Delaware: | 2.2% (8,081) |
6am:
| Central Pencader: | 3.9% (671) |
| Delaware: | 3.5% (13,243) |
6:30am:
| Central Pencader: | 8.6% (1,478) |
| Delaware: | 7.7% (28,805) |
7am:
| Central Pencader: | 15.0% (2,581) |
| Delaware: | 11.4% (42,698) |
7:30am:
| Central Pencader: | 20.0% (3,449) |
| Delaware: | 16.6% (61,926) |
8am:
| Central Pencader: | 12.7% (2,189) |
| Delaware: | 16.2% (60,395) |
8:30am:
| Central Pencader: | 9.2% (1,593) |
| Delaware: | 10.6% (39,554) |
9am:
| Central Pencader: | 5.4% (931) |
| Delaware: | 5.0% (18,691) |
10am:
| Central Pencader: | 3.3% (567) |
| Delaware: | 4.7% (17,404) |
11am:
| Central Pencader: | 1.9% (322) |
| Delaware: | 2.0% (7,556) |
12pm:
| Central Pencader: | 0.7% (118) |
| Delaware: | 1.0% (3,667) |
4pm:
| Central Pencader: | 6.6% (1,133) |
| Delaware: | 6.9% (25,586) |
>4pm:
| Central Pencader: | 5.9% (1,015) |
| Delaware: | 6.4% (24,008) |
Travel time to work


Less than 5 minutes:
| Central Pencader: | 1.0% (172) |
| Delaware: | 2.6% (9,817) |
5 to 9 minutes:
| Central Pencader: | 4.7% (817) |
| Delaware: | 9.9% (37,056) |
10 to 14 minutes:
| Central Pencader: | 10.5% (1,808) |
| Delaware: | 15.2% (56,533) |
15 to 19 minutes:
| Central Pencader: | 16.2% (2,785) |
| Delaware: | 17.5% (65,194) |
20 to 24 minutes:
| Central Pencader: | 19.0% (3,281) |
| Delaware: | 16.5% (61,600) |
25 to 29 minutes:
| Central Pencader: | 9.3% (1,604) |
| Delaware: | 6.7% (25,011) |
30 to 34 minutes:
| Central Pencader: | 15.1% (2,601) |
| Delaware: | 12.0% (44,932) |
35 to 39 minutes:
| Central Pencader: | 3.8% (657) |
| Delaware: | 2.3% (8,671) |
40 to 44 minutes:
| Central Pencader: | 4.1% (708) |
| Delaware: | 2.6% (9,805) |
45 to 59 minutes:
| Central Pencader: | 7.5% (1,291) |
| Delaware: | 5.6% (20,867) |
60 to 89 minutes:
| Central Pencader: | 5.3% (912) |
| Delaware: | 3.8% (14,200) |
90 or more minutes:
| Central Pencader: | 2.0% (348) |
| Delaware: | 2.2% (8,293) |
Means of transportation to work

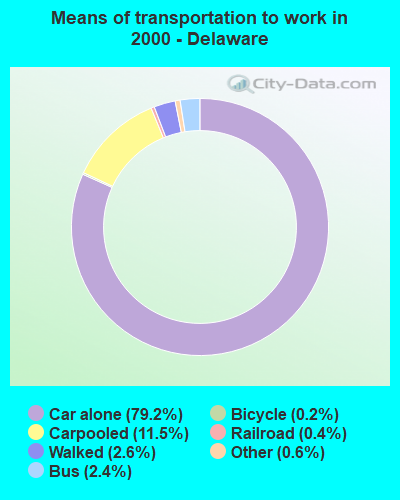
Drove car alone:
| Central Pencader: | 85.4% (14,703) |
| Delaware: | 79.2% (295,413) |
Carpooled:
| Central Pencader: | 10.9% (1,886) |
| Delaware: | 11.5% (42,990) |
Bus or trolley bus:
| Central Pencader: | 0.9% (148) |
| Delaware: | 2.4% (8,770) |
Railroad:
| Central Pencader: | 0.3% (50) |
| Delaware: | 0.4% (1,361) |
Motorcycle:
| Central Pencader: | 0.1% (17) |
| Delaware: | 0.1% (359) |
Bicycle:
| Central Pencader: | 0.0% (5) |
| Delaware: | 0.2% (851) |
Walked:
| Central Pencader: | 0.7% (112) |
| Delaware: | 2.6% (9,637) |
Other means:
| Central Pencader: | 0.4% (63) |
| Delaware: | 0.6% (2,375) |
Private vehicle occupancy

Drove alone:
| Central Pencader: | 88.6% (14,703) |
| Delaware: | 87.3% (295,413) |
In 2 person carpool:
| Central Pencader: | 9.2% (1,523) |
| Delaware: | 10.1% (34,179) |
In 3 person carpool:
| Central Pencader: | 1.7% (275) |
| Delaware: | 1.6% (5,574) |
In 4 person carpool:
| Central Pencader: | 0.3% (54) |
| Delaware: | 0.5% (1,816) |
In 5-6 person carpool:
| Central Pencader: | 0.0% (5) |
| Delaware: | 0.3% (852) |
In 7+ person carpool:
| Central Pencader: | 0.2% (29) |
| Delaware: | 0.2% (569) |
Class of workers
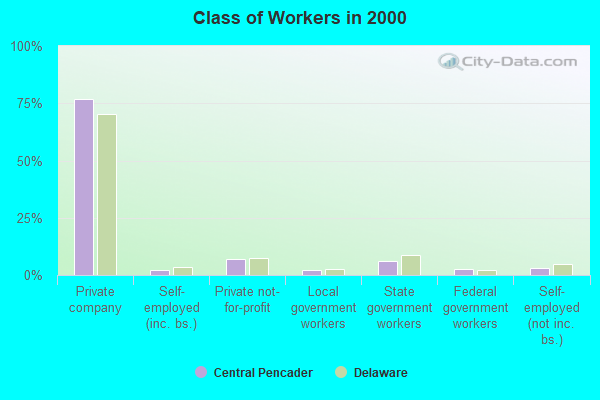
Employee of private company:
| Central Pencader: | 76.9% (13,411) |
| Delaware: | 70.4% (265,154) |
Self-employed in own incorporated business:
| Central Pencader: | 2.1% (360) |
| Delaware: | 3.3% (12,474) |
Private not-for-profit wage and salary workers:
| Central Pencader: | 6.9% (1,198) |
| Delaware: | 7.4% (27,793) |
Local government workers:
| Central Pencader: | 2.0% (347) |
| Delaware: | 2.8% (10,645) |
State government workers:
| Central Pencader: | 6.2% (1,085) |
| Delaware: | 8.8% (33,093) |
Federal government workers:
| Central Pencader: | 2.8% (484) |
| Delaware: | 2.2% (8,305) |
Self-employed workers in own not incorporated business:
| Central Pencader: | 3.1% (532) |
| Delaware: | 5.0% (18,686) |
Unpaid family workers:
| Central Pencader: | 0.1% (16) |
| Delaware: | 0.2% (661) |

Employee of private company - Males:
| Central Pencader: | 78.9% (7,247) |
| Delaware: | 73.1% (142,469) |
Self-employed in own incorporated business - Males:
| Central Pencader: | 2.8% (260) |
| Delaware: | 4.7% (9,084) |
Private not-for-profit wage and salary workers - Males:
| Central Pencader: | 5.2% (479) |
| Delaware: | 4.5% (8,848) |
Local government workers - Males:
| Central Pencader: | 1.5% (141) |
| Delaware: | 2.7% (5,166) |
State government workers - Males:
| Central Pencader: | 4.7% (429) |
| Delaware: | 6.5% (12,625) |
Federal government workers - Males:
| Central Pencader: | 3.4% (313) |
| Delaware: | 2.5% (4,955) |
Self-employed workers in own not incorporated business - Males:
| Central Pencader: | 3.4% (310) |
| Delaware: | 5.8% (11,349) |
Unpaid family workers - Males:
| Central Pencader: | 0.1% (5) |
| Delaware: | 0.1% (292) |

Employee of private company - Females:
| Central Pencader: | 74.7% (6,164) |
| Delaware: | 67.4% (122,685) |
Self-employed in own incorporated business - Females:
| Central Pencader: | 1.2% (100) |
| Delaware: | 1.9% (3,390) |
Private not-for-profit wage and salary workers - Females:
| Central Pencader: | 8.7% (719) |
| Delaware: | 10.4% (18,945) |
Local government workers - Females:
| Central Pencader: | 2.5% (206) |
| Delaware: | 3.0% (5,479) |
State government workers - Females:
| Central Pencader: | 8.0% (656) |
| Delaware: | 11.2% (20,468) |
Federal government workers - Females:
| Central Pencader: | 2.1% (171) |
| Delaware: | 1.8% (3,350) |
Self-employed workers in own not incorporated business - Females:
| Central Pencader: | 2.7% (222) |
| Delaware: | 4.0% (7,337) |
Unpaid family workers - Females:
| Central Pencader: | 0.1% (11) |
| Delaware: | 0.2% (369) |