Work and Jobs in Atlanta, Georgia (GA) Detailed Stats
Occupations, Industries, Unemployment, Workers, Commute
Settings
X


Recent posts about work in Atlanta, Georgia on our local forum with over 2,400,000 registered users:

Latest news about work in Atlanta, GA collected exclusively by city-data.com from local newspapers, TV, and radio stations
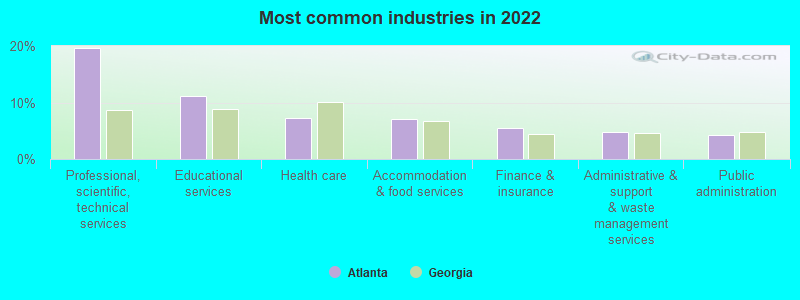
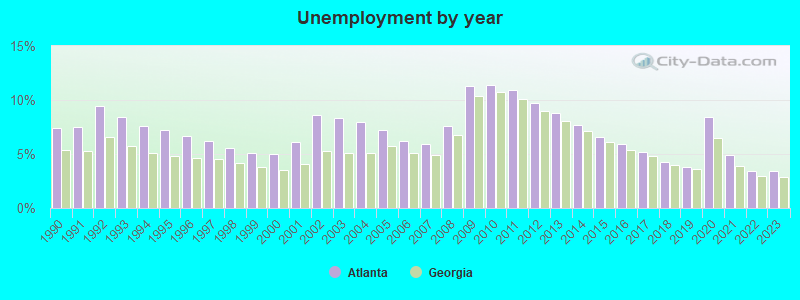
The unemployment rate in 2023 in Atlanta, GA was 3.4%, which was 14.7% greater than the unemployment rate of 2.9% across the entire state of Georgia. Compared to the unemployment rate of 8.8% in 2013, this represents a decrease of 158.8%. According to 2022 data, the most common industries in Atlanta are: Professional, scientific, technical services (19.6% of civilian employees), Educational services (11.2% of civilian employees), Health care (7.2% of civilian employees). 76.4% of workers work in Fulton County and 29.8% of all workers work at home. 67.3% of workers are employees of private companies, which is about the same as the rate of 68.6% across the entire state of Georgia.
Whole page based on the data from 2000 / 2022 when the population of Atlanta, Georgia was 416,474 / 499,121
Whole page based on the data from 2000 / 2022 when the population of Atlanta, Georgia was 416,474 / 499,121
Most common industries


Most common industries | Most common industries | |||||
|---|---|---|---|---|---|---|
Industry | All | Males | Females | All | Males | Females |
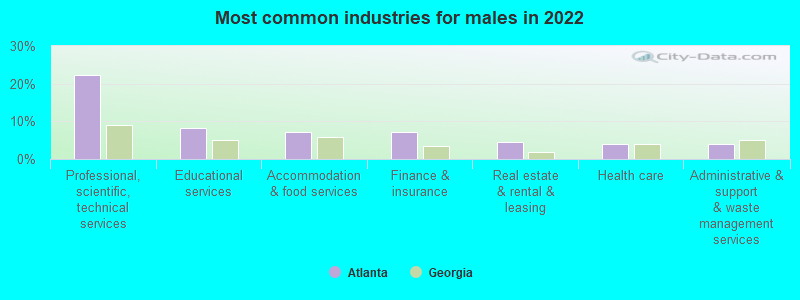
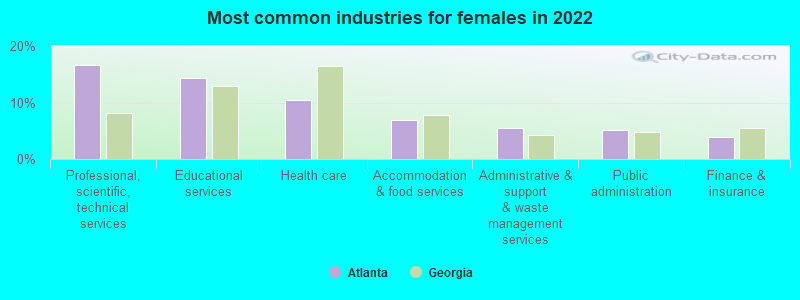
| Professional, scientific, and technical services | 19.6% (51,423) | 22.4% (29,807) | 16.7% (21,616) | 11.7% (21,405) | 13.0% (12,593) | 10.3% (8,812) |
| Educational services | 11.2% (29,357) | 8.2% (10,864) | 14.3% (18,493) | 8.1% (14,905) | 5.5% (5,362) | 11.1% (9,543) |
| Health care | 7.2% (18,850) | 4.1% (5,443) | 10.4% (13,407) | 6.9% (12,597) | 4.0% (3,890) | 10.2% (8,707) |
| Accommodation and food services | 7.1% (18,546) | 7.3% (9,677) | 6.9% (8,869) | 8.5% (15,567) | 8.1% (7,892) | 9.0% (7,675) |
| Finance and insurance | 5.5% (14,535) | 7.1% (9,446) | 3.9% (5,089) | 5.2% (9,429) | 5.1% (4,933) | 5.2% (4,496) |
| Administrative and support and waste management services | 4.7% (12,355) | 4.0% (5,308) | 5.4% (7,047) | 5.4% (9,818) | 5.5% (5,340) | 5.2% (4,478) |
| Public administration | 4.2% (10,915) | 3.3% (4,377) | 5.1% (6,538) | 4.9% (8,914) | 3.6% (3,504) | 6.3% (5,410) |
| Real estate and rental and leasing | 3.7% (9,606) | 4.6% (6,074) | 2.7% (3,532) | 3.2% (5,899) | 3.6% (3,514) | 2.8% (2,385) |
| Arts, entertainment, and recreation | 2.7% (7,181) | 3.1% (4,090) | 2.4% (3,091) | 1.9% (3,450) | 1.8% (1,716) | 2.0% (1,734) |
| Broadcasting and telecommunications | 2.4% (6,358) | 2.0% (2,628) | 2.9% (3,730) | 3.2% (5,878) | 3.3% (3,239) | 3.1% (2,639) |
| Construction | 2.3% (6,043) | 3.9% (5,158) | 0.7% (885) | 5.2% (9,551) | 8.9% (8,697) | 1.0% (854) |
| Air transportation | 2.2% (5,716) | 2.2% (2,916) | 2.2% (2,800) | 1.6% (2,846) | 1.6% (1,514) | 1.6% (1,332) |
| Other transportation, and support activities, and couriers | 2.2% (5,715) | 1.6% (2,136) | 2.8% (3,579) | 1.8% (3,257) | 2.3% (2,194) | 1.2% (1,063) |
| Religious, grantmaking, civic, professional, and similar organizations | 1.7% (4,386) | 1.5% (1,938) | 1.9% (2,448) | 1.8% (3,242) | 1.4% (1,368) | 2.2% (1,874) |
| Building material and garden equipment and supplies dealers | 1.7% (4,368) | 2.0% (2,683) | 1.3% (1,685) | 0.7% (1,285) | 0.9% (829) | 0.5% (456) |
| Social assistance | 1.7% (4,348) | 0.3% (380) | 3.1% (3,968) | 1.8% (3,252) | 0.5% (527) | 3.2% (2,725) |
| Publishing, and motion picture and sound recording industries | 1.1% (2,958) | 1.6% (2,069) | 0.7% (889) | 1.3% (2,374) | 1.3% (1,303) | 1.2% (1,071) |
| Miscellaneous manufacturing | 1.0% (2,582) | 1.6% (2,118) | 0.4% (464) | 0.8% (1,460) | 0.9% (872) | 0.7% (588) |
| Food and beverage stores | 1.0% (2,500) | 0.6% (778) | 1.3% (1,722) | 1.6% (2,916) | 1.4% (1,381) | 1.8% (1,535) |
| Utilities | 0.8% (2,083) | 1.3% (1,718) | 0.3% (365) | 0.5% (906) | 0.6% (596) | 0.4% (310) |
| Truck transportation | 0.8% (2,001) | 1.5% (2,001) | 0.0% (0) | 0.9% (1,625) | 1.5% (1,455) | 0.2% (170) |
| Other direct selling establishments | 0.7% (1,804) | 0.7% (953) | 0.7% (851) | 0.5% (946) | 0.5% (474) | 0.6% (472) |
| Electronic shopping and mail-order houses | 0.7% (1,790) | 0.4% (472) | 1.0% (1,318) | 0.3% (504) | 0.2% (243) | 0.3% (261) |
| Clothing and accessories, including shoe, stores | 0.7% (1,782) | 0.4% (566) | 0.9% (1,216) | 0.8% (1,413) | 0.4% (397) | 1.2% (1,016) |
| Department and other general merchandise stores | 0.6% (1,692) | 0.8% (1,110) | 0.4% (582) | 1.5% (2,806) | 1.0% (951) | 2.2% (1,855) |
| Rail transportation | 0.6% (1,678) | 0.9% (1,191) | 0.4% (487) | 0.2% (302) | 0.2% (224) | 0.1% (78) |
| Repair and maintenance | 0.6% (1,643) | 1.0% (1,383) | 0.2% (260) | 0.9% (1,616) | 1.4% (1,399) | 0.3% (217) |
| Pharmacies and drug stores | 0.6% (1,561) | 0.5% (671) | 0.7% (890) | 0.3% (493) | 0.3% (245) | 0.3% (248) |
| Food | 0.6% (1,513) | 0.4% (573) | 0.7% (940) | 0.8% (1,495) | 0.8% (808) | 0.8% (687) |
| Beverage and tobacco products | 0.6% (1,486) | 0.7% (993) | 0.4% (493) | 0.6% (1,017) | 0.6% (558) | 0.5% (459) |
| Health and personal care, except drug, stores | 0.6% (1,466) | 0.2% (247) | 0.9% (1,219) | 0.1% (185) | 0.1% (57) | 0.1% (128) |
| Personal and laundry services | 0.6% (1,465) | 0.6% (808) | 0.5% (657) | 1.5% (2,704) | 1.3% (1,272) | 1.7% (1,432) |
| Chemicals | 0.5% (1,416) | 0.8% (1,030) | 0.3% (386) | 0.5% (939) | 0.6% (627) | 0.4% (312) |
| Warehousing and storage | 0.5% (1,382) | 0.7% (886) | 0.4% (496) | 0.5% (824) | 0.5% (490) | 0.4% (334) |
| Transportation equipment | 0.5% (1,377) | 0.5% (731) | 0.5% (646) | 0.6% (1,138) | 0.9% (847) | 0.3% (291) |
| Paper | 0.5% (1,368) | 0.5% (722) | 0.5% (646) | 0.4% (760) | 0.5% (449) | 0.4% (311) |
| Machinery | 0.5% (1,338) | 0.6% (806) | 0.4% (532) | 0.3% (486) | 0.4% (380) | 0.1% (106) |
| Furniture and home furnishings, and household appliance stores | 0.5% (1,206) | 0.2% (302) | 0.7% (904) | 0.5% (880) | 0.5% (492) | 0.5% (388) |
| Motor vehicle and parts dealers | 0.4% (948) | 0.4% (473) | 0.4% (475) | 0.6% (1,068) | 0.9% (907) | 0.2% (161) |
| Groceries and related products merchant wholesalers | 0.3% (901) | 0.4% (540) | 0.3% (361) | 0.5% (964) | 0.6% (619) | 0.4% (345) |
| Machinery, equipment, and supplies merchant wholesalers | 0.3% (823) | 0.6% (768) | 0.0% (55) | 0.2% (342) | 0.3% (282) | 0.1% (60) |
| Plastics and rubber products | 0.3% (781) | 0.2% (329) | 0.3% (452) | 0.2% (414) | 0.3% (291) | 0.1% (123) |
| Used merchandise, gift, novelty, and souvenir, and other miscellaneous stores | 0.3% (758) | 0.3% (401) | 0.3% (357) | 0.6% (1,145) | 0.6% (546) | 0.7% (599) |
| Electrical equipment, appliances, and components | 0.3% (737) | 0.1% (163) | 0.4% (574) | 0.2% (422) | 0.3% (263) | 0.2% (159) |
| Jewelry, luggage, and leather goods stores | 0.3% (722) | 0.4% (519) | 0.2% (203) | 0.1% (216) | 0.0% (41) | 0.2% (175) |
| Private households | 0.3% (688) | 0.0% (0) | 0.5% (688) | 0.6% (1,121) | 0.1% (81) | 1.2% (1,040) |
| Radio, TV, and computer stores | 0.2% (580) | 0.2% (226) | 0.3% (354) | 0.7% (1,222) | 0.8% (773) | 0.5% (449) |
| Printing and related support activities | 0.2% (432) | 0.1% (192) | 0.2% (240) | 0.6% (1,172) | 0.8% (787) | 0.4% (385) |
| Agriculture, forestry, fishing and hunting | 0.2% (423) | 0.2% (243) | 0.1% (180) | 0.3% (617) | 0.5% (501) | 0.1% (116) |
| Metal and metal products | 0.2% (400) | 0.2% (314) | 0.1% (86) | 0.5% (879) | 0.6% (622) | 0.3% (257) |
| Management of companies and enterprises | 0.2% (399) | 0.2% (236) | 0.1% (163) | 0.1% (183) | 0.1% (109) | 0.1% (74) |
| Furniture and related product manufacturing | 0.2% (394) | 0.2% (202) | 0.1% (192) | 0.3% (570) | 0.4% (358) | 0.2% (212) |
| Lumber and other construction materials merchant wholesalers | 0.1% (382) | 0.3% (352) | 0.0% (30) | 0.1% (168) | 0.1% (133) | 0.0% (35) |
| Gasoline stations | 0.1% (373) | 0.1% (153) | 0.2% (220) | 0.2% (400) | 0.2% (223) | 0.2% (177) |
| Miscellaneous nondurable goods merchant wholesalers | 0.1% (349) | 0.1% (141) | 0.2% (208) | 0.5% (846) | 0.5% (472) | 0.4% (374) |
| Professional and commercial equipment and supplies merchant wholesalers | 0.1% (345) | 0.1% (95) | 0.2% (250) | 0.3% (541) | 0.4% (413) | 0.1% (128) |
| U. S. Postal service | 0.1% (334) | 0.1% (161) | 0.1% (173) | 0.6% (1,106) | 0.6% (613) | 0.6% (493) |
| Computer and electronic products | 0.1% (321) | 0.1% (93) | 0.2% (228) | 0.6% (1,107) | 0.7% (700) | 0.5% (407) |
| Wood products | 0.1% (311) | 0.2% (209) | 0.1% (102) | 0.2% (437) | 0.4% (346) | 0.1% (91) |
| Sporting goods, camera, and hobby and toy stores | 0.1% (295) | 0.2% (295) | 0.0% (0) | 0.3% (497) | 0.3% (295) | 0.2% (202) |
| Drugs, sundries, and chemical and allied products merchant wholesalers | 0.1% (285) | 0.1% (193) | 0.1% (92) | 0.2% (284) | 0.2% (147) | 0.2% (137) |
| Furniture and home furnishing merchant wholesalers | 0.1% (255) | 0.2% (255) | 0.0% (0) | 0.2% (308) | 0.2% (210) | 0.1% (98) |
| Mining, quarrying, and oil and gas extraction | 0.1% (253) | 0.2% (253) | 0.0% (0) | 0.0% (57) | 0.0% (39) | 0.0% (18) |
| Electrical and electronic goods merchant wholesalers | 0.1% (232) | 0.1% (107) | 0.1% (125) | 0.3% (464) | 0.3% (318) | 0.2% (146) |
| Recyclable material merchant wholesalers | 0.1% (218) | 0.2% (218) | 0.0% (0) | 0.1% (191) | 0.1% (141) | 0.1% (50) |
| Nonmetallic mineral products | 0.1% (208) | 0.1% (78) | 0.1% (130) | 0.3% (488) | 0.4% (398) | 0.1% (90) |
| Alcoholic beverages merchant wholesalers | 0.1% (185) | 0.0% (39) | 0.1% (146) | 0.1% (260) | 0.2% (231) | 0.0% (29) |
| Miscellaneous durable goods merchant wholesalers | 0.1% (179) | 0.1% (179) | 0.0% (0) | 0.3% (492) | 0.3% (271) | 0.3% (221) |
| Data processing, libraries, and other information services | 0.1% (141) | 0.1% (141) | 0.0% (0) | 1.2% (2,224) | 1.5% (1,428) | 0.9% (796) |
| Textile mills and textile products | 0.0% (126) | 0.0% (0) | 0.1% (126) | 0.3% (602) | 0.4% (427) | 0.2% (175) |
| Motor vehicles, parts and supplies merchant wholesalers | 0.0% (112) | 0.1% (112) | 0.0% (0) | 0.2% (284) | 0.2% (189) | 0.1% (95) |
| Book stores and news dealers | 0.0% (84) | 0.0% (36) | 0.0% (48) | 0.1% (274) | 0.2% (149) | 0.1% (125) |
| Apparel | 0.0% (36) | 0.0% (0) | 0.0% (36) | 0.3% (566) | 0.1% (137) | 0.5% (429) |
| Paper and paper products merchant wholesalers | 0.0% (0) | 0.0% (0) | 0.0% (0) | 0.1% (249) | 0.2% (170) | 0.1% (79) |
| Office supplies and stationery stores | 0.0% (0) | 0.0% (0) | 0.0% (0) | 0.2% (289) | 0.1% (128) | 0.2% (161) |
| Metals and minerals, except petroleum, merchant wholesalers | 0.0% (0) | 0.0% (0) | 0.0% (0) | 0.1% (185) | 0.2% (153) | 0.0% (32) |
| Music stores | 0.0% (0) | 0.0% (0) | 0.0% (0) | 0.2% (284) | 0.2% (220) | 0.1% (64) |
| Apparel, fabrics, and notions merchant wholesalers | 0.0% (0) | 0.0% (0) | 0.0% (0) | 0.1% (233) | 0.1% (107) | 0.1% (126) |
Unemployment in Atlanta
- Unemployment by race in 2022
- Unemployment rate for White non-Hispanic residents
- 2.0%Males
- 2.3%Females
- Unemployment rate for Black residents
- 7.7%Males
- 8.5%Females
- Unemployment rate for American Indian and Alaska Native residents
- 2.5%Females
- Unemployment rate for Asian residents
- 0.6%Males
- 1.4%Females
- Unemployment rate for other race residents
- 4.9%Males
- 6.9%Females
- Unemployment rate for two or more race residents
- 4.7%Males
- 3.9%Females
- Unemployment rate for Hispanic or Latino residents
- 7.9%Males
- 4.5%Females
- Unemployment by race in 2000
- Unemployment rate for White non-Hispanic residents
- 10.3%Males
- 9.4%Females
- Unemployment rate for Black residents
- 17.7%Males
- 16.1%Females
- Unemployment rate for American Indian and Alaska Native residents
- 27.2%Males
- 9.9%Females
- Unemployment rate for Asian residents
- 35.2%Males
- 27.3%Females
- Unemployment rate for other race residents
- 10.3%Males
- 9.1%Females
- Unemployment rate for two or more race residents
- 13.3%Males
- 7.9%Females
- Unemployment rate for Hispanic or Latino residents
- 10.2%Males
- 10.5%Females
Unemployment in 2023:
| Atlanta: | 3.4% |
| Georgia: | 2.9% |
Unemployment in 2022:
| Atlanta: | 3.4% |
| Georgia: | 3.0% |
Unemployment in 2021:
| Atlanta: | 4.9% |
| Georgia: | 3.9% |
Unemployment in 2020:
| Atlanta: | 8.4% |
| Georgia: | 6.5% |
Unemployment in 2019:
| Atlanta: | 3.8% |
| Georgia: | 3.6% |
Unemployment in 2018:
| Atlanta: | 4.3% |
| Georgia: | 4.0% |
Unemployment in 2017:
| Atlanta: | 5.2% |
| Georgia: | 4.8% |
Unemployment in 2016:
| Atlanta: | 5.9% |
| Georgia: | 5.4% |
Unemployment in 2015:
| Atlanta: | 6.6% |
| Georgia: | 6.1% |
Unemployment in 2014:
| Atlanta: | 7.7% |
| Georgia: | 7.1% |
Unemployment in 2013:
| Atlanta: | 8.8% |
| Georgia: | 8.1% |
Unemployment in 2012:
| Atlanta: | 9.7% |
| Georgia: | 9.0% |
Unemployment in 2011:
| Atlanta: | 10.9% |
| Georgia: | 10.1% |
Unemployment in 2010:
| Atlanta: | 11.4% |
| Georgia: | 10.7% |
Unemployment in 2009:
| Atlanta: | 11.3% |
| Georgia: | 10.4% |
Unemployment in 2008:
| Atlanta: | 7.6% |
| Georgia: | 6.8% |
Unemployment in 2007:
| Atlanta: | 5.9% |
| Georgia: | 4.9% |
Unemployment in 2006:
| Atlanta: | 6.2% |
| Georgia: | 5.1% |
Unemployment in 2005:
| Atlanta: | 7.2% |
| Georgia: | 5.7% |
Unemployment in 2004:
| Atlanta: | 8.0% |
| Georgia: | 5.1% |
Unemployment in 2003:
| Atlanta: | 8.3% |
| Georgia: | 5.1% |
Unemployment in 2002:
| Atlanta: | 8.6% |
| Georgia: | 5.3% |
Unemployment in 2001:
| Atlanta: | 6.1% |
| Georgia: | 4.1% |
Unemployment in 2000:
| Atlanta: | 5.0% |
| Georgia: | 3.5% |
Unemployment in 1999:
| Atlanta: | 5.1% |
| Georgia: | 3.8% |
Unemployment in 1998:
| Atlanta: | 5.6% |
| Georgia: | 4.2% |
Unemployment in 1997:
| Atlanta: | 6.2% |
| Georgia: | 4.5% |
Unemployment in 1996:
| Atlanta: | 6.7% |
| Georgia: | 4.6% |
Unemployment in 1995:
| Atlanta: | 7.2% |
| Georgia: | 4.8% |
Unemployment in 1994:
| Atlanta: | 7.6% |
| Georgia: | 5.1% |
Unemployment in 1993:
| Atlanta: | 8.4% |
| Georgia: | 5.7% |
Unemployment in 1992:
| Atlanta: | 9.4% |
| Georgia: | 6.6% |
Unemployment in 1991:
| Atlanta: | 7.5% |
| Georgia: | 5.3% |
Unemployment in 1990:
| Atlanta: | 7.4% |
| Georgia: | 5.4% |
Time leaving home to go to work
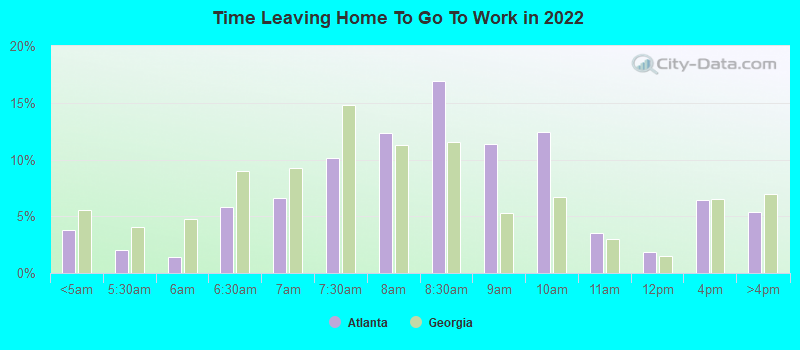
12:00 a.m. to 4:59 a.m.:
| Atlanta: | 3.8% (7,295) |
| Georgia: | 5.5% (242,137) |
5:00 a.m. to 5:29 a.m.:
| Atlanta: | 2.0% (3,911) |
| Georgia: | 4.0% (175,149) |
5:30 a.m. to 5:59 a.m.:
| Atlanta: | 1.4% (2,787) |
| Georgia: | 4.7% (206,203) |
6:00 a.m. to 6:29 a.m.:
| Atlanta: | 5.8% (11,234) |
| Georgia: | 9.0% (390,544) |
6:30 a.m. to 6:59 a.m.:
| Atlanta: | 6.6% (12,801) |
| Georgia: | 9.2% (403,440) |
7:00 a.m. to 7:29 a.m.:
| Atlanta: | 10.2% (19,683) |
| Georgia: | 14.8% (646,529) |
7:30 a.m. to 7:59 a.m.:
| Atlanta: | 12.4% (23,967) |
| Georgia: | 11.3% (493,495) |
8:00 a.m. to 8:29 a.m.:
| Atlanta: | 16.9% (32,840) |
| Georgia: | 11.6% (504,252) |
8:30 a.m. to 8:59 a.m.:
| Atlanta: | 11.4% (22,075) |
| Georgia: | 5.2% (228,810) |
9:00 a.m. to 9:59 a.m.:
| Atlanta: | 12.4% (24,060) |
| Georgia: | 6.7% (292,455) |
10:00 a.m. to 10:59 a.m.:
| Atlanta: | 3.6% (6,913) |
| Georgia: | 3.0% (130,615) |
11:00 a.m. to 11:59 a.m.:
| Atlanta: | 1.8% (3,544) |
| Georgia: | 1.5% (63,552) |
12:00 p.m. to 3:59 p.m.:
| Atlanta: | 6.4% (12,430) |
| Georgia: | 6.5% (282,958) |
4:00 p.m. to 11:59 p.m.:
| Atlanta: | 5.3% (10,359) |
| Georgia: | 6.9% (302,787) |

<5am:
| Atlanta: | 2.1% (3,829) |
| Georgia: | 2.8% (108,019) |
5:30am:
| Atlanta: | 2.4% (4,247) |
| Georgia: | 2.7% (102,302) |
6am:
| Atlanta: | 2.7% (4,907) |
| Georgia: | 4.1% (156,682) |
6:30am:
| Atlanta: | 6.5% (11,551) |
| Georgia: | 9.0% (343,349) |
7am:
| Atlanta: | 7.2% (12,916) |
| Georgia: | 11.0% (422,728) |
7:30am:
| Atlanta: | 12.2% (21,823) |
| Georgia: | 15.9% (608,777) |
8am:
| Atlanta: | 14.7% (26,393) |
| Georgia: | 15.9% (610,869) |
8:30am:
| Atlanta: | 14.2% (25,379) |
| Georgia: | 10.2% (391,849) |
9am:
| Atlanta: | 8.5% (15,297) |
| Georgia: | 4.9% (187,692) |
10am:
| Atlanta: | 8.5% (15,226) |
| Georgia: | 5.3% (204,205) |
11am:
| Atlanta: | 3.6% (6,438) |
| Georgia: | 2.1% (79,927) |
12pm:
| Atlanta: | 1.5% (2,696) |
| Georgia: | 0.9% (34,761) |
4pm:
| Atlanta: | 5.9% (10,529) |
| Georgia: | 5.7% (219,434) |
>4pm:
| Atlanta: | 6.1% (10,998) |
| Georgia: | 6.6% (253,223) |

12:00 a.m. to 4:59 a.m. - Males:
| Atlanta: | 3.4% (3,533) |
| Georgia: | 6.8% (159,003) |
5:00 a.m. to 5:29 a.m. - Males:
| Atlanta: | 2.7% (2,822) |
| Georgia: | 5.1% (118,149) |
5:30 a.m. to 5:59 a.m. - Males:
| Atlanta: | 1.4% (1,416) |
| Georgia: | 5.4% (125,930) |
6:00 a.m. to 6:29 a.m. - Males:
| Atlanta: | 3.9% (4,036) |
| Georgia: | 10.0% (233,694) |
6:30 a.m. to 6:59 a.m. - Males:
| Atlanta: | 4.6% (4,750) |
| Georgia: | 8.9% (206,712) |
7:00 a.m. to 7:29 a.m. - Males:
| Atlanta: | 10.7% (11,127) |
| Georgia: | 14.3% (331,758) |
7:30 a.m. to 7:59 a.m. - Males:
| Atlanta: | 14.8% (15,336) |
| Georgia: | 10.4% (241,448) |
8:00 a.m. to 8:29 a.m. - Males:
| Atlanta: | 16.4% (16,964) |
| Georgia: | 11.2% (261,504) |
8:30 a.m. to 8:59 a.m. - Males:
| Atlanta: | 10.7% (11,052) |
| Georgia: | 4.4% (101,712) |
9:00 a.m. to 9:59 a.m. - Males:
| Atlanta: | 14.9% (15,455) |
| Georgia: | 6.1% (142,843) |
10:00 a.m. to 10:59 a.m. - Males:
| Atlanta: | 2.8% (2,859) |
| Georgia: | 2.7% (62,644) |
11:00 a.m. to 11:59 a.m. - Males:
| Atlanta: | 1.1% (1,165) |
| Georgia: | 1.2% (27,435) |
12:00 p.m. to 3:59 p.m. - Males:
| Atlanta: | 7.6% (7,915) |
| Georgia: | 6.6% (152,923) |
4:00 p.m. to 11:59 p.m. - Males:
| Atlanta: | 5.1% (5,318) |
| Georgia: | 6.9% (159,934) |

12:00 a.m. to 4:59 a.m. - Females:
| Atlanta: | 4.2% (3,762) |
| Georgia: | 4.1% (83,134) |
5:00 a.m. to 5:29 a.m. - Females:
| Atlanta: | 1.2% (1,089) |
| Georgia: | 2.8% (57,000) |
5:30 a.m. to 5:59 a.m. - Females:
| Atlanta: | 1.5% (1,371) |
| Georgia: | 3.9% (80,273) |
6:00 a.m. to 6:29 a.m. - Females:
| Atlanta: | 8.0% (7,198) |
| Georgia: | 7.7% (156,850) |
6:30 a.m. to 6:59 a.m. - Females:
| Atlanta: | 8.9% (8,051) |
| Georgia: | 9.7% (196,728) |
7:00 a.m. to 7:29 a.m. - Females:
| Atlanta: | 9.5% (8,556) |
| Georgia: | 15.5% (314,771) |
7:30 a.m. to 7:59 a.m. - Females:
| Atlanta: | 9.6% (8,631) |
| Georgia: | 12.4% (252,047) |
8:00 a.m. to 8:29 a.m. - Females:
| Atlanta: | 17.6% (15,876) |
| Georgia: | 11.9% (242,748) |
8:30 a.m. to 8:59 a.m. - Females:
| Atlanta: | 12.2% (11,023) |
| Georgia: | 6.2% (127,098) |
9:00 a.m. to 9:59 a.m. - Females:
| Atlanta: | 9.5% (8,605) |
| Georgia: | 7.3% (149,612) |
10:00 a.m. to 10:59 a.m. - Females:
| Atlanta: | 4.5% (4,054) |
| Georgia: | 3.3% (67,971) |
11:00 a.m. to 11:59 a.m. - Females:
| Atlanta: | 2.6% (2,379) |
| Georgia: | 1.8% (36,117) |
12:00 p.m. to 3:59 p.m. - Females:
| Atlanta: | 5.0% (4,515) |
| Georgia: | 6.4% (130,035) |
4:00 p.m. to 11:59 p.m. - Females:
| Atlanta: | 5.6% (5,041) |
| Georgia: | 7.0% (142,853) |
Travel time to work
Percentage of workers working in this county: 76.4%
Number of people working at home: 82,142 (29.8% of all workers)
Daytime population change due to commuting: +259,957 (+62.4%)
Workers who live and work in this city: 106,145 (59.3%)
Number of people working at home: 82,142 (29.8% of all workers)
Daytime population change due to commuting: +259,957 (+62.4%)
Workers who live and work in this city: 106,145 (59.3%)

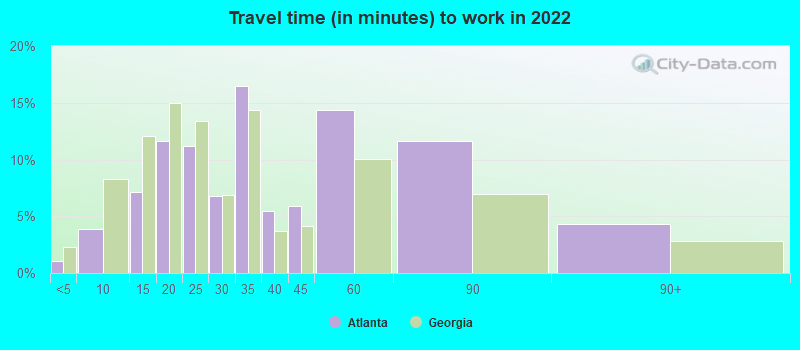

Less than 5 minutes:
| Atlanta: | 1.1% (4,681) |
| Georgia: | 2.3% (99,412) |
5 to 9 minutes:
| Atlanta: | 3.9% (17,150) |
| Georgia: | 8.3% (361,685) |
10 to 14 minutes:
| Atlanta: | 7.1% (31,613) |
| Georgia: | 12.1% (528,166) |
15 to 19 minutes:
| Atlanta: | 11.6% (51,458) |
| Georgia: | 15.0% (654,952) |
20 to 24 minutes:
| Atlanta: | 11.2% (49,631) |
| Georgia: | 13.4% (584,595) |
25 to 29 minutes:
| Atlanta: | 6.8% (30,201) |
| Georgia: | 6.8% (298,541) |
30 to 34 minutes:
| Atlanta: | 16.5% (73,107) |
| Georgia: | 14.4% (627,542) |
35 to 39 minutes:
| Atlanta: | 5.5% (24,285) |
| Georgia: | 3.7% (163,276) |
40 to 44 minutes:
| Atlanta: | 5.9% (26,036) |
| Georgia: | 4.1% (180,851) |
45 to 59 minutes:
| Atlanta: | 14.4% (63,732) |
| Georgia: | 10.0% (437,424) |
60 to 89 minutes:
| Atlanta: | 11.7% (51,652) |
| Georgia: | 7.0% (303,546) |
90 or more minutes:
| Atlanta: | 4.3% (19,026) |
| Georgia: | 2.8% (124,186) |


Less than 5 minutes:
| Atlanta: | 1.7% (3,127) |
| Georgia: | 2.4% (93,446) |
5 to 9 minutes:
| Atlanta: | 7.3% (13,151) |
| Georgia: | 8.7% (334,403) |
10 to 14 minutes:
| Atlanta: | 12.4% (22,147) |
| Georgia: | 13.3% (511,628) |
15 to 19 minutes:
| Atlanta: | 16.8% (30,037) |
| Georgia: | 15.2% (583,820) |
20 to 24 minutes:
| Atlanta: | 16.1% (28,757) |
| Georgia: | 13.6% (519,875) |
25 to 29 minutes:
| Atlanta: | 5.8% (10,372) |
| Georgia: | 5.5% (209,374) |
30 to 34 minutes:
| Atlanta: | 15.0% (26,823) |
| Georgia: | 14.0% (535,531) |
35 to 39 minutes:
| Atlanta: | 2.4% (4,267) |
| Georgia: | 2.8% (108,867) |
40 to 44 minutes:
| Atlanta: | 2.7% (4,859) |
| Georgia: | 3.4% (132,121) |
45 to 59 minutes:
| Atlanta: | 6.4% (11,502) |
| Georgia: | 9.1% (347,610) |
60 to 89 minutes:
| Atlanta: | 5.6% (10,061) |
| Georgia: | 6.1% (234,588) |
90 or more minutes:
| Atlanta: | 4.0% (7,126) |
| Georgia: | 2.9% (112,554) |

Less than 5 minutes - Males:
| Atlanta: | 1.0% (2,414) |
| Georgia: | 2.3% (54,145) |
5 to 9 minutes - Males:
| Atlanta: | 3.6% (8,406) |
| Georgia: | 7.5% (174,640) |
10 to 14 minutes - Males:
| Atlanta: | 7.2% (16,955) |
| Georgia: | 10.7% (249,464) |
15 to 19 minutes - Males:
| Atlanta: | 11.3% (26,339) |
| Georgia: | 14.3% (333,733) |
20 to 24 minutes - Males:
| Atlanta: | 11.4% (26,568) |
| Georgia: | 13.0% (303,241) |
25 to 29 minutes - Males:
| Atlanta: | 7.1% (16,561) |
| Georgia: | 7.0% (162,248) |
30 to 34 minutes - Males:
| Atlanta: | 16.8% (39,302) |
| Georgia: | 15.1% (351,130) |
35 to 39 minutes - Males:
| Atlanta: | 6.1% (14,173) |
| Georgia: | 3.8% (89,464) |
40 to 44 minutes - Males:
| Atlanta: | 5.4% (12,621) |
| Georgia: | 4.0% (93,184) |
45 to 59 minutes - Males:
| Atlanta: | 14.3% (33,422) |
| Georgia: | 10.6% (247,557) |
60 to 89 minutes - Males:
| Atlanta: | 11.7% (27,267) |
| Georgia: | 7.9% (183,852) |
90 or more minutes - Males:
| Atlanta: | 4.3% (9,960) |
| Georgia: | 3.6% (83,280) |

Less than 5 minutes - Females:
| Atlanta: | 1.1% (2,267) |
| Georgia: | 2.2% (45,267) |
5 to 9 minutes - Females:
| Atlanta: | 4.2% (8,744) |
| Georgia: | 9.2% (187,045) |
10 to 14 minutes - Females:
| Atlanta: | 7.0% (14,658) |
| Georgia: | 13.7% (278,702) |
15 to 19 minutes - Females:
| Atlanta: | 12.0% (25,119) |
| Georgia: | 15.8% (321,219) |
20 to 24 minutes - Females:
| Atlanta: | 11.1% (23,063) |
| Georgia: | 13.8% (281,354) |
25 to 29 minutes - Females:
| Atlanta: | 6.5% (13,640) |
| Georgia: | 6.7% (136,293) |
30 to 34 minutes - Females:
| Atlanta: | 16.2% (33,805) |
| Georgia: | 13.6% (276,412) |
35 to 39 minutes - Females:
| Atlanta: | 4.8% (10,112) |
| Georgia: | 3.6% (73,812) |
40 to 44 minutes - Females:
| Atlanta: | 6.4% (13,415) |
| Georgia: | 4.3% (87,667) |
45 to 59 minutes - Females:
| Atlanta: | 14.5% (30,310) |
| Georgia: | 9.3% (189,867) |
60 to 89 minutes - Females:
| Atlanta: | 11.7% (24,385) |
| Georgia: | 5.9% (119,694) |
90 or more minutes - Females:
| Atlanta: | 4.3% (9,066) |
| Georgia: | 2.0% (40,906) |
Means of transportation to work
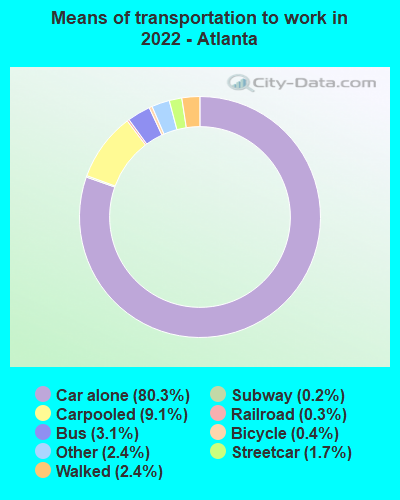
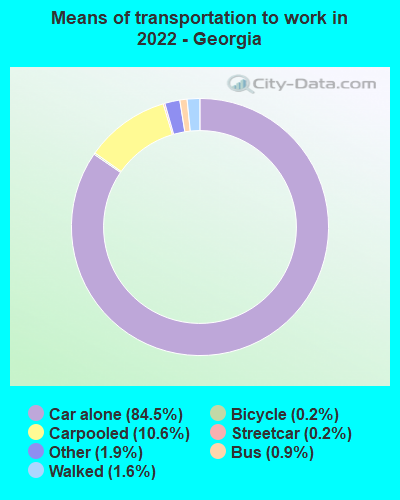
Drove car alone:
| Atlanta: | 80.3% (355,283) |
| Georgia: | 84.5% (1,726,159) |
Carpooled:
| Atlanta: | 9.1% (40,433) |
| Georgia: | 10.6% (221,187) |
Bus:
| Atlanta: | 3.1% (13,768) |
| Georgia: | 0.9% (17,398) |
Subway or elevated rail:
| Atlanta: | 1.7% (7,672) |
| Georgia: | 0.2% (4,652) |
Long-distance train or commuter rail:
| Atlanta: | 0.2% (944) |
| Georgia: | 0.0% (763) |
Light rail, streetcar or trolley:
| Atlanta: | 0.3% (1,263) |
| Georgia: | 0.1% (1,036) |
Bicycle:
| Atlanta: | 0.4% (1,982) |
| Georgia: | 0.2% (2,434) |
Walked:
| Atlanta: | 2.4% (10,575) |
| Georgia: | 1.6% (28,577) |
Other means:
| Atlanta: | 2.4% (10,652) |
| Georgia: | 1.9% (35,874) |

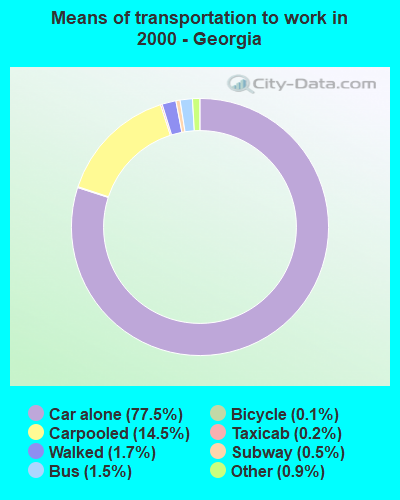
Drove car alone:
| Atlanta: | 64.0% (114,560) |
| Georgia: | 77.5% (2,968,910) |
Carpooled:
| Atlanta: | 12.4% (22,181) |
| Georgia: | 14.5% (557,062) |
Bus or trolley bus:
| Atlanta: | 11.5% (20,502) |
| Georgia: | 1.5% (59,355) |
Streetcar or trolley car:
| Atlanta: | 0.1% (110) |
| Georgia: | 0.0% (843) |
Subway or elevated:
| Atlanta: | 3.0% (5,438) |
| Georgia: | 0.5% (20,116) |
Railroad:
| Atlanta: | 0.2% (310) |
| Georgia: | 0.0% (1,762) |
Ferryboat:
| Atlanta: | 0.0% (59) |
| Georgia: | 0.0% (382) |
Taxicab:
| Atlanta: | 0.3% (474) |
| Georgia: | 0.2% (7,572) |
Motorcycle:
| Atlanta: | 0.1% (206) |
| Georgia: | 0.1% (3,055) |
Bicycle:
| Atlanta: | 0.3% (562) |
| Georgia: | 0.1% (5,588) |
Walked:
| Atlanta: | 3.5% (6,261) |
| Georgia: | 1.7% (65,776) |
Other means:
| Atlanta: | 0.9% (1,566) |
| Georgia: | 0.9% (33,396) |


Drove car alone - Males:
| Atlanta: | 79.6% (186,313) |
| Georgia: | 84.2% (1,726,159) |
Carpooled - Males:
| Atlanta: | 9.3% (21,875) |
| Georgia: | 10.4% (221,187) |
Bus - Males:
| Atlanta: | 2.7% (6,353) |
| Georgia: | 1.0% (17,398) |
Subway or elevated rail - Males:
| Atlanta: | 1.7% (4,046) |
| Georgia: | 0.3% (4,652) |
Long-distance train or commuter rail - Males:
| Atlanta: | 0.2% (462) |
| Georgia: | 0.0% (763) |
Light rail, streetcar or trolley - Males:
| Atlanta: | 0.2% (540) |
| Georgia: | 0.1% (1,036) |
Bicycle - Males:
| Atlanta: | 0.5% (1,081) |
| Georgia: | 0.3% (2,434) |
Walked - Males:
| Atlanta: | 2.8% (6,447) |
| Georgia: | 1.7% (28,577) |
Other means - Males:
| Atlanta: | 2.9% (6,871) |
| Georgia: | 2.1% (35,874) |


Drove car alone - Females:
| Atlanta: | 81.0% (168,970) |
| Georgia: | 84.7% (1,726,159) |
Carpooled - Females:
| Atlanta: | 8.9% (18,558) |
| Georgia: | 10.9% (221,187) |
Bus - Females:
| Atlanta: | 3.6% (7,415) |
| Georgia: | 0.9% (17,398) |
Subway or elevated rail - Females:
| Atlanta: | 1.7% (3,626) |
| Georgia: | 0.2% (4,652) |
Long-distance train or commuter rail - Females:
| Atlanta: | 0.2% (482) |
| Georgia: | 0.0% (763) |
Light rail, streetcar or trolley - Females:
| Atlanta: | 0.3% (723) |
| Georgia: | 0.1% (1,036) |
Bicycle - Females:
| Atlanta: | 0.4% (901) |
| Georgia: | 0.1% (2,434) |
Walked - Females:
| Atlanta: | 2.0% (4,128) |
| Georgia: | 1.4% (28,577) |
Other means - Females:
| Atlanta: | 1.8% (3,781) |
| Georgia: | 1.8% (35,874) |
Private vehicle occupancy

Drove alone:
| Atlanta: | 91.3% (148,022) |
| Georgia: | 88.7% (3,677,830) |
In 2 person carpool:
| Atlanta: | 7.2% (11,607) |
| Georgia: | 8.0% (330,754) |
In 3 person carpool:
| Atlanta: | 0.9% (1,504) |
| Georgia: | 2.0% (84,634) |
In 4 person carpool:
| Atlanta: | 0.4% (708) |
| Georgia: | 0.8% (32,435) |
In 5-6 person carpool:
| Atlanta: | 0.1% (184) |
| Georgia: | 0.3% (13,171) |
In 7+ person carpool:
| Atlanta: | 0.0% (78) |
| Georgia: | 0.2% (6,663) |

Drove alone:
| Atlanta: | 83.8% (114,560) |
| Georgia: | 84.2% (2,968,910) |
In 2 person carpool:
| Atlanta: | 11.5% (15,746) |
| Georgia: | 11.5% (406,954) |
In 3 person carpool:
| Atlanta: | 2.5% (3,451) |
| Georgia: | 2.5% (87,725) |
In 4 person carpool:
| Atlanta: | 1.3% (1,764) |
| Georgia: | 1.0% (34,505) |
In 5-6 person carpool:
| Atlanta: | 0.4% (613) |
| Georgia: | 0.5% (18,718) |
In 7+ person carpool:
| Atlanta: | 0.4% (607) |
| Georgia: | 0.3% (9,160) |
Class of workers
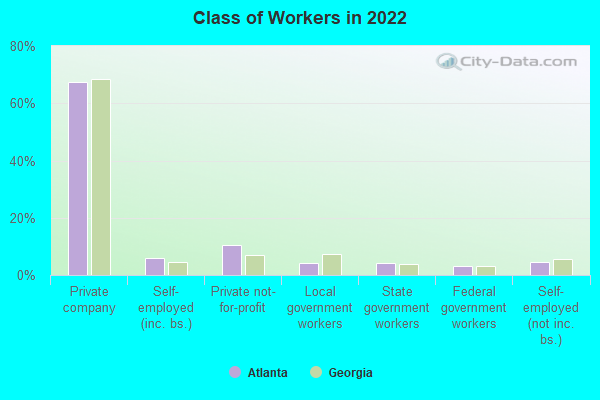
Employee of private company:
| Atlanta: | 67.3% (191,393) |
| Georgia: | 68.6% (3,616,681) |
Self-employed in own incorporated business:
| Atlanta: | 5.8% (16,539) |
| Georgia: | 4.4% (234,196) |
Private not-for-profit wage and salary workers:
| Atlanta: | 10.6% (30,114) |
| Georgia: | 6.9% (365,478) |
Local government workers:
| Atlanta: | 4.3% (12,256) |
| Georgia: | 7.3% (382,883) |
State government workers:
| Atlanta: | 4.1% (11,527) |
| Georgia: | 3.7% (197,066) |
Federal government workers:
| Atlanta: | 3.3% (9,276) |
| Georgia: | 3.2% (167,144) |
Self-employed workers in own not incorporated business:
| Atlanta: | 4.7% (13,316) |
| Georgia: | 5.7% (300,564) |

Employee of private company:
| Atlanta: | 70.1% (128,308) |
| Georgia: | 70.5% (2,705,775) |
Self-employed in own incorporated business:
| Atlanta: | 4.0% (7,397) |
| Georgia: | 3.6% (137,778) |
Private not-for-profit wage and salary workers:
| Atlanta: | 6.6% (12,135) |
| Georgia: | 4.8% (185,815) |
Local government workers:
| Atlanta: | 5.4% (9,839) |
| Georgia: | 6.9% (265,340) |
State government workers:
| Atlanta: | 4.7% (8,540) |
| Georgia: | 5.0% (190,664) |
Federal government workers:
| Atlanta: | 3.1% (5,728) |
| Georgia: | 3.1% (118,038) |
Self-employed workers in own not incorporated business:
| Atlanta: | 5.8% (10,653) |
| Georgia: | 5.9% (226,595) |
Unpaid family workers:
| Atlanta: | 0.2% (336) |
| Georgia: | 0.3% (9,751) |

Employee of private company - Males:
| Atlanta: | 71.8% (107,984) |
| Georgia: | 71.9% (1,957,505) |
Self-employed in own incorporated business - Males:
| Atlanta: | 6.3% (9,507) |
| Georgia: | 5.4% (146,501) |
Private not-for-profit wage and salary workers - Males:
| Atlanta: | 8.4% (12,659) |
| Georgia: | 5.0% (135,126) |
Local government workers - Males:
| Atlanta: | 2.7% (4,017) |
| Georgia: | 5.1% (138,226) |
State government workers - Males:
| Atlanta: | 3.3% (5,036) |
| Georgia: | 2.9% (78,662) |
Federal government workers - Males:
| Atlanta: | 2.0% (3,055) |
| Georgia: | 3.0% (82,423) |
Self-employed workers in own not incorporated business - Males:
| Atlanta: | 5.4% (8,162) |
| Georgia: | 6.6% (180,413) |

Employee of private company - Females:
| Atlanta: | 62.2% (83,409) |
| Georgia: | 65.1% (1,659,176) |
Self-employed in own incorporated business - Females:
| Atlanta: | 5.2% (7,032) |
| Georgia: | 3.4% (87,695) |
Private not-for-profit wage and salary workers - Females:
| Atlanta: | 13.0% (17,455) |
| Georgia: | 9.0% (230,352) |
Local government workers - Females:
| Atlanta: | 6.1% (8,239) |
| Georgia: | 9.6% (244,657) |
State government workers - Females:
| Atlanta: | 4.8% (6,491) |
| Georgia: | 4.6% (118,404) |
Federal government workers - Females:
| Atlanta: | 4.6% (6,221) |
| Georgia: | 3.3% (84,721) |
Self-employed workers in own not incorporated business - Females:
| Atlanta: | 3.8% (5,154) |
| Georgia: | 4.7% (120,151) |