Work and Jobs in Alexandria, Virginia (VA) Detailed Stats
Occupations, Industries, Unemployment, Workers, Commute
Settings
X


Recent posts about work in Alexandria, Virginia on our local forum with over 2,400,000 registered users:
 | Alexandria Unemployment Office (0 replies) |
| Alexandria’s Median Household Income (12 replies) |
| Old Town Alexandria Rental (2 replies) |
| Work in Alexandria, where to live? (28 replies) |
| New job in Alexandria, trying to decide where to live. Advice appreciated! (10 replies) |
| Job in Alexandria. Wanted: Decent neighborhood, good school, ok commute (20 replies) |
Latest news about work in Alexandria, VA collected exclusively by city-data.com from local newspapers, TV, and radio stations
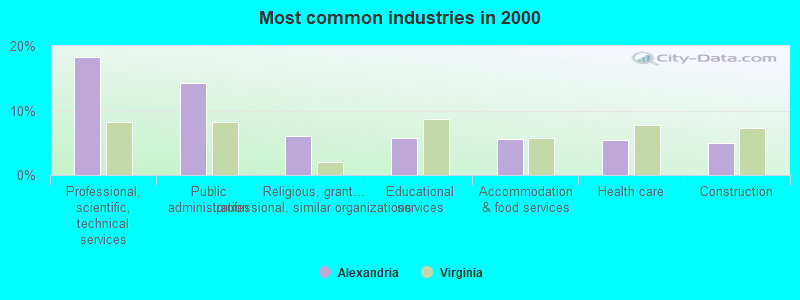
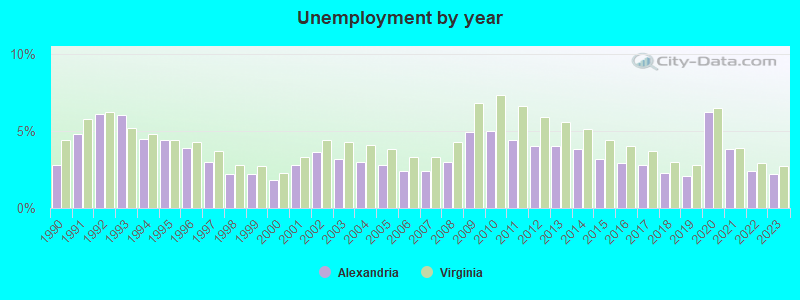
The unemployment rate in 2023 in Alexandria, VA was 2.2%, which was 22.7% less than the unemployment rate of 2.7% across the entire state of Virginia. Compared to the unemployment rate of 4.0% in 2013, this represents a decrease of 81.8%. The most common industries in Alexandria are: Professional, scientific, technical services (18.3% of civilian employees), Public administration (14.2% of civilian employees), Religious, grantmaking, civic, professional, similar organizations (6.1% of civilian employees). 50.0% of workers work in Alexandria city County and 30.9% of all workers work at home. 52.4% of workers are employees of private companies, which is 19.0% less than the rate of 62.3% across the entire state of Virginia.
Whole page based on the data from 2000 / 2022 when the population of Alexandria, Virginia was 128,283 / 155,525
Whole page based on the data from 2000 / 2022 when the population of Alexandria, Virginia was 128,283 / 155,525
Most common industries
Most common industries | |||
|---|---|---|---|
Industry | All | Males | Females |
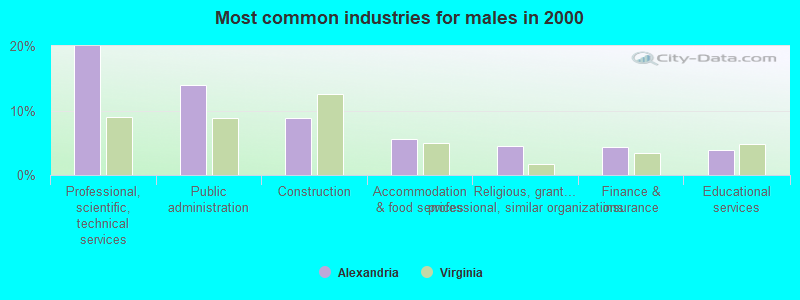
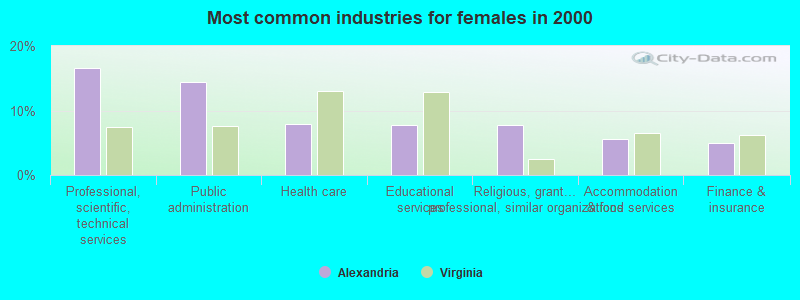
| Professional, scientific, and technical services | 18.3% (13,996) | 19.9% (7,761) | 16.6% (6,235) |
| Public administration | 14.2% (10,903) | 14.0% (5,449) | 14.5% (5,454) |
| Religious, grantmaking, civic, professional, and similar organizations | 6.1% (4,639) | 4.4% (1,722) | 7.7% (2,917) |
| Educational services | 5.8% (4,433) | 3.9% (1,503) | 7.8% (2,930) |
| Accommodation and food services | 5.5% (4,244) | 5.5% (2,153) | 5.6% (2,091) |
| Health care | 5.4% (4,106) | 3.0% (1,156) | 7.8% (2,950) |
| Construction | 5.0% (3,840) | 8.9% (3,463) | 1.0% (377) |
| Finance and insurance | 4.6% (3,515) | 4.3% (1,676) | 4.9% (1,839) |
| Administrative and support and waste management services | 3.7% (2,843) | 3.7% (1,423) | 3.8% (1,420) |
| Broadcasting and telecommunications | 3.1% (2,384) | 3.1% (1,226) | 3.1% (1,158) |
| Real estate and rental and leasing | 2.5% (1,908) | 2.6% (1,020) | 2.4% (888) |
| Data processing, libraries, and other information services | 2.0% (1,494) | 2.1% (814) | 1.8% (680) |
| Publishing, and motion picture and sound recording industries | 1.9% (1,434) | 1.7% (653) | 2.1% (781) |
| Arts, entertainment, and recreation | 1.8% (1,396) | 1.7% (658) | 2.0% (738) |
| Other transportation, and support activities, and couriers | 1.8% (1,373) | 2.9% (1,136) | 0.6% (237) |
| Social assistance | 1.8% (1,343) | 0.5% (184) | 3.1% (1,159) |
| Personal and laundry services | 1.4% (1,108) | 1.3% (501) | 1.6% (607) |
| Department and other general merchandise stores | 1.3% (1,023) | 1.0% (388) | 1.7% (635) |
| Food and beverage stores | 1.0% (768) | 0.9% (369) | 1.1% (399) |
| Air transportation | 1.0% (744) | 1.0% (371) | 1.0% (373) |
| Radio, TV, and computer stores | 0.8% (627) | 0.9% (338) | 0.8% (289) |
| Private households | 0.6% (474) | 0.2% (81) | 1.0% (393) |
| Motor vehicle and parts dealers | 0.6% (450) | 0.8% (301) | 0.4% (149) |
| Computer and electronic products | 0.5% (416) | 0.6% (250) | 0.4% (166) |
| Transportation equipment | 0.5% (405) | 0.6% (239) | 0.4% (166) |
| Repair and maintenance | 0.5% (396) | 0.8% (327) | 0.2% (69) |
| Clothing and accessories, including shoe, stores | 0.5% (367) | 0.3% (136) | 0.6% (231) |
| Truck transportation | 0.5% (354) | 0.7% (265) | 0.2% (89) |
| Printing and related support activities | 0.5% (348) | 0.7% (281) | 0.2% (67) |
| Professional and commercial equipment and supplies merchant wholesalers | 0.5% (347) | 0.5% (177) | 0.5% (170) |
| Other direct selling establishments | 0.4% (320) | 0.5% (192) | 0.3% (128) |
| Pharmacies and drug stores | 0.4% (309) | 0.3% (110) | 0.5% (199) |
| U. S. Postal service | 0.4% (285) | 0.5% (176) | 0.3% (109) |
| Used merchandise, gift, novelty, and souvenir, and other miscellaneous stores | 0.4% (271) | 0.2% (75) | 0.5% (196) |
| Food | 0.3% (255) | 0.3% (136) | 0.3% (119) |
| Utilities | 0.3% (237) | 0.4% (169) | 0.2% (68) |
| Furniture and home furnishings, and household appliance stores | 0.3% (235) | 0.4% (168) | 0.2% (67) |
| Building material and garden equipment and supplies dealers | 0.3% (211) | 0.4% (167) | 0.1% (44) |
| Chemicals | 0.3% (206) | 0.2% (71) | 0.4% (135) |
| Miscellaneous manufacturing | 0.2% (188) | 0.2% (97) | 0.2% (91) |
| Gasoline stations | 0.2% (171) | 0.4% (153) | 0.0% (18) |
| Miscellaneous nondurable goods merchant wholesalers | 0.2% (162) | 0.4% (141) | 0.1% (21) |
| Electronic shopping and mail-order houses | 0.2% (156) | 0.2% (67) | 0.2% (89) |
| Electrical and electronic goods merchant wholesalers | 0.2% (140) | 0.3% (108) | 0.1% (32) |
| Book stores and news dealers | 0.1% (112) | 0.1% (46) | 0.2% (66) |
| Sporting goods, camera, and hobby and toy stores | 0.1% (95) | 0.1% (52) | 0.1% (43) |
| Lumber and other construction materials merchant wholesalers | 0.1% (95) | 0.2% (88) | 0.0% (7) |
| Agriculture, forestry, fishing and hunting | 0.1% (91) | 0.1% (55) | 0.1% (36) |
| Groceries and related products merchant wholesalers | 0.1% (85) | 0.2% (61) | 0.1% (24) |
| Retail florists | 0.1% (78) | 0.1% (45) | 0.1% (33) |
| Rail transportation | 0.1% (76) | 0.1% (49) | 0.1% (27) |
| Metal and metal products | 0.1% (75) | 0.2% (75) | 0.0% (0) |
| Recyclable material merchant wholesalers | 0.1% (61) | 0.2% (61) | 0.0% (0) |
| Machinery | 0.1% (57) | 0.1% (49) | 0.0% (8) |
| Hardware, plumbing and heating equipment, and supplies merchant wholesalers | 0.1% (53) | 0.1% (53) | 0.0% (0) |
Unemployment in Alexandria
- Unemployment by race in 2022
- Unemployment rate for White non-Hispanic residents
- 0.8%Males
- 2.9%Females
- Unemployment rate for Black residents
- 2.1%Males
- Unemployment rate for Asian residents
- 0.2%Males
- 3.5%Females
- Unemployment rate for other race residents
- 3.4%Males
- 9.0%Females
- Unemployment rate for two or more race residents
- 3.4%Males
- 4.0%Females
- Unemployment rate for Hispanic or Latino residents
- 2.8%Males
- 4.6%Females
- Unemployment by race in 2000
- Unemployment rate for White non-Hispanic residents
- 1.7%Males
- 1.7%Females
- Unemployment rate for Black residents
- 6.3%Males
- 5.0%Females
- Unemployment rate for American Indian and Alaska Native residents
- 8.8%Males
- Unemployment rate for Asian residents
- 3.6%Males
- 7.0%Females
- Unemployment rate for other race residents
- 4.5%Males
- 8.0%Females
- Unemployment rate for two or more race residents
- 2.1%Males
- 6.6%Females
- Unemployment rate for Hispanic or Latino residents
- 4.5%Males
- 6.3%Females
Unemployment in 2023:
| Alexandria: | 2.2% |
| Virginia: | 2.7% |
Unemployment in 2022:
| Alexandria: | 2.4% |
| Virginia: | 2.9% |
Unemployment in 2021:
| Alexandria: | 3.8% |
| Virginia: | 3.9% |
Unemployment in 2020:
| Alexandria: | 6.2% |
| Virginia: | 6.5% |
Unemployment in 2019:
| Alexandria: | 2.1% |
| Virginia: | 2.8% |
Unemployment in 2018:
| Alexandria: | 2.3% |
| Virginia: | 3.0% |
Unemployment in 2017:
| Alexandria: | 2.8% |
| Virginia: | 3.7% |
Unemployment in 2016:
| Alexandria: | 2.9% |
| Virginia: | 4.0% |
Unemployment in 2015:
| Alexandria: | 3.2% |
| Virginia: | 4.4% |
Unemployment in 2014:
| Alexandria: | 3.8% |
| Virginia: | 5.1% |
Unemployment in 2013:
| Alexandria: | 4.0% |
| Virginia: | 5.6% |
Unemployment in 2012:
| Alexandria: | 4.0% |
| Virginia: | 5.9% |
Unemployment in 2011:
| Alexandria: | 4.4% |
| Virginia: | 6.6% |
Unemployment in 2010:
| Alexandria: | 5.0% |
| Virginia: | 7.3% |
Unemployment in 2009:
| Alexandria: | 4.9% |
| Virginia: | 6.8% |
Unemployment in 2008:
| Alexandria: | 3.0% |
| Virginia: | 4.3% |
Unemployment in 2007:
| Alexandria: | 2.4% |
| Virginia: | 3.3% |
Unemployment in 2006:
| Alexandria: | 2.4% |
| Virginia: | 3.3% |
Unemployment in 2005:
| Alexandria: | 2.8% |
| Virginia: | 3.8% |
Unemployment in 2004:
| Alexandria: | 3.0% |
| Virginia: | 4.1% |
Unemployment in 2003:
| Alexandria: | 3.2% |
| Virginia: | 4.3% |
Unemployment in 2002:
| Alexandria: | 3.6% |
| Virginia: | 4.4% |
Unemployment in 2001:
| Alexandria: | 2.8% |
| Virginia: | 3.3% |
Unemployment in 2000:
| Alexandria: | 1.8% |
| Virginia: | 2.3% |
Unemployment in 1999:
| Alexandria: | 2.2% |
| Virginia: | 2.7% |
Unemployment in 1998:
| Alexandria: | 2.2% |
| Virginia: | 2.8% |
Unemployment in 1997:
| Alexandria: | 3.0% |
| Virginia: | 3.7% |
Unemployment in 1996:
| Alexandria: | 3.9% |
| Virginia: | 4.3% |
Unemployment in 1995:
| Alexandria: | 4.4% |
| Virginia: | 4.4% |
Unemployment in 1994:
| Alexandria: | 4.5% |
| Virginia: | 4.8% |
Unemployment in 1993:
| Alexandria: | 6.0% |
| Virginia: | 5.2% |
Unemployment in 1992:
| Alexandria: | 6.1% |
| Virginia: | 6.2% |
Unemployment in 1991:
| Alexandria: | 4.8% |
| Virginia: | 5.8% |
Unemployment in 1990:
| Alexandria: | 2.8% |
| Virginia: | 4.4% |
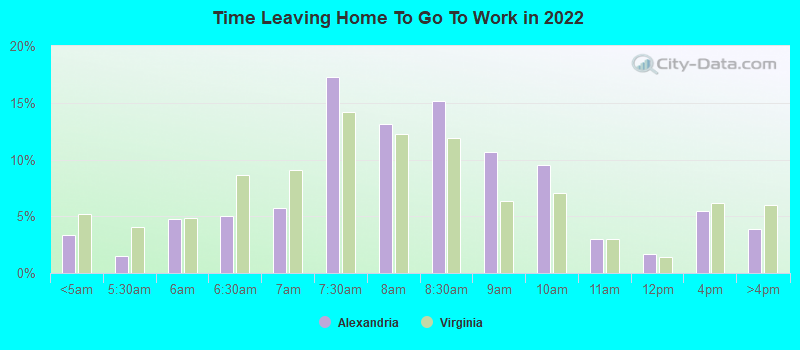
Time leaving home to go to work
12:00 a.m. to 4:59 a.m.:
| Alexandria: | 3.4% (2,271) |
| Virginia: | 5.2% (184,150) |
5:00 a.m. to 5:29 a.m.:
| Alexandria: | 1.5% (993) |
| Virginia: | 4.0% (143,834) |
5:30 a.m. to 5:59 a.m.:
| Alexandria: | 4.8% (3,193) |
| Virginia: | 4.8% (170,996) |
6:00 a.m. to 6:29 a.m.:
| Alexandria: | 5.0% (3,362) |
| Virginia: | 8.6% (307,598) |
6:30 a.m. to 6:59 a.m.:
| Alexandria: | 5.7% (3,837) |
| Virginia: | 9.1% (324,323) |
7:00 a.m. to 7:29 a.m.:
| Alexandria: | 17.2% (11,540) |
| Virginia: | 14.2% (504,796) |
7:30 a.m. to 7:59 a.m.:
| Alexandria: | 13.1% (8,783) |
| Virginia: | 12.3% (436,196) |
8:00 a.m. to 8:29 a.m.:
| Alexandria: | 15.1% (10,147) |
| Virginia: | 11.9% (422,834) |
8:30 a.m. to 8:59 a.m.:
| Alexandria: | 10.7% (7,143) |
| Virginia: | 6.3% (224,568) |
9:00 a.m. to 9:59 a.m.:
| Alexandria: | 9.5% (6,367) |
| Virginia: | 7.0% (250,122) |
10:00 a.m. to 10:59 a.m.:
| Alexandria: | 3.0% (1,983) |
| Virginia: | 3.0% (105,732) |
11:00 a.m. to 11:59 a.m.:
| Alexandria: | 1.7% (1,142) |
| Virginia: | 1.4% (50,363) |
12:00 p.m. to 3:59 p.m.:
| Alexandria: | 5.4% (3,650) |
| Virginia: | 6.2% (219,709) |
4:00 p.m. to 11:59 p.m.:
| Alexandria: | 3.8% (2,567) |
| Virginia: | 6.0% (214,315) |

<5am:
| Alexandria: | 1.5% (1,131) |
| Virginia: | 3.0% (106,117) |
5:30am:
| Alexandria: | 1.9% (1,461) |
| Virginia: | 3.0% (104,536) |
6am:
| Alexandria: | 3.0% (2,300) |
| Virginia: | 4.6% (160,804) |
6:30am:
| Alexandria: | 6.3% (4,849) |
| Virginia: | 9.1% (316,895) |
7am:
| Alexandria: | 8.1% (6,251) |
| Virginia: | 10.7% (372,448) |
7:30am:
| Alexandria: | 15.8% (12,229) |
| Virginia: | 14.1% (491,661) |
8am:
| Alexandria: | 16.7% (12,876) |
| Virginia: | 15.1% (526,342) |
8:30am:
| Alexandria: | 17.5% (13,527) |
| Virginia: | 11.5% (399,738) |
9am:
| Alexandria: | 8.7% (6,715) |
| Virginia: | 5.8% (200,280) |
10am:
| Alexandria: | 7.1% (5,495) |
| Virginia: | 5.5% (190,998) |
11am:
| Alexandria: | 2.3% (1,796) |
| Virginia: | 2.0% (69,788) |
12pm:
| Alexandria: | 0.9% (677) |
| Virginia: | 0.9% (31,327) |
4pm:
| Alexandria: | 3.5% (2,699) |
| Virginia: | 5.6% (196,554) |
>4pm:
| Alexandria: | 3.2% (2,492) |
| Virginia: | 5.9% (204,265) |

12:00 a.m. to 4:59 a.m. - Males:
| Alexandria: | 3.0% (1,077) |
| Virginia: | 6.8% (129,709) |
5:00 a.m. to 5:29 a.m. - Males:
| Alexandria: | 1.9% (668) |
| Virginia: | 5.3% (101,619) |
5:30 a.m. to 5:59 a.m. - Males:
| Alexandria: | 6.4% (2,267) |
| Virginia: | 5.9% (112,784) |
6:00 a.m. to 6:29 a.m. - Males:
| Alexandria: | 3.2% (1,151) |
| Virginia: | 10.0% (191,463) |
6:30 a.m. to 6:59 a.m. - Males:
| Alexandria: | 4.3% (1,511) |
| Virginia: | 9.5% (182,672) |
7:00 a.m. to 7:29 a.m. - Males:
| Alexandria: | 17.4% (6,182) |
| Virginia: | 13.8% (264,728) |
7:30 a.m. to 7:59 a.m. - Males:
| Alexandria: | 10.7% (3,788) |
| Virginia: | 10.4% (198,372) |
8:00 a.m. to 8:29 a.m. - Males:
| Alexandria: | 16.6% (5,889) |
| Virginia: | 10.6% (202,530) |
8:30 a.m. to 8:59 a.m. - Males:
| Alexandria: | 11.8% (4,186) |
| Virginia: | 5.5% (105,302) |
9:00 a.m. to 9:59 a.m. - Males:
| Alexandria: | 6.8% (2,409) |
| Virginia: | 6.3% (120,452) |
10:00 a.m. to 10:59 a.m. - Males:
| Alexandria: | 3.7% (1,308) |
| Virginia: | 2.6% (49,141) |
11:00 a.m. to 11:59 a.m. - Males:
| Alexandria: | 2.1% (752) |
| Virginia: | 1.3% (24,562) |
12:00 p.m. to 3:59 p.m. - Males:
| Alexandria: | 6.1% (2,151) |
| Virginia: | 6.0% (115,691) |
4:00 p.m. to 11:59 p.m. - Males:
| Alexandria: | 6.1% (2,164) |
| Virginia: | 6.1% (116,029) |

12:00 a.m. to 4:59 a.m. - Females:
| Alexandria: | 3.8% (1,194) |
| Virginia: | 3.3% (54,441) |
5:00 a.m. to 5:29 a.m. - Females:
| Alexandria: | 1.0% (325) |
| Virginia: | 2.6% (42,215) |
5:30 a.m. to 5:59 a.m. - Females:
| Alexandria: | 2.9% (926) |
| Virginia: | 3.5% (58,212) |
6:00 a.m. to 6:29 a.m. - Females:
| Alexandria: | 7.0% (2,211) |
| Virginia: | 7.1% (116,135) |
6:30 a.m. to 6:59 a.m. - Females:
| Alexandria: | 7.4% (2,326) |
| Virginia: | 8.6% (141,651) |
7:00 a.m. to 7:29 a.m. - Females:
| Alexandria: | 17.0% (5,358) |
| Virginia: | 14.6% (240,068) |
7:30 a.m. to 7:59 a.m. - Females:
| Alexandria: | 15.9% (4,995) |
| Virginia: | 14.5% (237,824) |
8:00 a.m. to 8:29 a.m. - Females:
| Alexandria: | 13.5% (4,258) |
| Virginia: | 13.4% (220,304) |
8:30 a.m. to 8:59 a.m. - Females:
| Alexandria: | 9.4% (2,957) |
| Virginia: | 7.3% (119,266) |
9:00 a.m. to 9:59 a.m. - Females:
| Alexandria: | 12.6% (3,958) |
| Virginia: | 7.9% (129,670) |
10:00 a.m. to 10:59 a.m. - Females:
| Alexandria: | 2.1% (675) |
| Virginia: | 3.4% (56,591) |
11:00 a.m. to 11:59 a.m. - Females:
| Alexandria: | 1.2% (390) |
| Virginia: | 1.6% (25,801) |
12:00 p.m. to 3:59 p.m. - Females:
| Alexandria: | 4.8% (1,499) |
| Virginia: | 6.3% (104,018) |
4:00 p.m. to 11:59 p.m. - Females:
| Alexandria: | 1.3% (403) |
| Virginia: | 6.0% (98,286) |
Travel time to work
Percentage of workers working in this county: 50.0%
Number of people working at home: 30,015 (30.9% of all workers)
Daytime population change due to commuting: +4,177 (+3.3%)
Workers who live and work in this city: 19,473 (25.2%)
Number of people working at home: 30,015 (30.9% of all workers)
Daytime population change due to commuting: +4,177 (+3.3%)
Workers who live and work in this city: 19,473 (25.2%)

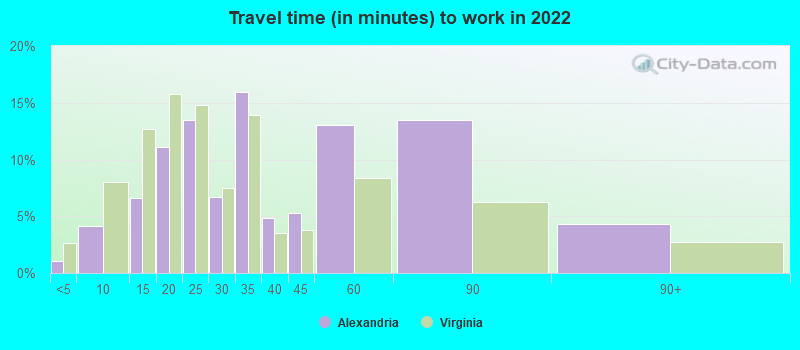

Less than 5 minutes:
| Alexandria: | 1.0% (783) |
| Virginia: | 2.6% (93,024) |
5 to 9 minutes:
| Alexandria: | 4.2% (3,114) |
| Virginia: | 8.0% (284,014) |
10 to 14 minutes:
| Alexandria: | 6.6% (4,951) |
| Virginia: | 12.7% (449,774) |
15 to 19 minutes:
| Alexandria: | 11.1% (8,324) |
| Virginia: | 15.7% (557,327) |
20 to 24 minutes:
| Alexandria: | 13.5% (10,108) |
| Virginia: | 14.8% (523,186) |
25 to 29 minutes:
| Alexandria: | 6.7% (4,998) |
| Virginia: | 7.5% (263,994) |
30 to 34 minutes:
| Alexandria: | 15.9% (11,932) |
| Virginia: | 14.0% (494,374) |
35 to 39 minutes:
| Alexandria: | 4.9% (3,637) |
| Virginia: | 3.6% (125,916) |
40 to 44 minutes:
| Alexandria: | 5.3% (3,934) |
| Virginia: | 3.8% (133,560) |
45 to 59 minutes:
| Alexandria: | 13.1% (9,782) |
| Virginia: | 8.4% (297,802) |
60 to 89 minutes:
| Alexandria: | 13.5% (10,114) |
| Virginia: | 6.2% (220,533) |
90 or more minutes:
| Alexandria: | 4.3% (3,230) |
| Virginia: | 2.8% (97,883) |


Less than 5 minutes:
| Alexandria: | 1.2% (959) |
| Virginia: | 2.4% (85,207) |
5 to 9 minutes:
| Alexandria: | 4.6% (3,541) |
| Virginia: | 8.5% (296,082) |
10 to 14 minutes:
| Alexandria: | 9.6% (7,414) |
| Virginia: | 12.9% (448,126) |
15 to 19 minutes:
| Alexandria: | 12.8% (9,888) |
| Virginia: | 15.2% (530,128) |
20 to 24 minutes:
| Alexandria: | 14.1% (10,874) |
| Virginia: | 14.7% (513,490) |
25 to 29 minutes:
| Alexandria: | 6.3% (4,863) |
| Virginia: | 6.2% (217,273) |
30 to 34 minutes:
| Alexandria: | 16.3% (12,554) |
| Virginia: | 13.7% (478,666) |
35 to 39 minutes:
| Alexandria: | 3.9% (3,015) |
| Virginia: | 3.0% (103,937) |
40 to 44 minutes:
| Alexandria: | 6.6% (5,094) |
| Virginia: | 3.7% (127,218) |
45 to 59 minutes:
| Alexandria: | 13.4% (10,375) |
| Virginia: | 8.3% (289,734) |
60 to 89 minutes:
| Alexandria: | 6.0% (4,597) |
| Virginia: | 5.4% (189,384) |
90 or more minutes:
| Alexandria: | 1.7% (1,324) |
| Virginia: | 2.7% (92,508) |

Less than 5 minutes - Males:
| Alexandria: | 1.2% (462) |
| Virginia: | 2.7% (52,098) |
5 to 9 minutes - Males:
| Alexandria: | 4.3% (1,639) |
| Virginia: | 7.0% (134,006) |
10 to 14 minutes - Males:
| Alexandria: | 6.2% (2,377) |
| Virginia: | 11.7% (224,187) |
15 to 19 minutes - Males:
| Alexandria: | 11.1% (4,279) |
| Virginia: | 14.6% (279,430) |
20 to 24 minutes - Males:
| Alexandria: | 9.7% (3,732) |
| Virginia: | 14.0% (266,775) |
25 to 29 minutes - Males:
| Alexandria: | 5.8% (2,221) |
| Virginia: | 7.3% (139,817) |
30 to 34 minutes - Males:
| Alexandria: | 15.8% (6,057) |
| Virginia: | 14.4% (275,584) |
35 to 39 minutes - Males:
| Alexandria: | 2.6% (991) |
| Virginia: | 3.7% (70,120) |
40 to 44 minutes - Males:
| Alexandria: | 6.2% (2,389) |
| Virginia: | 4.2% (80,117) |
45 to 59 minutes - Males:
| Alexandria: | 16.8% (6,462) |
| Virginia: | 9.5% (180,831) |
60 to 89 minutes - Males:
| Alexandria: | 14.9% (5,722) |
| Virginia: | 7.3% (139,940) |
90 or more minutes - Males:
| Alexandria: | 5.4% (2,084) |
| Virginia: | 3.6% (67,986) |

Less than 5 minutes - Females:
| Alexandria: | 0.9% (321) |
| Virginia: | 2.5% (40,926) |
5 to 9 minutes - Females:
| Alexandria: | 4.0% (1,475) |
| Virginia: | 9.2% (150,008) |
10 to 14 minutes - Females:
| Alexandria: | 7.1% (2,574) |
| Virginia: | 13.8% (225,587) |
15 to 19 minutes - Females:
| Alexandria: | 11.1% (4,045) |
| Virginia: | 17.0% (277,897) |
20 to 24 minutes - Females:
| Alexandria: | 17.5% (6,376) |
| Virginia: | 15.7% (256,411) |
25 to 29 minutes - Females:
| Alexandria: | 7.6% (2,777) |
| Virginia: | 7.6% (124,177) |
30 to 34 minutes - Females:
| Alexandria: | 16.1% (5,875) |
| Virginia: | 13.4% (218,790) |
35 to 39 minutes - Females:
| Alexandria: | 7.3% (2,646) |
| Virginia: | 3.4% (55,796) |
40 to 44 minutes - Females:
| Alexandria: | 4.2% (1,545) |
| Virginia: | 3.3% (53,443) |
45 to 59 minutes - Females:
| Alexandria: | 9.1% (3,320) |
| Virginia: | 7.2% (116,971) |
60 to 89 minutes - Females:
| Alexandria: | 12.0% (4,392) |
| Virginia: | 4.9% (80,593) |
90 or more minutes - Females:
| Alexandria: | 3.1% (1,146) |
| Virginia: | 1.8% (29,897) |
Means of transportation to work
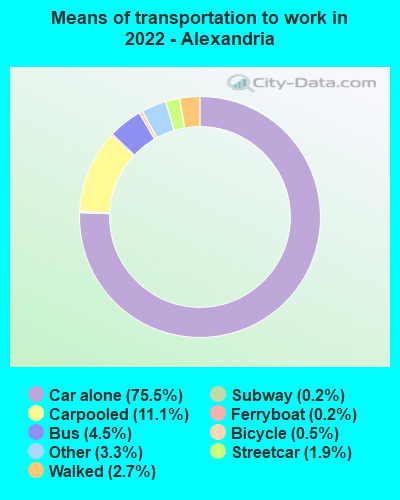
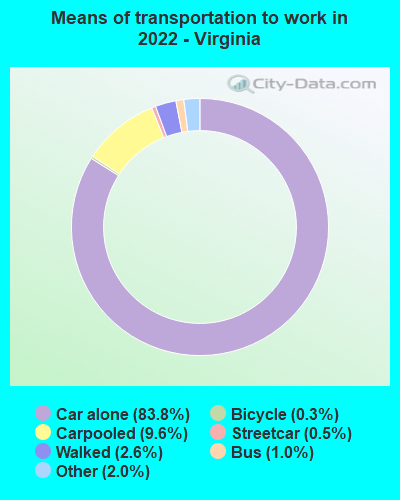
Drove car alone:
| Alexandria: | 75.5% (56,552) |
| Virginia: | 83.8% (1,360,070) |
Carpooled:
| Alexandria: | 11.1% (8,333) |
| Virginia: | 9.6% (170,169) |
Bus:
| Alexandria: | 4.5% (3,367) |
| Virginia: | 1.0% (18,549) |
Subway or elevated rail:
| Alexandria: | 1.9% (1,422) |
| Virginia: | 0.5% (6,508) |
Long-distance train or commuter rail:
| Alexandria: | 0.2% (130) |
| Virginia: | 0.1% (1,022) |
Ferryboat:
| Alexandria: | 0.2% (181) |
| Virginia: | 0.0% (320) |
Bicycle:
| Alexandria: | 0.5% (394) |
| Virginia: | 0.3% (3,241) |
Walked:
| Alexandria: | 2.7% (2,045) |
| Virginia: | 2.6% (40,742) |
Other means:
| Alexandria: | 3.3% (2,483) |
| Virginia: | 2.0% (29,530) |

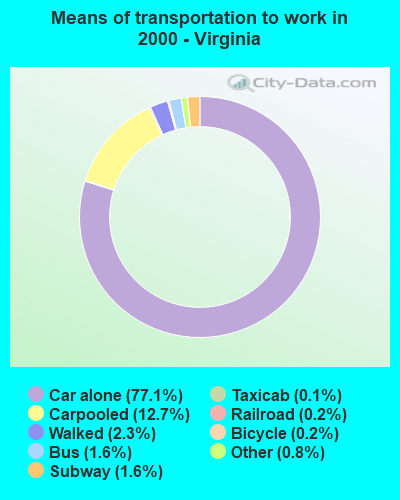
Drove car alone:
| Alexandria: | 62.8% (48,487) |
| Virginia: | 77.1% (2,685,914) |
Carpooled:
| Alexandria: | 13.2% (10,158) |
| Virginia: | 12.7% (441,093) |
Bus or trolley bus:
| Alexandria: | 6.4% (4,928) |
| Virginia: | 1.6% (56,841) |
Streetcar or trolley car:
| Alexandria: | 0.1% (66) |
| Virginia: | 0.0% (397) |
Subway or elevated:
| Alexandria: | 9.3% (7,192) |
| Virginia: | 1.6% (56,225) |
Railroad:
| Alexandria: | 0.1% (93) |
| Virginia: | 0.2% (5,998) |
Taxicab:
| Alexandria: | 0.5% (358) |
| Virginia: | 0.1% (4,369) |
Motorcycle:
| Alexandria: | 0.1% (90) |
| Virginia: | 0.1% (3,180) |
Bicycle:
| Alexandria: | 0.5% (413) |
| Virginia: | 0.2% (7,930) |
Walked:
| Alexandria: | 3.0% (2,289) |
| Virginia: | 2.3% (80,487) |
Other means:
| Alexandria: | 0.5% (424) |
| Virginia: | 0.8% (28,983) |

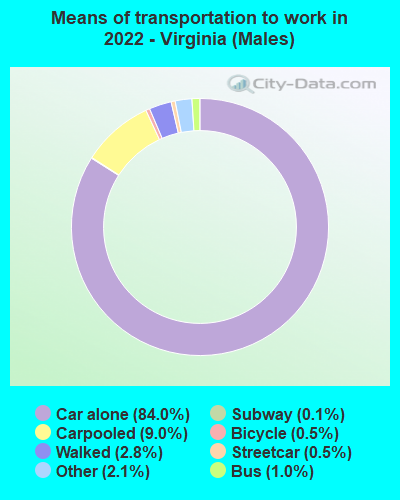
Drove car alone - Males:
| Alexandria: | 77.1% (29,628) |
| Virginia: | 84.0% (1,360,070) |
Carpooled - Males:
| Alexandria: | 9.5% (3,644) |
| Virginia: | 9.0% (170,169) |
Bus - Males:
| Alexandria: | 3.5% (1,348) |
| Virginia: | 1.0% (18,549) |
Subway or elevated rail - Males:
| Alexandria: | 1.2% (473) |
| Virginia: | 0.5% (6,508) |
Long-distance train or commuter rail - Males:
| Alexandria: | 0.2% (65) |
| Virginia: | 0.1% (1,022) |
Ferryboat - Males:
| Alexandria: | 0.5% (181) |
| Virginia: | 0.0% (320) |
Bicycle - Males:
| Alexandria: | 0.8% (318) |
| Virginia: | 0.5% (3,241) |
Walked - Males:
| Alexandria: | 3.2% (1,236) |
| Virginia: | 2.8% (40,742) |
Other means - Males:
| Alexandria: | 4.0% (1,522) |
| Virginia: | 2.1% (29,530) |

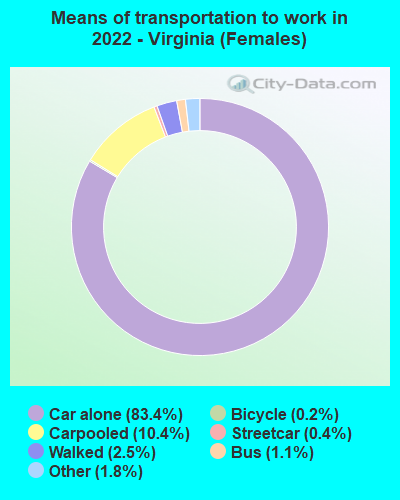
Drove car alone - Females:
| Alexandria: | 73.8% (26,924) |
| Virginia: | 83.4% (1,360,070) |
Carpooled - Females:
| Alexandria: | 12.8% (4,689) |
| Virginia: | 10.4% (170,169) |
Bus - Females:
| Alexandria: | 5.5% (2,019) |
| Virginia: | 1.1% (18,549) |
Subway or elevated rail - Females:
| Alexandria: | 2.6% (949) |
| Virginia: | 0.4% (6,508) |
Long-distance train or commuter rail - Females:
| Alexandria: | 0.2% (65) |
| Virginia: | 0.1% (1,022) |
Bicycle - Females:
| Alexandria: | 0.2% (76) |
| Virginia: | 0.2% (3,241) |
Walked - Females:
| Alexandria: | 2.2% (809) |
| Virginia: | 2.5% (40,742) |
Other means - Females:
| Alexandria: | 2.6% (961) |
| Virginia: | 1.8% (29,530) |
Private vehicle occupancy

Drove alone:
| Alexandria: | 91.8% (50,019) |
| Virginia: | 89.4% (2,955,039) |
In 2 person carpool:
| Alexandria: | 6.7% (3,658) |
| Virginia: | 7.8% (259,148) |
In 3 person carpool:
| Alexandria: | 1.2% (655) |
| Virginia: | 1.6% (53,429) |
In 5-6 person carpool:
| Alexandria: | 0.2% (116) |
| Virginia: | 0.3% (11,523) |
In 7+ person carpool:
| Alexandria: | 0.1% (50) |
| Virginia: | 0.2% (6,717) |

Drove alone:
| Alexandria: | 82.7% (48,487) |
| Virginia: | 85.9% (2,685,914) |
In 2 person carpool:
| Alexandria: | 13.2% (7,767) |
| Virginia: | 10.6% (329,961) |
In 3 person carpool:
| Alexandria: | 2.5% (1,454) |
| Virginia: | 2.2% (69,338) |
In 4 person carpool:
| Alexandria: | 0.8% (498) |
| Virginia: | 0.7% (22,849) |
In 5-6 person carpool:
| Alexandria: | 0.5% (281) |
| Virginia: | 0.3% (10,110) |
In 7+ person carpool:
| Alexandria: | 0.3% (158) |
| Virginia: | 0.3% (8,835) |
Class of workers
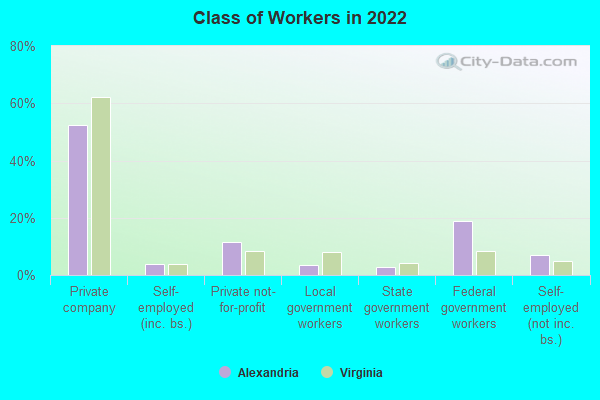
Employee of private company:
| Alexandria: | 52.4% (49,568) |
| Virginia: | 62.3% (2,679,819) |
Self-employed in own incorporated business:
| Alexandria: | 3.8% (3,597) |
| Virginia: | 3.7% (159,727) |
Private not-for-profit wage and salary workers:
| Alexandria: | 11.6% (10,968) |
| Virginia: | 8.4% (359,054) |
Local government workers:
| Alexandria: | 3.5% (3,289) |
| Virginia: | 8.1% (347,176) |
State government workers:
| Alexandria: | 2.9% (2,712) |
| Virginia: | 4.1% (175,990) |
Federal government workers:
| Alexandria: | 18.9% (17,877) |
| Virginia: | 8.3% (354,980) |
Self-employed workers in own not incorporated business:
| Alexandria: | 6.9% (6,538) |
| Virginia: | 5.0% (216,243) |
Unpaid family workers:
| Alexandria: | 0.1% (76) |
| Virginia: | 0.1% (5,572) |

Employee of private company:
| Alexandria: | 57.9% (44,305) |
| Virginia: | 64.9% (2,214,133) |
Self-employed in own incorporated business:
| Alexandria: | 2.6% (1,968) |
| Virginia: | 3.1% (105,080) |
Private not-for-profit wage and salary workers:
| Alexandria: | 12.4% (9,509) |
| Virginia: | 6.7% (228,777) |
Local government workers:
| Alexandria: | 4.9% (3,755) |
| Virginia: | 7.9% (268,029) |
State government workers:
| Alexandria: | 1.1% (859) |
| Virginia: | 4.4% (149,085) |
Federal government workers:
| Alexandria: | 15.8% (12,112) |
| Virginia: | 7.4% (251,461) |
Self-employed workers in own not incorporated business:
| Alexandria: | 5.2% (3,947) |
| Virginia: | 5.5% (188,035) |
Unpaid family workers:
| Alexandria: | 0.2% (129) |
| Virginia: | 0.2% (8,047) |

Employee of private company - Males:
| Alexandria: | 54.9% (26,097) |
| Virginia: | 65.6% (1,465,158) |
Self-employed in own incorporated business - Males:
| Alexandria: | 4.6% (2,185) |
| Virginia: | 4.6% (102,356) |
Private not-for-profit wage and salary workers - Males:
| Alexandria: | 9.3% (4,444) |
| Virginia: | 5.7% (128,261) |
Local government workers - Males:
| Alexandria: | 2.3% (1,116) |
| Virginia: | 5.5% (123,807) |
State government workers - Males:
| Alexandria: | 2.4% (1,121) |
| Virginia: | 3.5% (78,080) |
Federal government workers - Males:
| Alexandria: | 16.6% (7,901) |
| Virginia: | 9.2% (205,613) |
Self-employed workers in own not incorporated business - Males:
| Alexandria: | 9.8% (4,671) |
| Virginia: | 5.6% (125,765) |

Employee of private company - Females:
| Alexandria: | 49.8% (23,471) |
| Virginia: | 58.8% (1,214,661) |
Self-employed in own incorporated business - Females:
| Alexandria: | 3.0% (1,412) |
| Virginia: | 2.8% (57,371) |
Private not-for-profit wage and salary workers - Females:
| Alexandria: | 13.9% (6,524) |
| Virginia: | 11.2% (230,793) |
Local government workers - Females:
| Alexandria: | 4.6% (2,173) |
| Virginia: | 10.8% (223,369) |
State government workers - Females:
| Alexandria: | 3.4% (1,591) |
| Virginia: | 4.7% (97,910) |
Federal government workers - Females:
| Alexandria: | 21.2% (9,976) |
| Virginia: | 7.2% (149,367) |
Self-employed workers in own not incorporated business - Females:
| Alexandria: | 4.0% (1,867) |
| Virginia: | 4.4% (90,478) |
Unpaid family workers - Females:
| Alexandria: | 0.2% (76) |
| Virginia: | 0.1% (2,668) |