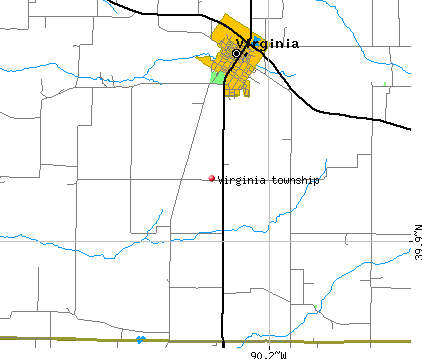
Virginia township, Cass County, Illinois (IL) detailed profile
Number of foreign born residents: 0 (67% naturalized citizens)
| Virginia township: | 0.3% |
| Whole state: | 12.3% |
63% of Virginia township residents lived in the same house 5 years ago.
Out of people who lived in different houses, 63% lived in this county.
Out of people who lived in different counties, 81% lived in Illinois.
Place of birth for U.S.-born residents:
- This state: 1671
- Northeast: 39
- Midwest: 124
- South: 82
- West: 20
Median price asked for vacant for-sale houses in 2000: $47,900
Percentage of households with unmarried partners: 4.6%
Likely homosexual households (counted as self-reported same-sex unmarried-partner households)
- Lesbian couples: 0.0% of all households
- Gay men: 0.1% of all households
58 people in nursing homes

Housing units in structures:
- One, detached: 702
- One, attached: 7
- Two: 35
- 3 or 4: 17
- 5 to 9: 13
- 10 to 19: 2
- 20 to 49: 12
- Mobile homes: 93
Median worth of mobile homes: $20,600
Housing units in Virginia township with a mortgage: 191 (9 second mortgage, 5 home equity loan, 0 both second mortgage and home equity loan)
Houses without a mortgage: 289
- Construction (12%)
- Agriculture, forestry, fishing and hunting (8%)
- Food (8%)
- Public administration (7%)
- Educational services (6%)
- Food and beverage stores (5%)
- Repair and maintenance (4%)
- Educational services (18%)
- Health care (12%)
- Finance and insurance (9%)
- Public administration (9%)
- Food and beverage stores (5%)
- Printing and related support activities (5%)
- Social assistance (4%)
- Driver/sales workers and truck drivers (9%)
- Other management occupations except farmers and farm managers (5%)
- Sales representatives, services, wholesale and manufacturing (4%)
- Food processing workers (4%)
- Electrical equipment mechanics and other installation, maintenance, and repair occupations including supervisors (4%)
- Vehicle and mobile equipment mechanics, installers, and repairers (4%)
- Building and grounds cleaning and maintenance occupations (4%)
- Secretaries and administrative assistants (10%)
- Other office and administrative support workers including supervisors (8%)
- Preschool, kindergarten, elementary and middle school teachers (7%)
- Other production occupations including supervisors (5%)
- Child care workers (4%)
- Nursing, psychiatric, and home health aides (4%)
- Cashiers (4%)
Most common first ancestries reported in Virginia township:
- German (31.0%)
- English (22.0%)
- United States or American (14.5%)
- Irish (9.6%)
- Scottish (3.5%)
- Scotch-Irish (2.4%)
- French (except Basque) (2.3%)
Most common places of birth for the foreign-born residents:
- India (67%)
- Mexico (33%)
Means of transportation to work:
- Drove a car alone: 701 (75%)
- Carpooled: 172 (18%)
- Bicycle: 2 (0%)
- Walked: 20 (2%)
- Other means: 2 (0%)
- Worked at home: 33 (4%)
Most commonly used house heating fuel:
- Utility gas (75%)
- Electricity (16%)
- Bottled, tank, or LP gas (8%)
58 people in nursing homes
98.0% of residents of Virginia township speak English at home.
0.9% of residents speak Spanish at home (63% speak English very well, 25% speak English well, 13% speak English not well).
1.1% of residents speak other Indo-European language at home (90% speak English very well, 10% speak English not well).
Household type by relationship:
Households: 1,888- In family households: 1,577 (429 male householders, 109 female householders)
422 spouses, 539 children (475 natural, 16 adopted, 48 stepchildren), 37 grandchildren, 7 brothers or sisters, 5 parents, 14 other relatives, 15 non-relatives
- In nonfamily households: 311 (120 male householders (92 living alone)), 150 female householders (144 living alone)), 41 nonrelatives
- In group quarters: 57 (all institutionalized)
Size of family households: 242 2-persons, 141 3-persons, 90 4-persons, 53 5-persons, 11 6-persons, 1 7-or-more-persons,
Size of nonfamily households: 236 1-person, 28 2-persons, 4 3-persons, 2 4-persons,
345 married couples with children.
77 single-parent households (18 men, 59 women).
Private vs. public school enrollment:
Students in private schools in grades 1 to 8 (elementary and middle school): 3
| Here: | 1.4% |
| Illinois: | 13.4% |
Students in private schools in grades 9 to 12 (high school): 2
| Here: | 1.7% |
| Illinois: | 11.1% |
Students in private undergraduate colleges: 13
| Here: | 25.5% |
| Illinois: | 25.8% |