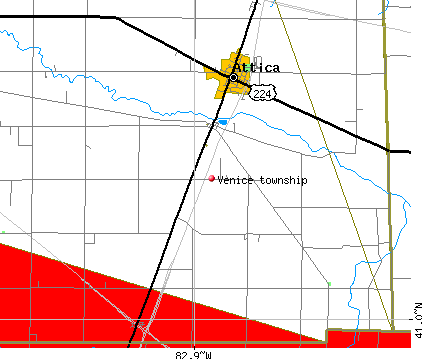
Venice township, Seneca County, Ohio (OH) detailed profile
Number of foreign born residents: 1 (31% naturalized citizens)
| Venice township: | 0.7% |
| Whole state: | 3.0% |
63% of Venice township residents lived in the same house 5 years ago.
Out of people who lived in different houses, 49% lived in this county.
Out of people who lived in different counties, 88% lived in Ohio.
Place of birth for U.S.-born residents:
- This state: 1719
- Northeast: 13
- Midwest: 27
- South: 68
- West: 17
Median price asked for vacant for-sale houses in 2000: $55,000
Percentage of households with unmarried partners: 5.1%
Likely homosexual households (counted as self-reported same-sex unmarried-partner households)
- Lesbian couples: 0.3% of all households
- Gay men: 0.1% of all households

Housing units in structures:
- One, detached: 658
- One, attached: 12
- Two: 23
- 3 or 4: 25
- 5 to 9: 35
- Mobile homes: 34
- Boats, RVs, vans, etc.: 5
Median worth of mobile homes: $80,000
Housing units in Venice township with a mortgage: 304 (30 second mortgage, 53 home equity loan, 8 both second mortgage and home equity loan)
Houses without a mortgage: 191
- Printing and related support activities (16%)
- Construction (8%)
- Machinery (8%)
- Agriculture, forestry, fishing and hunting (7%)
- Metal and metal products (6%)
- Food (4%)
- Truck transportation (4%)
- Health care (16%)
- Educational services (11%)
- Food (7%)
- Furniture and related product manufacturing (6%)
- Plastics and rubber products (6%)
- Accommodation and food services (6%)
- Printing and related support activities (5%)
- Driver/sales workers and truck drivers (9%)
- Electrical equipment mechanics and other installation, maintenance, and repair occupations including supervisors (9%)
- Other production occupations including supervisors (8%)
- Metal workers and plastic workers (7%)
- Printing workers (6%)
- Laborers and material movers, hand (6%)
- Farmers and farm managers (4%)
- Laborers and material movers, hand (8%)
- Textile, apparel, and furnishings workers (7%)
- Secretaries and administrative assistants (6%)
- Assemblers and fabricators (6%)
- Health technologists and technicians (5%)
- Retail sales workers except cashiers (4%)
- Bus drivers (4%)
Most common first ancestries reported in Venice township:
- German (55.1%)
- United States or American (21.2%)
- English (5.4%)
- Irish (4.4%)
- French (except Basque) (2.8%)
- Italian (1.8%)
- Dutch (1.3%)
Most common places of birth for the foreign-born residents:
- Russia (23%)
- United Kingdom (15%)
- France (15%)
- Germany (15%)
- Indonesia (15%)
- Panama (15%)
Means of transportation to work:
- Drove a car alone: 745 (81%)
- Carpooled: 105 (11%)
- Walked: 27 (3%)
- Other means: 5 (1%)
- Worked at home: 40 (4%)
Most commonly used house heating fuel:
- Utility gas (51%)
- Fuel oil, kerosene, etc. (15%)
- Bottled, tank, or LP gas (15%)
- Electricity (11%)
- Wood (7%)
- Other fuel (1%)
98.2% of residents of Venice township speak English at home.
1.4% of residents speak Spanish at home (56% speak English very well, 44% speak English not well).
0.2% of residents speak other Indo-European language at home (100% speak English very well).
0.2% of residents speak other language at home (100% speak English very well).
Household type by relationship:
Households: 1,866- In family households: 1,638 (449 male householders, 90 female householders)
462 spouses, 568 children (512 natural, 15 adopted, 41 stepchildren), 16 grandchildren, 0 brothers or sisters, 8 parents, 5 other relatives, 40 non-relatives
- In nonfamily households: 228 (99 male householders (78 living alone)), 79 female householders (68 living alone)), 50 nonrelatives
Size of family households: 254 2-persons, 114 3-persons, 113 4-persons, 44 5-persons, 10 6-persons, 4 7-or-more-persons,
Size of nonfamily households: 146 1-person, 18 2-persons, 11 3-persons, 3 4-persons,
351 married couples with children.
70 single-parent households (11 men, 59 women).
Private vs. public school enrollment:
Students in private schools in grades 1 to 8 (elementary and middle school): 2
| Here: | 1.0% |
| Ohio: | 14.2% |
Students in private schools in grades 9 to 12 (high school): 0
| Here: | 0.0% |
| Ohio: | 10.9% |
Students in private undergraduate colleges: 29
| Here: | 52.7% |
| Ohio: | 23.4% |