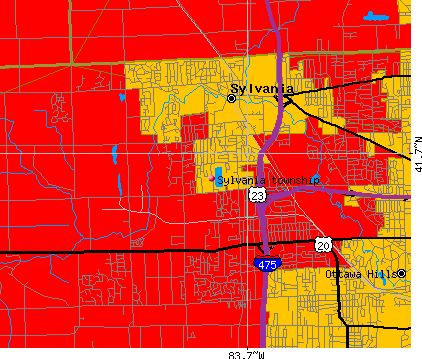
Sylvania township, Lucas County, Ohio (OH) detailed profile
Number of foreign born residents: 6 (62% naturalized citizens)
| Sylvania township: | 5.6% |
| Whole state: | 3.0% |
62% of Sylvania township residents lived in the same house 5 years ago.
Out of people who lived in different houses, 72% lived in this county.
Out of people who lived in different counties, 33% lived in Ohio.
Place of birth for U.S.-born residents:
- This state: 30689
- Northeast: 2334
- Midwest: 5715
- South: 2252
- West: 588
Median price asked for vacant for-sale houses in 2000: $116,800
Percentage of households with unmarried partners: 3.3%
Likely homosexual households (counted as self-reported same-sex unmarried-partner households)
- Lesbian couples: 0.3% of all households
- Gay men: 0.1% of all households
327 people in nursing homes
21 people in agriculture workers' dormitories on farms

Housing units in structures:
- One, detached: 12,910
- One, attached: 1,117
- Two: 278
- 3 or 4: 438
- 5 to 9: 580
- 10 to 19: 648
- 20 to 49: 326
- 50 or more: 689
- Mobile homes: 316
Median worth of mobile homes: $10,900
Housing units in Sylvania township with a mortgage: 9,444 (951 second mortgage, 2,008 home equity loan, 87 both second mortgage and home equity loan)
Houses without a mortgage: 3,162
- Construction (10%)
- Professional, scientific, and technical services (8%)
- Transportation equipment (8%)
- Health care (7%)
- Educational services (5%)
- Accommodation and food services (5%)
- Finance and insurance (3%)
- Health care (20%)
- Educational services (18%)
- Professional, scientific, and technical services (7%)
- Accommodation and food services (5%)
- Finance and insurance (4%)
- Social assistance (3%)
- Food and beverage stores (3%)
- Other management occupations except farmers and farm managers (6%)
- Top executives (5%)
- Other sales and related workers including supervisors (5%)
- Sales representatives, services, wholesale and manufacturing (5%)
- Other production occupations including supervisors (4%)
- Electrical equipment mechanics and other installation, maintenance, and repair occupations including supervisors (4%)
- Engineers (3%)
- Preschool, kindergarten, elementary and middle school teachers (9%)
- Secretaries and administrative assistants (7%)
- Registered nurses (7%)
- Other office and administrative support workers including supervisors (5%)
- Other management occupations except farmers and farm managers (4%)
- Other sales and related workers including supervisors (4%)
- Health technologists and technicians (3%)
Most common first ancestries reported in Sylvania township:
- German (28.2%)
- Polish (10.1%)
- Irish (10.0%)
- English (8.7%)
- United States or American (5.8%)
- Italian (4.8%)
- French (except Basque) (2.6%)
Most common places of birth for the foreign-born residents:
- India (13%)
- China, excluding Hong Kong and Taiwan (9%)
- Canada (6%)
- Korea (5%)
- Russia (5%)
- Lebanon (5%)
- Ukraine (4%)
Means of transportation to work:
- Drove a car alone: 19,273 (89%)
- Carpooled: 1,307 (6%)
- Bus or trolley bus: 107 (0%)
- Railroad: 5 (0%)
- Motorcycle: 10 (0%)
- Bicycle: 12 (0%)
- Walked: 197 (1%)
- Other means: 74 (0%)
- Worked at home: 673 (3%)
Most commonly used house heating fuel:
- Utility gas (88%)
- Electricity (9%)
- Bottled, tank, or LP gas (2%)
- Fuel oil, kerosene, etc. (1%)
327 people in nursing homes
21 people in agriculture workers' dormitories on farms
92.7% of residents of Sylvania township speak English at home.
1.4% of residents speak Spanish at home (65% speak English very well, 26% speak English well, 9% speak English not well, 1% don't speak English at all).
3.0% of residents speak other Indo-European language at home (71% speak English very well, 17% speak English well, 12% speak English not well).
1.7% of residents speak Asian or Pacific Island language at home (46% speak English very well, 32% speak English well, 19% speak English not well, 2% don't speak English at all).
1.2% of residents speak other language at home (82% speak English very well, 18% speak English well).
Household type by relationship:
Households: 43,975- In family households: 38,996 (10,003 male householders, 2,338 female householders)
10,728 spouses, 14,480 children (13,389 natural, 499 adopted, 592 stepchildren), 319 grandchildren, 175 brothers or sisters, 200 parents, 361 other relatives, 392 non-relatives
- In nonfamily households: 4,979 (1,832 male householders (1,475 living alone)), 2,471 female householders (2,337 living alone)), 676 nonrelatives
- In group quarters: 350 (325 institutionalized population)
Size of family households: 5,076 2-persons, 2,622 3-persons, 2,849 4-persons, 1,280 5-persons, 421 6-persons, 93 7-or-more-persons,
Size of nonfamily households: 3,812 1-person, 364 2-persons, 76 3-persons, 43 4-persons, 8 5-persons,
10,031 married couples with children.
1,790 single-parent households (386 men, 1,404 women).
Private vs. public school enrollment:
Students in private schools in grades 1 to 8 (elementary and middle school): 1,414
| Here: | 22.9% |
| Ohio: | 14.2% |
Students in private schools in grades 9 to 12 (high school): 576
| Here: | 18.9% |
| Ohio: | 10.9% |
Students in private undergraduate colleges: 376
| Here: | 22.1% |
| Ohio: | 23.4% |