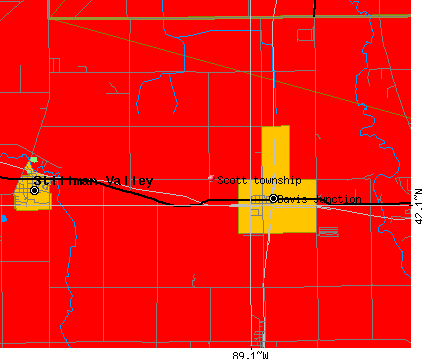
Scott township, Ogle County, Illinois (IL) detailed profile
Number of foreign born residents: 3 (35% naturalized citizens)
| Scott township: | 3.1% |
| Whole state: | 12.3% |
45% of Scott township residents lived in the same house 5 years ago.
Out of people who lived in different houses, 42% lived in this county.
Out of people who lived in different counties, 89% lived in Illinois.
Place of birth for U.S.-born residents:
- This state: 1229
- Northeast: 26
- Midwest: 194
- South: 55
- West: 27
Median price asked for vacant for-sale houses in 2000: $185,400
Percentage of households with unmarried partners: 7.2%
Likely homosexual households (counted as self-reported same-sex unmarried-partner households)
- Lesbian couples: 0.5% of all households
- Gay men: 0.2% of all households

Housing units in structures:
- One, detached: 474
- Mobile homes: 112
Median worth of mobile homes: $35,600
Housing units in Scott township with a mortgage: 210 (23 second mortgage, 28 home equity loan, 0 both second mortgage and home equity loan)
Houses without a mortgage: 94
- Metal and metal products (15%)
- Machinery (10%)
- Construction (10%)
- Agriculture, forestry, fishing and hunting (6%)
- Administrative and support and waste management services (6%)
- Farm supplies merchant wholesalers (5%)
- Truck transportation (5%)
- Health care (10%)
- Finance and insurance (8%)
- Other transportation, and support activities, and couriers (7%)
- Construction (6%)
- Social assistance (5%)
- Public administration (5%)
- Computer and electronic products (4%)
- Metal workers and plastic workers (17%)
- Driver/sales workers and truck drivers (10%)
- Other sales and related workers including supervisors (6%)
- Farmers and farm managers (6%)
- Electrical equipment mechanics and other installation, maintenance, and repair occupations including supervisors (6%)
- Assemblers and fabricators (6%)
- Laborers and material movers, hand (5%)
- Other sales and related workers including supervisors (9%)
- Laborers and material movers, hand (8%)
- Other office and administrative support workers including supervisors (7%)
- Secretaries and administrative assistants (6%)
- Registered nurses (6%)
- Bookkeeping, accounting, and auditing clerks (5%)
- Assemblers and fabricators (5%)
Most common first ancestries reported in Scott township:
- German (30.8%)
- Swedish (13.5%)
- United States or American (11.7%)
- Irish (7.5%)
- English (3.0%)
- Polish (2.9%)
- Italian (2.8%)
Most common places of birth for the foreign-born residents:
- Mexico (65%)
- Germany (12%)
- Other Eastern Europe (10%)
- Asia, n.e.c. (8%)
- Other South America (4%)
Means of transportation to work:
- Drove a car alone: 597 (83%)
- Carpooled: 55 (8%)
- Walked: 5 (1%)
- Other means: 30 (4%)
- Worked at home: 32 (4%)
Most commonly used house heating fuel:
- Utility gas (71%)
- Bottled, tank, or LP gas (18%)
- Electricity (9%)
- Fuel oil, kerosene, etc. (3%)
91.9% of residents of Scott township speak English at home.
5.4% of residents speak Spanish at home (57% speak English very well, 28% speak English well, 15% speak English not well).
2.1% of residents speak other Indo-European language at home (50% speak English very well, 41% speak English not well, 9% don't speak English at all).
0.6% of residents speak other language at home (100% speak English very well).
Household type by relationship:
Households: 1,583- In family households: 1,422 (373 male householders, 73 female householders)
372 spouses, 463 children (433 natural, 0 adopted, 30 stepchildren), 31 grandchildren, 24 brothers or sisters, 14 parents, 35 other relatives, 37 non-relatives
- In nonfamily households: 161 (40 male householders (13 living alone)), 39 female householders (32 living alone)), 82 nonrelatives
Size of family households: 204 2-persons, 83 3-persons, 105 4-persons, 28 5-persons, 9 6-persons, 17 7-or-more-persons,
Size of nonfamily households: 45 1-person, 13 2-persons, 6 3-persons, 6 4-persons, 9 5-persons,
390 married couples with children.
97 single-parent households (35 men, 62 women).
Private vs. public school enrollment:
Students in private schools in grades 1 to 8 (elementary and middle school): 0
| Here: | 0.0% |
| Illinois: | 13.4% |
Students in private schools in grades 9 to 12 (high school): 0
| Here: | 0.0% |
| Illinois: | 11.1% |
Students in private undergraduate colleges: 1
| Here: | 3.6% |
| Illinois: | 25.8% |