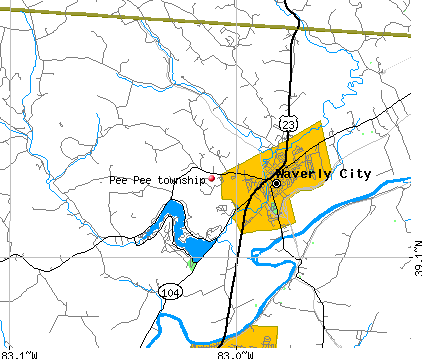
Pee Pee township, Pike County, Ohio (OH) detailed profile
Number of foreign born residents: 1 (43% naturalized citizens)
| Pee Pee township: | 1.1% |
| Whole state: | 3.0% |
54% of Pee Pee township residents lived in the same house 5 years ago.
Out of people who lived in different houses, 59% lived in this county.
Out of people who lived in different counties, 79% lived in Ohio.
Place of birth for U.S.-born residents:
- This state: 5837
- Northeast: 393
- Midwest: 305
- South: 1112
- West: 85
Median price asked for vacant for-sale houses in 2000: $72,000
Percentage of households with unmarried partners: 5.3%
Likely homosexual households (counted as self-reported same-sex unmarried-partner households)
- Lesbian couples: 0.2% of all households
- Gay men: 0.2% of all households
People in group quarters in Pee Pee township, Ohio:
- 69 people in nursing homes
- 23 people in homes for the mentally retarded
- 2 people in local jails and other confinement facilities (including police lockups)
- 2 people in homes for the mentally ill

Housing units in structures:
- One, detached: 2,727
- One, attached: 43
- Two: 82
- 3 or 4: 95
- 5 to 9: 170
- 10 to 19: 43
- 20 to 49: 69
- 50 or more: 70
- Mobile homes: 347
- Boats, RVs, vans, etc.: 46
Median worth of mobile homes: $21,100
Housing units in Pee Pee township with a mortgage: 889 (120 second mortgage, 55 home equity loan, 0 both second mortgage and home equity loan)
Houses without a mortgage: 691
- Furniture and related product manufacturing (10%)
- Construction (10%)
- Public administration (8%)
- Educational services (6%)
- Professional, scientific, and technical services (5%)
- Motor vehicle and parts dealers (5%)
- Paper (5%)
- Health care (16%)
- Educational services (15%)
- Finance and insurance (8%)
- Public administration (8%)
- Furniture and related product manufacturing (6%)
- Department and other general merchandise stores (5%)
- Professional, scientific, and technical services (4%)
- Other production occupations including supervisors (11%)
- Electrical equipment mechanics and other installation, maintenance, and repair occupations including supervisors (5%)
- Driver/sales workers and truck drivers (5%)
- Other management occupations except farmers and farm managers (4%)
- Other sales and related workers including supervisors (4%)
- Retail sales workers except cashiers (4%)
- Other office and administrative support workers including supervisors (3%)
- Preschool, kindergarten, elementary and middle school teachers (9%)
- Secretaries and administrative assistants (8%)
- Other office and administrative support workers including supervisors (7%)
- Health technologists and technicians (7%)
- Cashiers (6%)
- Other management occupations except farmers and farm managers (4%)
- Sales representatives, services, wholesale and manufacturing (4%)
Most common first ancestries reported in Pee Pee township:
- United States or American (23.5%)
- German (19.2%)
- English (14.8%)
- Irish (13.4%)
- Scotch-Irish (3.4%)
- Scottish (3.0%)
- French (except Basque) (1.7%)
Most common places of birth for the foreign-born residents:
- India (40%)
- Philippines (15%)
- Netherlands (10%)
- Other Caribbean (10%)
- United Kingdom (7%)
- Germany (6%)
- Russia (6%)
Means of transportation to work:
- Drove a car alone: 2,688 (84%)
- Carpooled: 341 (11%)
- Bus or trolley bus: 12 (0%)
- Walked: 91 (3%)
- Other means: 5 (0%)
- Worked at home: 68 (2%)
Most commonly used house heating fuel:
- Utility gas (50%)
- Electricity (34%)
- Bottled, tank, or LP gas (8%)
- Fuel oil, kerosene, etc. (7%)
- Wood (2%)
People in group quarters in Pee Pee township, Ohio:
- 69 people in nursing homes
- 23 people in homes for the mentally retarded
- 2 people in local jails and other confinement facilities (including police lockups)
- 2 people in homes for the mentally ill
97.8% of residents of Pee Pee township speak English at home.
0.6% of residents speak Spanish at home (76% speak English very well, 12% speak English well, 12% speak English not well).
1.0% of residents speak other Indo-European language at home (87% speak English very well, 7% speak English well, 7% speak English not well).
0.5% of residents speak Asian or Pacific Island language at home (77% speak English very well, 23% speak English not well).
0.2% of residents speak other language at home (62% speak English very well, 38% speak English well).
Household type by relationship:
Households: 7,742- In family households: 6,467 (1,791 male householders, 413 female householders)
1,767 spouses, 2,147 children (1,955 natural, 29 adopted, 163 stepchildren), 100 grandchildren, 30 brothers or sisters, 24 parents, 51 other relatives, 144 non-relatives
- In nonfamily households: 1,275 (413 male householders (328 living alone)), 716 female householders (687 living alone)), 146 nonrelatives
- In group quarters: 91 (71 institutionalized population)
Size of family households: 1,056 2-persons, 563 3-persons, 364 4-persons, 135 5-persons, 86 6-persons,
Size of nonfamily households: 1,015 1-person, 89 2-persons, 15 3-persons, 10 4-persons,
1,163 married couples with children.
471 single-parent households (95 men, 376 women).
Private vs. public school enrollment:
Students in private schools in grades 1 to 8 (elementary and middle school): 40
| Here: | 4.5% |
| Ohio: | 14.2% |
Students in private schools in grades 9 to 12 (high school): 6
| Here: | 1.4% |
| Ohio: | 10.9% |
Students in private undergraduate colleges: 34
| Here: | 13.7% |
| Ohio: | 23.4% |