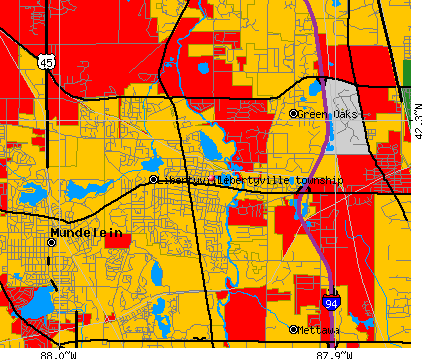
Libertyville township, Lake County, Illinois (IL) detailed profile
Number of foreign born residents: 17 (38% naturalized citizens)
| Libertyville township: | 16.8% |
| Whole state: | 12.3% |
53% of Libertyville township residents lived in the same house 5 years ago.
Out of people who lived in different houses, 56% lived in this county.
Out of people who lived in different counties, 54% lived in Illinois.
Place of birth for U.S.-born residents:
- This state: 27424
- Northeast: 2652
- Midwest: 6800
- South: 1972
- West: 1472
Median price asked for vacant for-sale houses in 2000: $375,000
Percentage of households with unmarried partners: 3.6%
Likely homosexual households (counted as self-reported same-sex unmarried-partner households)
- Lesbian couples: 0.1% of all households
- Gay men: 0.2% of all households
People in group quarters in Libertyville township, Illinois:
- 583 people in nursing homes
- 154 people in homes for the mentally retarded
- 50 people in other nonhousehold living situations
- 39 people in other noninstitutional group quarters
- 38 people in religious group quarters
- 18 people in other workers' dormitories
- 8 people in unknown juvenile institutions
- 5 people in agriculture workers' dormitories on farms
Housing units in structures:
- One, detached: 11,222
- One, attached: 2,247
- Two: 313
- 3 or 4: 712
- 5 to 9: 1,132
- 10 to 19: 969
- 20 to 49: 918
- 50 or more: 464
- Mobile homes: 5
Housing units in Libertyville township with a mortgage: 9,568 (600 second mortgage, 1,721 home equity loan, 38 both second mortgage and home equity loan)
Houses without a mortgage: 2,284
- Professional, scientific, and technical services (9%)
- Finance and insurance (9%)
- Construction (8%)
- Chemicals (6%)
- Educational services (6%)
- Accommodation and food services (5%)
- Health care (4%)
- Educational services (16%)
- Health care (12%)
- Professional, scientific, and technical services (8%)
- Finance and insurance (7%)
- Accommodation and food services (5%)
- Chemicals (5%)
- Miscellaneous manufacturing (3%)
- Other management occupations except farmers and farm managers (7%)
- Sales representatives, services, wholesale and manufacturing (7%)
- Top executives (6%)
- Computer specialists (4%)
- Business operations specialists (4%)
- Other sales and related workers including supervisors (4%)
- Engineers (3%)
- Preschool, kindergarten, elementary and middle school teachers (7%)
- Secretaries and administrative assistants (6%)
- Other management occupations except farmers and farm managers (5%)
- Other sales and related workers including supervisors (4%)
- Other office and administrative support workers including supervisors (4%)
- Business operations specialists (4%)
- Retail sales workers except cashiers (4%)
Most common first ancestries reported in Libertyville township:
- German (18.0%)
- Irish (11.2%)
- Italian (7.8%)
- Polish (7.6%)
- English (6.7%)
- Swedish (4.0%)
- United States or American (2.9%)
Most common places of birth for the foreign-born residents:
- Mexico (38%)
- Poland (7%)
- India (6%)
- China, excluding Hong Kong and Taiwan (6%)
- Korea (4%)
- Philippines (3%)
- Germany (3%)
Means of transportation to work:
- Drove a car alone: 20,419 (80%)
- Carpooled: 2,376 (9%)
- Bus or trolley bus: 139 (1%)
- Streetcar or trolley car: 5 (0%)
- Subway or elevated: 18 (0%)
- Railroad: 901 (4%)
- Taxi: 268 (1%)
- Bicycle: 45 (0%)
- Walked: 319 (1%)
- Other means: 98 (0%)
- Worked at home: 1,012 (4%)
Most commonly used house heating fuel:
- Utility gas (89%)
- Electricity (10%)
- Bottled, tank, or LP gas (1%)
People in group quarters in Libertyville township, Illinois:
- 583 people in nursing homes
- 154 people in homes for the mentally retarded
- 50 people in other nonhousehold living situations
- 39 people in other noninstitutional group quarters
- 38 people in religious group quarters
- 18 people in other workers' dormitories
- 8 people in unknown juvenile institutions
- 5 people in agriculture workers' dormitories on farms
78.1% of residents of Libertyville township speak English at home.
11.1% of residents speak Spanish at home (42% speak English very well, 17% speak English well, 27% speak English not well, 15% don't speak English at all).
7.2% of residents speak other Indo-European language at home (70% speak English very well, 21% speak English well, 8% speak English not well, 2% don't speak English at all).
3.4% of residents speak Asian or Pacific Island language at home (59% speak English very well, 25% speak English well, 12% speak English not well, 4% don't speak English at all).
0.3% of residents speak other language at home (62% speak English very well, 18% speak English well, 10% speak English not well, 10% don't speak English at all).
Household type by relationship:
Households: 47,978- In family households: 42,375 (10,352 male householders, 2,318 female householders)
10,997 spouses, 16,017 children (15,178 natural, 330 adopted, 509 stepchildren), 311 grandchildren, 380 brothers or sisters, 334 parents, 777 other relatives, 889 non-relatives
- In nonfamily households: 5,603 (2,056 male householders (1,599 living alone)), 2,689 female householders (2,378 living alone)), 858 nonrelatives
- In group quarters: 898 (615 institutionalized population)
Size of family households: 4,572 2-persons, 2,754 3-persons, 3,048 4-persons, 1,446 5-persons, 556 6-persons, 294 7-or-more-persons,
Size of nonfamily households: 3,977 1-person, 706 2-persons, 42 3-persons, 14 4-persons, 6 7-or-more-persons,
11,387 married couples with children.
1,676 single-parent households (337 men, 1,339 women).
Private vs. public school enrollment:
Students in private schools in grades 1 to 8 (elementary and middle school): 684
| Here: | 10.3% |
| Illinois: | 13.4% |
Students in private schools in grades 9 to 12 (high school): 232
| Here: | 7.6% |
| Illinois: | 11.1% |
Students in private undergraduate colleges: 429
| Here: | 26.9% |
| Illinois: | 25.8% |