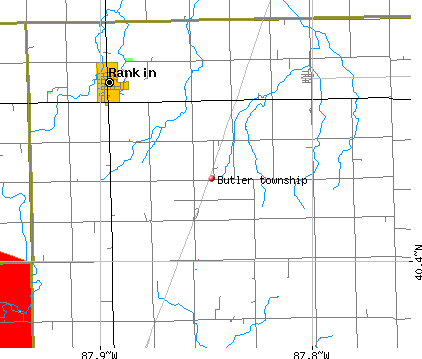
Butler township, Vermilion County, Illinois (IL) detailed profile
Number of foreign born residents: 5 (40% naturalized citizens)
| Butler township: | 4.9% |
| Whole state: | 12.3% |
57% of Butler township residents lived in the same house 5 years ago.
Out of people who lived in different houses, 48% lived in this county.
Out of people who lived in different counties, 68% lived in Illinois.
Place of birth for U.S.-born residents:
- This state: 804
- Northeast: 43
- Midwest: 127
- South: 121
- West: 9
Median price asked for vacant for-sale houses in 2000: $50,000
Percentage of households with unmarried partners: 3.4%
Likely homosexual households (counted as self-reported same-sex unmarried-partner households)
- Lesbian couples: 0.0% of all households
- Gay men: 0.2% of all households
37 people in halfway houses
Housing units in structures:
- One, detached: 436
- One, attached: 9
- 3 or 4: 10
- 5 to 9: 2
- Mobile homes: 56
Median worth of mobile homes: $9,999
Housing units in Butler township with a mortgage: 149 (2 second mortgage, 6 home equity loan, 0 both second mortgage and home equity loan)
Houses without a mortgage: 135
- Food (17%)
- Metal and metal products (13%)
- Construction (9%)
- Agriculture, forestry, fishing and hunting (7%)
- Electrical equipment, appliances, and components (7%)
- Health care (7%)
- Truck transportation (6%)
- Electrical equipment, appliances, and components (19%)
- Health care (13%)
- Accommodation and food services (8%)
- Social assistance (6%)
- Agriculture, forestry, fishing and hunting (6%)
- Food (6%)
- Department and other general merchandise stores (5%)
- Other production occupations including supervisors (12%)
- Driver/sales workers and truck drivers (10%)
- Metal workers and plastic workers (7%)
- Physicians and surgeons (7%)
- Farmers and farm managers (5%)
- Electrical equipment mechanics and other installation, maintenance, and repair occupations including supervisors (5%)
- Material recording, scheduling, dispatching, and distributing workers (5%)
- Other production occupations including supervisors (14%)
- Assemblers and fabricators (12%)
- Building and grounds cleaning and maintenance occupations (6%)
- Cooks and food preparation workers (5%)
- Retail sales workers except cashiers (5%)
- Farmers and farm managers (4%)
- Health technologists and technicians (4%)
Most common first ancestries reported in Butler township:
- German (22.5%)
- United States or American (15.8%)
- English (10.8%)
- Irish (8.1%)
- Pennsylvania German (5.0%)
- Swedish (4.1%)
- Polish (3.1%)
Most common places of birth for the foreign-born residents:
- Mexico (61%)
- Greece (18%)
- United Kingdom (12%)
- Israel (5%)
- Other South America (4%)
Means of transportation to work:
- Drove a car alone: 366 (75%)
- Carpooled: 79 (16%)
- Bus or trolley bus: 1 (0%)
- Walked: 6 (1%)
- Worked at home: 34 (7%)
Most commonly used house heating fuel:
- Utility gas (66%)
- Bottled, tank, or LP gas (18%)
- Electricity (12%)
- Fuel oil, kerosene, etc. (3%)
- Wood (1%)
37 people in halfway houses
91.7% of residents of Butler township speak English at home.
5.6% of residents speak Spanish at home (57% speak English very well, 11% speak English well, 20% speak English not well, 11% don't speak English at all).
2.3% of residents speak other Indo-European language at home (96% speak English very well, 4% speak English well).
0.4% of residents speak other language at home (25% speak English very well, 75% speak English well).
Household type by relationship:
Households: 1,130- In family households: 941 (252 male householders, 51 female householders)
250 spouses, 310 children (245 natural, 25 adopted, 40 stepchildren), 29 grandchildren, 16 brothers or sisters, 0 parents, 9 other relatives, 24 non-relatives
- In nonfamily households: 189 (85 male householders (66 living alone)), 73 female householders (69 living alone)), 31 nonrelatives
- In group quarters: 37 (all institutionalized)
Size of family households: 151 2-persons, 54 3-persons, 55 4-persons, 25 5-persons, 9 6-persons, 9 7-or-more-persons,
Size of nonfamily households: 135 1-person, 19 2-persons, 2 3-persons, 2 4-persons,
220 married couples with children.
41 single-parent households (16 men, 25 women).
Private vs. public school enrollment:
Students in private schools in grades 1 to 8 (elementary and middle school): 7
| Here: | 6.5% |
| Illinois: | 13.4% |
Students in private schools in grades 9 to 12 (high school): 0
| Here: | 0.0% |
| Illinois: | 11.1% |
Students in private undergraduate colleges: 2
| Here: | 11.8% |
| Illinois: | 25.8% |