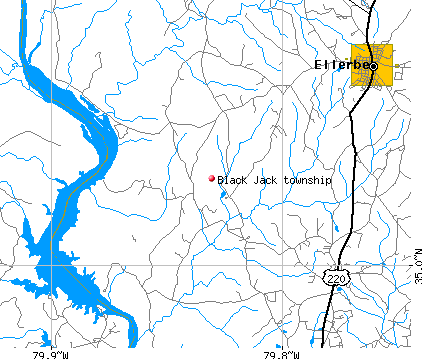
Black Jack township, Richmond County, North Carolina (NC) detailed profile
Number of foreign born residents: 10 (33% naturalized citizens)
| Black Jack township: | 10.0% |
| Whole state: | 5.3% |
57% of Black Jack township residents lived in the same house 5 years ago.
Out of people who lived in different houses, 94% lived in this county.
Out of people who lived in different counties, 100% lived in North Carolina.
Place of birth for U.S.-born residents:
- This state: 424
- Northeast: 0
- Midwest: 0
- South: 24
- West: 3
Percentage of households with unmarried partners: 4.6%
Likely homosexual households (counted as self-reported same-sex unmarried-partner households)
- Lesbian couples: 0.6% of all households
- Gay men: 0.0% of all households

Housing units in structures:
- One, detached: 110
- Mobile homes: 75
Median worth of mobile homes: $52,500
Housing units in Black Jack township with a mortgage: 81 (0 second mortgage, 10 home equity loan, 0 both second mortgage and home equity loan)
Houses without a mortgage: 12
- Construction (22%)
- Agriculture, forestry, fishing and hunting (10%)
- Plastics and rubber products (8%)
- Repair and maintenance (8%)
- Building material and garden equipment and supplies dealers (7%)
- Used merchandise, gift, novelty, and souvenir, and other miscellaneous stores (6%)
- Real estate and rental and leasing (6%)
- Health care (32%)
- Textile mills and textile products (10%)
- Clothing and accessories, including shoe, stores (9%)
- Real estate and rental and leasing (9%)
- Personal and laundry services (9%)
- Religious, grantmaking, civic, professional, and similar organizations (8%)
- Motor vehicle and parts dealers (6%)
- Other production occupations including supervisors (17%)
- Carpenters (15%)
- Other sales and related workers including supervisors (11%)
- Vehicle and mobile equipment mechanics, installers, and repairers (9%)
- Electrical equipment mechanics and other installation, maintenance, and repair occupations including supervisors (9%)
- Agricultural workers including supervisors (6%)
- Assemblers and fabricators (6%)
- Secretaries and administrative assistants (17%)
- Nursing, psychiatric, and home health aides (10%)
- Electrical equipment mechanics and other installation, maintenance, and repair occupations including supervisors (10%)
- Supervisors and other personal care and service workers except personal appearance, transportation, and child care workers (9%)
- Other sales and related workers including supervisors (9%)
- Laborers and material movers, hand (9%)
- Registered nurses (6%)
Most common first ancestries reported in Black Jack township:
- United States or American (40.7%)
- German (15.8%)
- Scottish (14.4%)
- Irish (4.9%)
- Scotch-Irish (3.9%)
- African (1.1%)
Most common places of birth for the foreign-born residents:
- Mexico (100%)
Means of transportation to work:
- Drove a car alone: 207 (89%)
- Carpooled: 15 (6%)
- Worked at home: 11 (5%)
Most commonly used house heating fuel:
- Electricity (44%)
- Bottled, tank, or LP gas (25%)
- Fuel oil, kerosene, etc. (19%)
- Wood (12%)
89.0% of residents of Black Jack township speak English at home.
11.0% of residents speak Spanish at home (73% speak English very well, 23% speak English well, 4% speak English not well).
Household type by relationship:
Households: 496- In family households: 462 (101 male householders, 43 female householders)
112 spouses, 175 children (139 natural, 22 adopted, 14 stepchildren), 0 grandchildren, 14 brothers or sisters, 0 parents, 8 other relatives, 9 non-relatives
- In nonfamily households: 34 (14 male householders (14 living alone)), 20 female householders (20 living alone)), 0 nonrelatives
Size of family households: 59 2-persons, 32 3-persons, 30 4-persons, 8 5-persons, 12 6-persons, 3 7-or-more-persons,
Size of nonfamily households: 34 1-person,
78 married couples with children.
24 single-parent households (6 men, 18 women).
Private vs. public school enrollment:
Students in private schools in grades 1 to 8 (elementary and middle school): 0
| Here: | 0.0% |
| North Carolina: | 8.2% |
Students in private schools in grades 9 to 12 (high school): 2
| Here: | 3.8% |
| North Carolina: | 6.9% |
Students in private undergraduate colleges: 0
| Here: | 0.0% |
| North Carolina: | 20.2% |