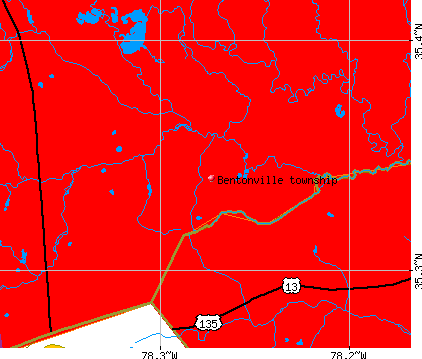
Bentonville township, Johnston County, North Carolina (NC) detailed profile
Number of foreign born residents: 11 (17% naturalized citizens)
| Bentonville township: | 10.7% |
| Whole state: | 5.3% |
64% of Bentonville township residents lived in the same house 5 years ago.
Out of people who lived in different houses, 45% lived in this county.
Out of people who lived in different counties, 76% lived in North Carolina.
Place of birth for U.S.-born residents:
- This state: 1562
- Northeast: 36
- Midwest: 13
- South: 144
- West: 32
Median price asked for vacant for-sale houses in 2000: $80,000
Percentage of households with unmarried partners: 4.8%
Likely homosexual households (counted as self-reported same-sex unmarried-partner households)
- Lesbian couples: 0.4% of all households
- Gay men: 0.4% of all households

Housing units in structures:
- One, detached: 557
- Two: 8
- Mobile homes: 232
Median worth of mobile homes: $40,400
Housing units in Bentonville township with a mortgage: 152 (7 second mortgage, 38 home equity loan, 0 both second mortgage and home equity loan)
Houses without a mortgage: 132
- Construction (27%)
- Agriculture, forestry, fishing and hunting (6%)
- Food (5%)
- Furniture and related product manufacturing (5%)
- Accommodation and food services (5%)
- Health care (4%)
- Public administration (4%)
- Health care (22%)
- Educational services (15%)
- Public administration (7%)
- Arts, entertainment, and recreation (5%)
- Finance and insurance (5%)
- Food and beverage stores (4%)
- Department and other general merchandise stores (4%)
- Carpenters (10%)
- Material moving workers except supervisors and laborers and material movers, hand (7%)
- Driver/sales workers and truck drivers (7%)
- Assemblers and fabricators (7%)
- Farmers and farm managers (6%)
- Metal workers and plastic workers (6%)
- Electrical equipment mechanics and other installation, maintenance, and repair occupations including supervisors (5%)
- Other office and administrative support workers including supervisors (17%)
- Health technologists and technicians (7%)
- Secretaries and administrative assistants (7%)
- Preschool, kindergarten, elementary and middle school teachers (7%)
- Cashiers (5%)
- Other production occupations including supervisors (5%)
- Retail sales workers except cashiers (5%)
Most common first ancestries reported in Bentonville township:
- United States or American (40.2%)
- English (7.0%)
- German (1.9%)
- French (except Basque) (1.4%)
- Irish (1.3%)
- Scottish (1.0%)
- Scotch-Irish (0.8%)
Most common places of birth for the foreign-born residents:
- Mexico (93%)
- India (7%)
Means of transportation to work:
- Drove a car alone: 717 (83%)
- Carpooled: 115 (13%)
- Walked: 5 (1%)
- Other means: 19 (2%)
- Worked at home: 7 (1%)
Most commonly used house heating fuel:
- Bottled, tank, or LP gas (59%)
- Electricity (23%)
- Utility gas (10%)
- Fuel oil, kerosene, etc. (4%)
- Wood (4%)
83.6% of residents of Bentonville township speak English at home.
15.1% of residents speak Spanish at home (24% speak English very well, 40% speak English well, 32% speak English not well, 5% don't speak English at all).
1.3% of residents speak other Indo-European language at home (84% speak English very well, 16% don't speak English at all).
Household type by relationship:
Households: 1,981- In family households: 1,793 (420 male householders, 124 female householders)
505 spouses, 683 children (663 natural, 8 adopted, 12 stepchildren), 12 grandchildren, 6 brothers or sisters, 4 parents, 29 other relatives, 10 non-relatives
- In nonfamily households: 188 (80 male householders (71 living alone)), 89 female householders (84 living alone)), 19 nonrelatives
Size of family households: 220 2-persons, 139 3-persons, 107 4-persons, 23 5-persons, 50 6-persons, 5 7-or-more-persons,
Size of nonfamily households: 155 1-person, 5 2-persons, 9 3-persons,
319 married couples with children.
82 single-parent households (27 men, 55 women).
Private vs. public school enrollment:
Students in private schools in grades 1 to 8 (elementary and middle school): 33
| Here: | 13.2% |
| North Carolina: | 8.2% |
Students in private schools in grades 9 to 12 (high school): 7
| Here: | 6.0% |
| North Carolina: | 6.9% |
Students in private undergraduate colleges: 0
| Here: | 0.0% |
| North Carolina: | 20.2% |