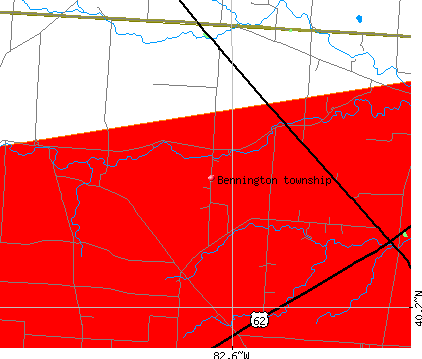
Bennington township, Licking County, Ohio (OH) detailed profile
Number of foreign born residents: 1 (43% naturalized citizens)
| Bennington township: | 1.1% |
| Whole state: | 3.0% |
65% of Bennington township residents lived in the same house 5 years ago.
Out of people who lived in different houses, 26% lived in this county.
Out of people who lived in different counties, 90% lived in Ohio.
Place of birth for U.S.-born residents:
- This state: 1118
- Northeast: 45
- Midwest: 30
- South: 92
- West: 22
Median price asked for vacant for-sale houses in 2000: $75,000
Percentage of households with unmarried partners: 2.3%
Likely homosexual households (counted as self-reported same-sex unmarried-partner households)
- Lesbian couples: 0.5% of all households
- Gay men: 0.0% of all households
Housing units in structures:
- One, detached: 426
- Mobile homes: 26
Median worth of mobile homes: $9,999
Housing units in Bennington township with a mortgage: 231 (34 second mortgage, 46 home equity loan, 6 both second mortgage and home equity loan)
Houses without a mortgage: 19
- Construction (19%)
- Broadcasting, internet publishing, and telecommunications services (6%)
- U. S. Postal service (6%)
- Professional, scientific, and technical services (6%)
- Plastics and rubber products (6%)
- Electrical equipment, appliances, and components (5%)
- Nonmetallic mineral products (4%)
- Educational services (18%)
- Health care (14%)
- Finance and insurance (11%)
- Accommodation and food services (10%)
- Professional, scientific, and technical services (5%)
- Wood products (4%)
- Clothing and accessories, including shoe, stores (4%)
- Other production occupations including supervisors (15%)
- Electrical equipment mechanics and other installation, maintenance, and repair occupations including supervisors (14%)
- Material recording, scheduling, dispatching, and distributing workers (8%)
- Vehicle and mobile equipment mechanics, installers, and repairers (6%)
- Other sales and related workers including supervisors (6%)
- Building and grounds cleaning and maintenance occupations (5%)
- Carpenters (5%)
- Secretaries and administrative assistants (9%)
- Cooks and food preparation workers (7%)
- Information and record clerks except customer service representatives (6%)
- Registered nurses (5%)
- Food and beverage serving workers except waiters/waitresses (5%)
- Other management occupations except farmers and farm managers (5%)
- Cashiers (5%)
Most common first ancestries reported in Bennington township:
- German (23.4%)
- United States or American (20.4%)
- Irish (14.8%)
- English (11.5%)
- European (7.9%)
- Scottish (3.5%)
- Dutch (2.9%)
Most common places of birth for the foreign-born residents:
- Canada (57%)
- Australia (43%)
Means of transportation to work:
- Drove a car alone: 604 (91%)
- Carpooled: 39 (6%)
- Worked at home: 24 (4%)
Most commonly used house heating fuel:
- Bottled, tank, or LP gas (38%)
- Fuel oil, kerosene, etc. (20%)
- Utility gas (18%)
- Electricity (14%)
- Wood (9%)
98.1% of residents of Bennington township speak English at home.
0.5% of residents speak Spanish at home (100% speak English very well).
1.3% of residents speak other Indo-European language at home (100% speak English very well).
Household type by relationship:
Households: 1,334- In family households: 1,237 (321 male householders, 43 female householders)
342 spouses, 465 children (429 natural, 19 adopted, 17 stepchildren), 40 grandchildren, 0 brothers or sisters, 8 parents, 9 other relatives, 9 non-relatives
- In nonfamily households: 97 (53 male householders (46 living alone)), 27 female householders (16 living alone)), 17 nonrelatives
Size of family households: 141 2-persons, 60 3-persons, 93 4-persons, 41 5-persons, 15 6-persons, 14 7-or-more-persons,
Size of nonfamily households: 62 1-person, 18 2-persons,
326 married couples with children.
24 single-parent households (4 men, 20 women).
Private vs. public school enrollment:
Students in private schools in grades 1 to 8 (elementary and middle school): 0
| Here: | 0.0% |
| Ohio: | 14.2% |
Students in private schools in grades 9 to 12 (high school): 0
| Here: | 0.0% |
| Ohio: | 10.9% |
Students in private undergraduate colleges: 12
| Here: | 33.3% |
| Ohio: | 23.4% |