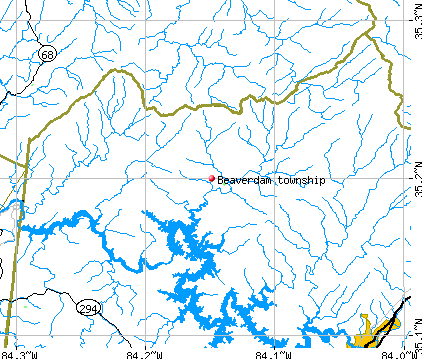
Beaverdam township, Cherokee County, North Carolina (NC) detailed profile
Number of foreign born residents: 2 (32% naturalized citizens)
| Beaverdam township: | 2.2% |
| Whole state: | 5.3% |
66% of Beaverdam township residents lived in the same house 5 years ago.
Out of people who lived in different houses, 44% lived in this county.
Out of people who lived in different counties, 39% lived in North Carolina.
Place of birth for U.S.-born residents:
- This state: 414
- Northeast: 75
- Midwest: 44
- South: 333
- West: 0
Median price asked for vacant for-sale houses in 2000: $32,500
Percentage of households with unmarried partners: 1.6%
Likely homosexual households (counted as self-reported same-sex unmarried-partner households)
- Lesbian couples: 0.0% of all households
- Gay men: 0.3% of all households

Housing units in structures:
- One, detached: 426
- One, attached: 23
- Two: 9
- Mobile homes: 88
- Boats, RVs, vans, etc.: 21
Median worth of mobile homes: $45,000
Housing units in Beaverdam township with a mortgage: 58 (0 second mortgage, 0 home equity loan, 0 both second mortgage and home equity loan)
Houses without a mortgage: 84
- Construction (31%)
- Computer and electronic products (11%)
- Truck transportation (10%)
- Broadcasting, internet publishing, and telecommunications services (8%)
- Machinery (7%)
- Miscellaneous manufacturing (5%)
- Public administration (5%)
- Health care (20%)
- Educational services (17%)
- Computer and electronic products (10%)
- Building material and garden equipment and supplies dealers (9%)
- Miscellaneous manufacturing (8%)
- Pharmacies and drug stores (8%)
- Food and beverage stores (6%)
- Electrical equipment mechanics and other installation, maintenance, and repair occupations including supervisors (20%)
- Top executives (14%)
- Driver/sales workers and truck drivers (13%)
- Other management occupations except farmers and farm managers (10%)
- Other office and administrative support workers including supervisors (7%)
- Pipelayers, plumbers, pipefitters, and steamfitters (7%)
- Other protective service workers including supervisors (4%)
- Secretaries and administrative assistants (18%)
- Assemblers and fabricators (13%)
- Other office and administrative support workers including supervisors (11%)
- Health technologists and technicians (8%)
- Information and record clerks except customer service representatives (8%)
- Cooks and food preparation workers (7%)
- Other management occupations except farmers and farm managers (6%)
Most common first ancestries reported in Beaverdam township:
- United States or American (40.9%)
- English (14.7%)
- German (6.3%)
- Irish (5.2%)
- French (except Basque) (4.6%)
- Swedish (4.4%)
- Scotch-Irish (4.1%)
Most common places of birth for the foreign-born residents:
- Canada (68%)
- Germany (32%)
Means of transportation to work:
- Drove a car alone: 195 (75%)
- Carpooled: 32 (12%)
- Walked: 17 (7%)
- Other means: 5 (2%)
- Worked at home: 10 (4%)
Most commonly used house heating fuel:
- Bottled, tank, or LP gas (30%)
- Electricity (26%)
- Wood (22%)
- Fuel oil, kerosene, etc. (20%)
- Utility gas (2%)
97.0% of residents of Beaverdam township speak English at home.
0.9% of residents speak Spanish at home (100% speak English very well).
2.1% of residents speak other Indo-European language at home (100% speak English very well).
Household type by relationship:
Households: 885- In family households: 782 (212 male householders, 39 female householders)
228 spouses, 246 children (177 natural, 6 adopted, 63 stepchildren), 29 grandchildren, 0 brothers or sisters, 14 parents, 14 other relatives, 0 non-relatives
- In nonfamily households: 103 (37 male householders (33 living alone)), 61 female householders (61 living alone)), 5 nonrelatives
Size of family households: 139 2-persons, 25 3-persons, 53 4-persons, 34 6-persons,
Size of nonfamily households: 94 1-person, 4 2-persons,
145 married couples with children.
14 single-parent households (6 men, 8 women).
Private vs. public school enrollment:
Students in private schools in grades 1 to 8 (elementary and middle school): 0
| Here: | 0.0% |
| North Carolina: | 8.2% |
Students in private schools in grades 9 to 12 (high school): 0
| Here: | 0.0% |
| North Carolina: | 6.9% |
Students in private undergraduate colleges: 0
| Here: | 0.0% |
| North Carolina: | 20.2% |