Texas
Ethnic groups
As white settlers pushed toward Texas during the 19th century, many Indian groups moved west and south into the region. The most notable tribes were the Comanche, Wichita, Kiowa, Apache, Choctaw, and Cherokee. Also entering in significant numbers were the Kickapoo and Potawatomi from Illinois, the Delaware and Shawnee from Missouri, the Quapaw from Arkansas, and the Creek from Alabama and Georgia. One of the few Texas tribes that has survived to the present time as an identifiable group is the Alabama-Coushatta, who inhabit a 4,351-acre (1,761-hectare) reservation in Polk County, 90 mi (145 km) northeast of Houston. The Tigua, living in Texas since the 1680s, were recognized by a federal law in 1968 that transferred all responsibility for them to the state of Texas. The two Indian reservations number about 500 persons each. Overall, at the 2000 census, there were 118,362 American Indians living in Texas.
Blacks have been integral to the history of Texas ever since a black Moor named Estevanico was shipwrecked near present-day Galveston in 1528. By 1860, Texas had 182,921 blacks, or 30% of the total population, of whom only 355 were free. Once emancipated, blacks made effective use of the franchise, electing two of their number to the state senate and nine to the house in 1868. After the return of the Democratic Party to political dominance, however, the power of blacks steadily diminished. Since then, their numbers have grown, but their proportion of the total population has dwindled, although Houston and Dallas were, respectively, about 25% and 26% black at the 2000 census. In 2000, 2,404,566 blacks lived in the state, which ranked 2nd behind New York in the size of its black population.
Hispanics and Latinos, the largest minority in Texas, numbered 6,669,666 in 2000, representing 32% of the population, an increase over 1990, when Texans of Hispanic origin represented 25.5% of the total. Mostly of Mexican ancestry, they are nevertheless a heterogeneous group, divided by history, geography, and economic circumstances. Hispanics have been elected to the state legislature and to the US Congress. In 1980, the Houston independent school district, the state's largest, reported more Hispanic students than Anglos for the first time in its history.
Altogether, Texas has nearly 30 identifiable ethnic groups. Certain areas of central Texas are heavily Germanic and Czech. The first permanent Polish colony in the US was established at Panna Maria, near San Antonio, in 1854. Texas has one of the largest colonies of Wends in the world, principally at Serbin in central Texas. Significant numbers of Danes, Swedes, and Norwegians have also settled in Texas.
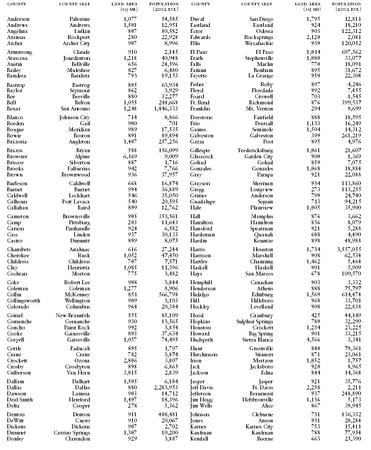
Texas Counties, County Seats, and County Areas and Populations
| COUNTY | COUNTY SEAT | LAND AREA (SQ MI) | POPULATION (2002 EST.) | COUNTY | COUNTY SEAT | LAND AREA (SQ MI) | POPULATION (2002 EST.) |
| Anderson | Palestine | 1,077 | 54,585 | Duval | San Diego | 1,795 | 12,811 |
| Andrews | Andrews | 1,501 | 12,951 | Eastland | Eastland | 924 | 18,210 |
| Angelina | Lufkin | 807 | 80,582 | Ector | Odessa | 903 | 122,312 |
| Aransas | Rockport | 280 | 22,928 | Edwards | Rocksprings | 2,120 | 2,081 |
| Archer | Archer City | 907 | 8,996 | Ellis | Waxahachie | 939 | 120,052 |
| Armstrong | Claude | 910 | 2,145 | El Paso | El Paso | 1,014 | 697,562 |
| Atascosa | Jourdanton | 1,218 | 40,948 | Erath | Stephenville | 1,080 | 33,077 |
| Austin | Bellville | 656 | 24,596 | Falls | Marlin | 770 | 18,091 |
| Bailey | Muleshoe | 827 | 6,480 | Fannin | Bonham | 895 | 31,672 |
| Bandera | Bandera | 793 | 19,153 | Fayette | La Grange | 950 | 22,304 |
| Bastrop | Bastrop | 895 | 63,934 | Fisher | Roby | 897 | 4,246 |
| Baylor | Seymour | 862 | 3,929 | Floyd | Floydada | 992 | 7,455 |
| Bee | Beeville | 880 | 32,277 | Foard | Crowell | 703 | 1,545 |
| Bell | Belton | 1,055 | 244,668 | Ft. Bend | Richmond | 876 | 399,537 |
| Bexar | San Antonio | 1,248 | 1,446,333 | Franklin | Mt. Vernon | 294 | 9,699 |
| Blanco | Johnson City | 714 | 8,866 | Freestone | Fairfield | 888 | 18,595 |
| Borden | Gail | 900 | 701 | Frio | Pearsall | 1,133 | 16,249 |
| Bosque | Meridian | 989 | 17,535 | Gaines | Seminole | 1,504 | 14,312 |
| Bowie | Boston | 891 | 89,894 | Galveston | Galveston | 399 | 261,219 |
| Brazoria | Angleton | 1,407 | 257,256 | Garza | Post | 895 | 4,976 |
| Brazos | Bryan | 588 | 156,099 | Gillespie | Fredericksburg | 1,061 | 21,607 |
| Brewster | Alpine | 6,169 | 9,009 | Glasscock | Garden City | 900 | 1,369 |
| Briscoe | Silverton | 887 | 1,716 | Goliad | Goliad | 859 | 7,075 |
| Brooks | Falfurrias | 942 | 7,766 | Gonzales | Gonzales | 1,068 | 18,884 |
| Brown | Brownwood | 936 | 37,957 | Gray | Pampa | 921 | 22,088 |
| Burleson | Caldwell | 668 | 16,874 | Grayson | Sherman | 934 | 113,860 |
| Burnet | Burnet | 994 | 36,889 | Gregg | Longview | 273 | 113,255 |
| Caldwell | Lockhart | 546 | 35,050 | Grimes | Anderson | 799 | 24,740 |
| Calhoun | Port Lavaca | 540 | 20,595 | Guadalupe | Seguin | 713 | 94,215 |
| Callahan | Baird | 899 | 12,762 | Hale | Plainview | 1,005 | 35,900 |
| Cameron | Brownsville | 905 | 353,561 | Hall | Memphis | 876 | 3,662 |
| Camp | Pittsburg | 203 | 11,643 | Hamilton | Hamilton | 836 | 8,079 |
| Carson | Panhandle | 924 | 6,582 | Hansford | Spearman | 921 | 5,288 |
| Cass | Linden | 937 | 30,133 | Hardeman | Quanah | 688 | 4,490 |
| Castro | Dimmitt | 899 | 8,075 | Hardin | Kountze | 898 | 48,988 |
| Chambers | Anahuac | 616 | 27,244 | Harris | Houston | 1,734 | 3,557,055 |
| Cherokee | Rusk | 1,052 | 47,450 | Harrison | Marshall | 908 | 62,534 |
| Childress | Childress | 707 | 7,571 | Hartley | Channing | 1,462 | 5,464 |
| Clay | Henrietta | 1,085 | 11,396 | Haskell | Haskell | 901 | 5,909 |
| Cochran | Morton | 775 | 3,482 | Hays | San Marcos | 678 | 109,570 |
| Coke | Robert Lee | 908 | 3,844 | Hemphill | Canadian | 903 | 3,332 |
| Coleman | Coleman | 1,277 | 8,906 | Henderson | Athens | 888 | 75,797 |
| Collin | McKenney | 851 | 566,798 | Hidalgo | Edinburg | 1,569 | 614,474 |
| Collingsworth | Wellington | 909 | 3,103 | Hill | Hillsboro | 968 | 33,701 |
| Colorado | Columbus | 964 | 20,384 | Hockley | Levelland | 908 | 22,838 |
| Comal | New Braunfels | 555 | 85,109 | Hood | Granbury | 425 | 44,149 |
| Comanche | Comanche | 930 | 13,565 | Hopkins | Sulphur Springs | 789 | 32,299 |
| Concho | Paint Rock | 992 | 3,854 | Houston | Crockett | 1,234 | 23,225 |
| Cooke | Gainesville | 893 | 37,634 | Howard | Big Spring | 901 | 33,215 |
| Coryell | Gatesville | 1,057 | 74,495 | Hudspeth | Sierra Blanca | 4,566 | 3,341 |
| Cottle | Paducah | 895 | 1,797 | Hunt | Greenville | 840 | 79,361 |
| Crane | Crane | 782 | 3,874 | Hutchinson | Stinnett | 871 | 23,061 |
| Crockett | Ozona | 2,806 | 3,807 | Irion | Mertzon | 1,052 | 1,757 |
| Crosby | Crosbyton | 898 | 6,865 | Jack | Jacksboro | 920 | 8,965 |
| Culberson | Van Horn | 3,815 | 2,839 | Jackson | Edna | 844 | 14,364 |
| Dallam | Dalhart | 1,505 | 6,184 | Jasper | Jasper | 921 | 35,776 |
| Dallas | Dallas | 880 | 2,283,953 | Jeff Davis | Ft. Davis | 2,258 | 2,211 |
| Dawson | Lamesa | 903 | 14,712 | Jefferson | Beaumont | 937 | 248,890 |
| Deaf Smith | Hereford | 1,497 | 18,396 | Jim Hogg | Hebbronville | 1,136 | 5,173 |
| Delta | Cooper | 278 | 5,362 | Jim Wells | Alice | 867 | 39,945 |
| Denton | Denton | 911 | 488,481 | Johnson | Cleburne | 731 | 136,332 |
| DeWitt | Cuero | 910 | 20,067 | Jones | Anson | 931 | 20,284 |
| Dickens | Dickens | 907 | 2,702 | Karnes | Karnes City | 753 | 15,411 |
| Dimmet | Carrizo Springs | 1,307 | 10,200 | Kaufman | Kaufman | 788 | 77,954 |
| Donley | Clarendon | 929 | 3,887 | Kendall | Boerne | 663 | 25,390 |
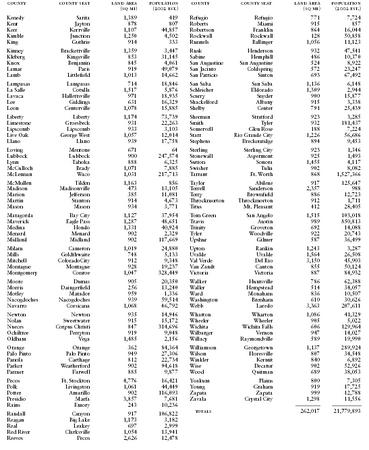
Texas Counties, County Seats, and County Areas and Populations
| COUNTY | COUNTY SEAT | LAND AREA (SQ MI) | POPULATION (2002 EST.) | COUNTY | COUNTY SEAT | LAND AREA (SQ MI) | POPULATION (2002 EST.) |
| Kenedy | Sarita | 1,389 | 419 | Refugio | Refugio | 771 | 7,724 |
| Kent | Jayton | 878 | 807 | Roberts | Miami | 915 | 857 |
| Kerr | Kerrville | 1,107 | 44,857 | Robertson | Franklin | 864 | 16,044 |
| Kimble | Junction | 1,250 | 4,502 | Rockwall | Rockwall | 128 | 50,858 |
| King | Guthrie | 914 | 333 | Runnels | Ballinger | 1,056 | 11,123 |
| Kinney | Brackettville | 1,359 | 3,447 | Rusk | Henderson | 932 | 47,541 |
| Kleberg | Kingsville | 853 | 31,145 | Sabine | Hemphill | 486 | 10,370 |
| Knox | Benjamin | 845 | 4,061 | San Augustine | San Augustine | 524 | 8,922 |
| Lamar | Paris | 919 | 49,079 | San Jacinto | Coldspring | 572 | 23,247 |
| Lamb | Littlefield | 1,013 | 14,662 | San Patricio | Sinton | 693 | 67,492 |
| Lampasas | Lampasas | 714 | 18,846 | San Saba | San Saba | 1,136 | 6,148 |
| La Salle | Cotulla | 1,517 | 5,876 | Schleicher | Eldorado | 1,309 | 2,944 |
| Lavaca | Hallettsville | 971 | 18,935 | Scurry | Snyder | 900 | 15,877 |
| Lee | Giddings | 631 | 16,329 | Shackelford | Albany | 915 | 3,338 |
| Leon | Centerville | 1,078 | 15,885 | Shelby | Center | 791 | 25,439 |
| Liberty | Liberty | 1,174 | 73,739 | Sherman | Stratford | 923 | 3,285 |
| Limestone | Groesbeck | 931 | 22,263 | Smith | Tyler | 932 | 181,437 |
| Lipscomb | Lipscomb | 933 | 3,103 | Somervell | Glen Rose | 188 | 7,224 |
| Live Oak | George West | 1,057 | 12,014 | Starr | Rio Grande City | 1,226 | 56,686 |
| Llano | Llano | 939 | 17,758 | Stephens | Breckenridge | 894 | 9,453 |
| Loving | Mentone | 671 | 64 | Sterling | Sterling City | 923 | 1,346 |
| Lubbock | Lubbock | 900 | 247,574 | Stonewall | Aspermont | 925 | 1,493 |
| Lynn | Tahoka | 888 | 6,325 | Sutton | Sonora | 1,455 | 4,117 |
| McCulloch | Brady | 1,071 | 7,885 | Swisher | Tulia | 902 | 8,082 |
| McLennan | Waco | 1,031 | 217,713 | Tarrant | Ft. Worth | 868 | 1,527,366 |
| McMullen | Tilden | 1,163 | 856 | Taylor | Abilene | 917 | 125,647 |
| Madison | Madisonville | 473 | 13,105 | Terrell | Sanderson | 2,357 | 988 |
| Marion | Jefferson | 385 | 11,081 | Terry | Brownfield | 886 | 12,723 |
| Martin | Stanton | 914 | 4,673 | Throckmorton | Throckmorton | 912 | 1,711 |
| Mason | Mason | 934 | 3,771 | Titus | Mt. Pleasant | 412 | 28,405 |
| Matagorda | Bay City | 1,127 | 37,954 | Tom Green | San Angelo | 1,515 | 103,018 |
| Maverick | Eagle Pass | 1,287 | 48,651 | Travis | Austin | 989 | 850,813 |
| Medina | Hondo | 1,331 | 40,924 | Trinity | Groveton | 692 | 14,088 |
| Menard | Menard | 902 | 2,329 | Tyler | Woodville | 922 | 20,743 |
| Midland | Midland | 902 | 117,669 | Upshur | Gilmer | 587 | 36,499 |
| Milam | Cameron | 1,019 | 24,880 | Upton | Rankin | 1,243 | 3,287 |
| Mills | Goldthwaite | 748 | 5,133 | Uvalde | Uvalde | 1,564 | 26,508 |
| Mitchell | ColoradoCity | 912 | 9,348 | Val Verde | Del Rio | 3,150 | 45,903 |
| Montague | Montague | 928 | 19,237 | Van Zandt | Canton | 855 | 50,124 |
| Montgomery | Conroe | 1,047 | 328,449 | Victoria | Victoria | 887 | 84,932 |
| Moore | Dumas | 905 | 20,350 | Walker | Huntsville | 786 | 62,388 |
| Morris | Daingerfield | 256 | 13,240 | Waller | Hempstead | 514 | 34,057 |
| Motley | Matador | 959 | 1,336 | Ward | Monahans | 836 | 10,507 |
| Nacogdoches | Nacogdoches | 939 | 59,514 | Washington | Brenham | 610 | 30,626 |
| Navarro | Corsicana | 1,068 | 46,792 | Webb | Laredo | 3,363 | 207,611 |
| Newton | Newton | 935 | 14,946 | Wharton | Wharton | 1,086 | 41,329 |
| Nolan | Sweetwater | 915 | 15,172 | Wheeler | Wheeler | 905 | 5,022 |
| Nueces | Corpus Christi | 847 | 314,696 | Wichita | Wichita Falls | 606 | 129,964 |
| Ochiltree | Perryton | 919 | 9,048 | Wilbarger | Vernon | 947 | 14,027 |
| Oldham | Vega | 1,485 | 2,156 | Willacy | Raymondville | 589 | 19,990 |
| Orange | Orange | 362 | 84,364 | Williamson | Georgetown | 1,137 | 289,924 |
| Palo Pinto | Palo Pinto | 949 | 27,306 | Wilson | Floresville | 807 | 34,548 |
| Panola | Carthage | 812 | 22,734 | Winkler | Kermit | 840 | 6,892 |
| Parker | Weatherford | 902 | 94,618 | Wise | Decatur | 902 | 52,926 |
| Parmer | Farwell | 885 | 9,877 | Wood | Quitman | 689 | 38,053 |
| Pecos | Ft. Stockton | 4,776 | 16,421 | Yoakum | Plains | 800 | 7,305 |
| Polk | Livingston | 1,061 | 44,449 | Young | Graham | 919 | 17,725 |
| Potter | Amarillo | 902 | 116,093 | Zapata | Zapata | 999 | 12,788 |
| Presidio | Marfa | 3,857 | 7,681 | Zavala | Crystal City | 1,298 | 11,556 |
| Rains | Emory | 243 | 10,236 | ————— | —————— | ||
| Randall | Canyon | 917 | 106,822 | totals | 262,017 | 21,779,893 | |
| Reagan | Big Lake | 1,173 | 3,182 | ||||
| Real | Leakey | 697 | 2,999 | ||||
| Red River | Clarksville | 1,054 | 13,941 | ||||
| Reeves | Pecos | 2,626 | 12,478 |
As of 2000, foreign-born Texans numbered 2,899,642 (13.9% of the total population). In the same year, Asians numbered 562,319 (the 3rd-largest Asian population among the 50 states). The 2000 census counted 105,829 Chinese (nearly double the 1990 total of 55,023), 58,340 Filipinos, 129,365 Asian Indians (more than triple the 1990 figure of 40,506), 45,571 Koreans, 17,120 Japanese, and 10,114 Laotians. Of the 134,961 Vietnamese (up from 60,649 in 1990), many were refugees who resettled in Texas beginning in 1975. Pacific Islanders numbered 14,434 in 2000.
The term "Anglos" denotes all whites except Spanish-surnamed or Spanish-speaking individuals.