Maryland
Public finance
The state budget, prepared by the Department of Budget and Management, is submitted annually by the governor to the general assembly for amendment and approval. The fiscal year runs from 1 July to 30 June.
Since 1995, Maryland has implemented over 25 different tax cuts, the most dramatic of which was a 10% income tax cut. Despite the cuts in revenue; in 1999, fiscal revenues exceeded estimates by $320 million, and year 2000 revenues were expected to exceed estimates by $575 million. Total revenues for 2001 were forecast at $19.6 billion. In December 2000, a special commission concluded that that the state needed to increase education spending to avoid law suits about equitable funding. By 2001/02, however, the main concern was about budget shortfalls. Maryland had begun 2000/01 with a starting balance equal to 13.6% of expenditures. By 2000/01, the starting balance had dropped to 7.8% of expenditures, and continued to drop, to 5.3% of expenditures in 2002/03, and to 4.7% in 2003/04, as the government grappled with revenue shortfalls and rising costs. For 2002/03, Maryland's budget deficit was estimated at 5.5% of the state budget, and for 2003/04, it was projected to increase to 11% of the state budget.
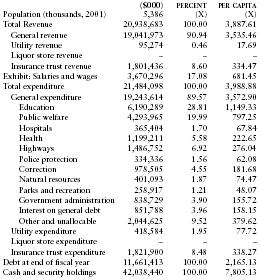
The following table from the US Census Bureau contains information on revenues, expenditures, indebtedness, and cash/securities for 2001.
| ($000) | PERCENT | PER CAPITA | |
| Population (thousands, 2001) | 5,386 | (X) | (X) |
| Total Revenue | 20,938,683 | 100.00 | 3,887.61 |
| General revenue | 19,041,973 | 90.94 | 3,535.46 |
| Utility revenue | 95,274 | 0.46 | 17.69 |
| Liquor store revenue | – | – | – |
| Insurance trust revenue | 1,801,436 | 8.60 | 334.47 |
| Exhibit: Salaries and wages | 3,670,296 | 17.08 | 681.45 |
| Total expenditure | 21,484,098 | 100.00 | 3,988.88 |
| General expenditure | 19,243,614 | 89.57 | 3,572.90 |
| Education | 6,190,289 | 28.81 | 1,149.33 |
| Public welfare | 4,293,965 | 19.99 | 797.25 |
| Hospitals | 365,404 | 1.70 | 67.84 |
| Health | 1,199,211 | 5.58 | 222.65 |
| Highways | 1,486,752 | 6.92 | 276.04 |
| Police protection | 334,336 | 1.56 | 62.08 |
| Correction | 978,505 | 4.55 | 181.68 |
| Natural resources | 401,093 | 1.87 | 74.47 |
| Parks and recreation | 258,917 | 1.21 | 48.07 |
| Government administration | 838,729 | 3.90 | 155.72 |
| Interest on general debt | 851,788 | 3.96 | 158.15 |
| Other and unallocable | 2,044,625 | 9.52 | 379.62 |
| Utility expenditure | 418,584 | 1.95 | 77.72 |
| Liquor store expenditure | – | – | – |
| Insurance trust expenditure | 1,821,900 | 8.48 | 338.27 |
| Debt at end of fiscal year | 11,661,413 | 100.00 | 2,165.13 |
| Cash and security holdings | 42,038,440 | 100.00 | 7,805.13 |