Races in Yonkers, New York (NY) Detailed Stats
Data:
Races - White alone (%)
Races - White alone (% change since 2000)
Races - Black alone (%)
Races - Black alone (% change since 2000)
Races - American Indian alone (%)
Races - American Indian alone (% change since 2000)
Races - Asian alone (%)
Races - Asian alone (% change since 2000)
Races - Hispanic (%)
Races - Hispanic (% change since 2000)
Races - Native Hawaiian and Other Pacific Islander alone (%)
Races - Native Hawaiian and Other Pacific Islander alone (% change since 2000)
Races - Two or more races(%)
Races - Two or more races(% change since 2000)
Races - Other race alone (%)
Races - Other race alone (% change since 2000)
Racial diversity
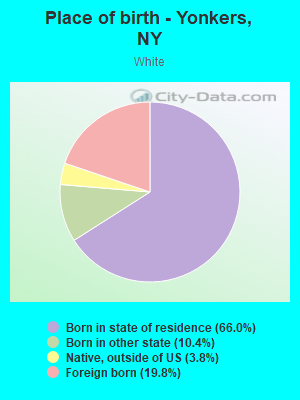
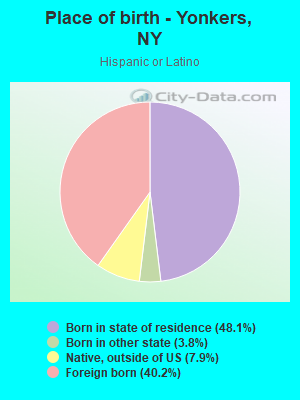
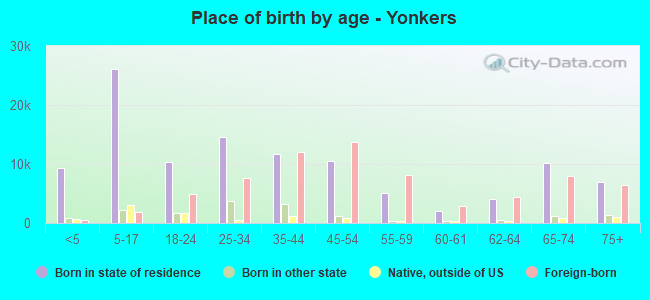
Place of birth - Born in state of residence (%)
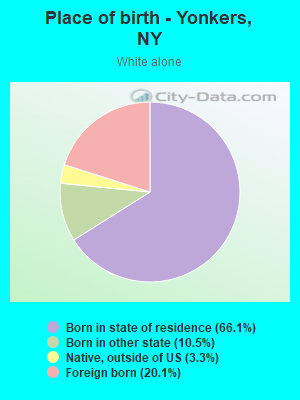
Place of birth - Born in state of residence (%) - White
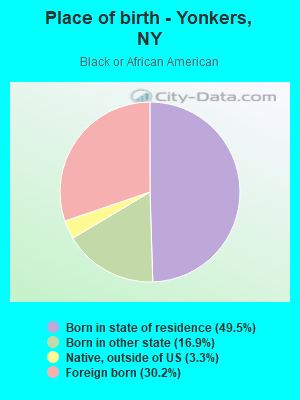
Place of birth - Born in state of residence (%) - Black or African American
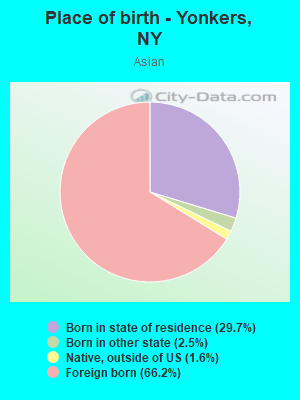
Place of birth - Born in state of residence (%) - Asian
Place of birth - Born in state of residence (%) - Hispanic or Latino
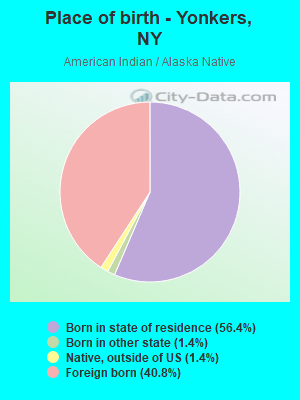
Place of birth - Born in state of residence (%) - American Indian and Alaska Native
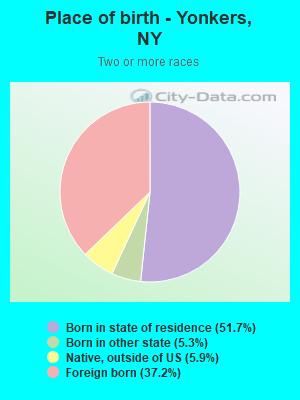
Place of birth - Born in state of residence (%) - Multirace
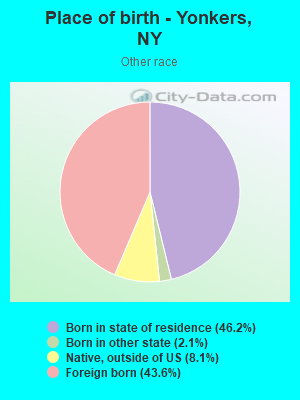
Place of birth - Born in state of residence (%) - Other Race
Place of birth - Born in other state (%)
Place of birth - Born in other state (%) - White
Place of birth - Born in other state (%) - Black or African American
Place of birth - Born in other state (%) - Asian
Place of birth - Born in other state (%) - Hispanic or Latino
Place of birth - Born in other state (%) - American Indian and Alaska Native
Place of birth - Born in other state (%) - Multirace
Place of birth - Born in other state (%) - Other Race
Place of birth - Native, outside of US (%)
Place of birth - Native, outside of US (%) - White
Place of birth - Native, outside of US (%) - Black or African American
Place of birth - Native, outside of US (%) - Asian
Place of birth - Native, outside of US (%) - Hispanic or Latino
Place of birth - Native, outside of US (%) - American Indian and Alaska Native
Place of birth - Native, outside of US (%) - Multirace
Place of birth - Native, outside of US (%) - Other Race
Place of birth - Foreign born (%)
Place of birth - Foreign born (%) - White
Place of birth - Foreign born (%) - Black or African American
Place of birth - Foreign born (%) - Asian
Place of birth - Foreign born (%) - Hispanic or Latino
Place of birth - Foreign born (%) - American Indian and Alaska Native
Place of birth - Foreign born (%) - Multirace
Place of birth - Foreign born (%) - Other Race
Residents speaking English at home (%)
Residents speaking English at home - Born in the United States (%)
Residents speaking English at home - Native, born elsewhere (%)
Residents speaking English at home - Foreign born (%)
Residents speaking Spanish at home (%)
Residents speaking Spanish at home - Born in the United States (%)
Residents speaking Spanish at home - Native, born elsewhere (%)
Residents speaking Spanish at home - Foreign born (%)
Residents speaking other language at home (%)
Residents speaking other language at home - Born in the United States (%)
Residents speaking other language at home - Native, born elsewhere (%)
Residents speaking other language at home - Foreign born (%)
Marital status - Never married (%)
Marital status - Now married (%)
Marital status - Separated (%)
Marital status - Widowed (%)
Marital status - Divorced (%)
Ancestries Reported - Arab (%)
Ancestries Reported - Czech (%)
Ancestries Reported - Danish (%)
Ancestries Reported - Dutch (%)
Ancestries Reported - English (%)
Ancestries Reported - French (%)
Ancestries Reported - French Canadian (%)
Ancestries Reported - German (%)
Ancestries Reported - Greek (%)
Ancestries Reported - Hungarian (%)
Ancestries Reported - Irish (%)
Ancestries Reported - Italian (%)
Ancestries Reported - Lithuanian (%)
Ancestries Reported - Norwegian (%)
Ancestries Reported - Polish (%)
Ancestries Reported - Portuguese (%)
Ancestries Reported - Russian (%)
Ancestries Reported - Scotch-Irish (%)
Ancestries Reported - Scottish (%)
Ancestries Reported - Slovak (%)
Ancestries Reported - Subsaharan African (%)
Ancestries Reported - Swedish (%)
Ancestries Reported - Swiss (%)
Ancestries Reported - Ukrainian (%)
Ancestries Reported - United States (%)
Ancestries Reported - Welsh (%)
Ancestries Reported - West Indian (%)
Ancestries Reported - Other (%)
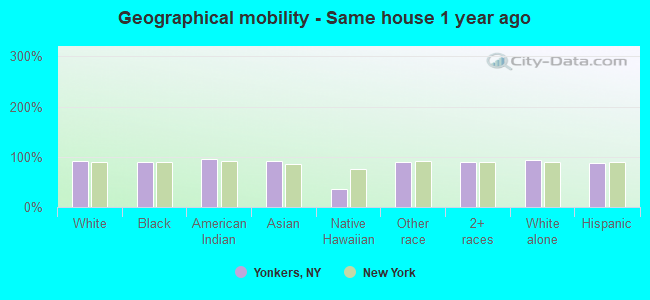
Geographical mobility - Same house 1 year ago (%)
Geographical mobility - Same house 1 year ago (%) - White
Geographical mobility - Same house 1 year ago (%) - Black or African American
Geographical mobility - Same house 1 year ago (%) - Asian
Geographical mobility - Same house 1 year ago (%) - Hispanic or Latino
Geographical mobility - Same house 1 year ago (%) - American Indian and Alaska Native
Geographical mobility - Same house 1 year ago (%) - Multirace
Geographical mobility - Same house 1 year ago (%) - Other Race
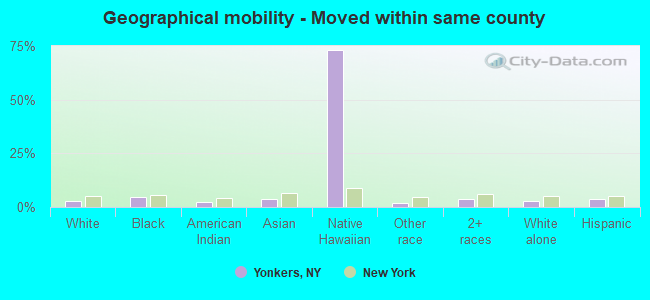
Geographical mobility - Moved within same county (%)
Geographical mobility - Moved within same county (%) - White
Geographical mobility - Moved within same county (%) - Black or African American
Geographical mobility - Moved within same county (%) - Asian
Geographical mobility - Moved within same county (%) - Hispanic or Latino
Geographical mobility - Moved within same county (%) - American Indian and Alaska Native
Geographical mobility - Moved within same county (%) - Multirace
Geographical mobility - Moved within same county (%) - Other Race
Geographical mobility - Moved from different county within same state (%)
Geographical mobility - Moved from different county within same state (%) - White
Geographical mobility - Moved from different county within same state (%) - Black or African American
Geographical mobility - Moved from different county within same state (%) - Asian
Geographical mobility - Moved from different county within same state (%) - Hispanic or Latino
Geographical mobility - Moved from different county within same state (%) - American Indian and Alaska Native
Geographical mobility - Moved from different county within same state (%) - Multirace
Geographical mobility - Moved from different county within same state (%) - Other Race
Geographical mobility - Moved from different state (%)
Geographical mobility - Moved from different state (%) - White
Geographical mobility - Moved from different state (%) - Black or African American
Geographical mobility - Moved from different state (%) - Asian
Geographical mobility - Moved from different state (%) - Hispanic or Latino
Geographical mobility - Moved from different state (%) - American Indian and Alaska Native
Geographical mobility - Moved from different state (%) - Multirace
Geographical mobility - Moved from different state (%) - Other Race
Geographical mobility - Moved from abroad (%)
Geographical mobility - Moved from abroad (%) - White
Geographical mobility - Moved from abroad (%) - Black or African American
Geographical mobility - Moved from abroad (%) - Asian
Geographical mobility - Moved from abroad (%) - Hispanic or Latino
Geographical mobility - Moved from abroad (%) - American Indian and Alaska Native
Geographical mobility - Moved from abroad (%) - Multirace
Geographical mobility - Moved from abroad (%) - Other Race
Place of birth for the foreign-born population - Ireland (%)
Place of birth for the foreign-born population - Denmark (%)
Place of birth for the foreign-born population - Norway (%)
Place of birth for the foreign-born population - Sweden (%)
Place of birth for the foreign-born population - United Kingdom (%)
Place of birth for the foreign-born population - England (%)
Place of birth for the foreign-born population - Scotland (%)
Place of birth for the foreign-born population - Other Northern Europe (%)
Place of birth for the foreign-born population - Austria (%)
Place of birth for the foreign-born population - Belgium (%)
Place of birth for the foreign-born population - France (%)
Place of birth for the foreign-born population - Germany (%)
Place of birth for the foreign-born population - Netherlands (%)
Place of birth for the foreign-born population - Switzerland (%)
Place of birth for the foreign-born population - Other Western Europe (%)
Place of birth for the foreign-born population - Greece (%)
Place of birth for the foreign-born population - Italy (%)
Place of birth for the foreign-born population - Portugal (%)
Place of birth for the foreign-born population - Spain (%)
Place of birth for the foreign-born population - Other Southern Europe (%)
Place of birth for the foreign-born population - Albania (%)
Place of birth for the foreign-born population - Belarus (%)
Place of birth for the foreign-born population - Bosnia and Herzegovina (%)
Place of birth for the foreign-born population - Bulgaria (%)
Place of birth for the foreign-born population - Croatia (%)
Place of birth for the foreign-born population - Czechoslovakia (%)
Place of birth for the foreign-born population - Hungary (%)
Place of birth for the foreign-born population - Latvia (%)
Place of birth for the foreign-born population - Lithuania (%)
Place of birth for the foreign-born population - North Macedonia (Macedonia) (%)
Place of birth for the foreign-born population - Moldova (%)
Place of birth for the foreign-born population - Poland (%)
Place of birth for the foreign-born population - Romania (%)
Place of birth for the foreign-born population - Russia (%)
Place of birth for the foreign-born population - Serbia (%)
Place of birth for the foreign-born population - Ukraine (%)
Place of birth for the foreign-born population - Other Eastern Europe (%)
Place of birth for the foreign-born population - China (%)
Place of birth for the foreign-born population - Hong Kong (%)
Place of birth for the foreign-born population - Taiwan (%)
Place of birth for the foreign-born population - Japan (%)
Place of birth for the foreign-born population - Korea (%)
Place of birth for the foreign-born population - Other Eastern Asia (%)
Place of birth for the foreign-born population - Afghanistan (%)
Place of birth for the foreign-born population - Bangladesh (%)
Place of birth for the foreign-born population - India (%)
Place of birth for the foreign-born population - Iran (%)
Place of birth for the foreign-born population - Kazakhstan (%)
Place of birth for the foreign-born population - Nepal (%)
Place of birth for the foreign-born population - Pakistan (%)
Place of birth for the foreign-born population - Sri Lanka (%)
Place of birth for the foreign-born population - Uzbekistan (%)
Place of birth for the foreign-born population - Other South Central Asia (%)
Place of birth for the foreign-born population - Burma (%)
Place of birth for the foreign-born population - Cambodia (%)
Place of birth for the foreign-born population - Indonesia (%)
Place of birth for the foreign-born population - Laos (%)
Place of birth for the foreign-born population - Malaysia (%)
Place of birth for the foreign-born population - Philippines (%)
Place of birth for the foreign-born population - Singapore (%)
Place of birth for the foreign-born population - Thailand (%)
Place of birth for the foreign-born population - Vietnam (%)
Place of birth for the foreign-born population - Other South Eastern Asia (%)
Place of birth for the foreign-born population - Armenia (%)
Place of birth for the foreign-born population - Iraq (%)
Place of birth for the foreign-born population - Israel (%)
Place of birth for the foreign-born population - Jordan (%)
Place of birth for the foreign-born population - Kuwait (%)
Place of birth for the foreign-born population - Lebanon (%)
Place of birth for the foreign-born population - Saudi Arabia (%)
Place of birth for the foreign-born population - Syria (%)
Place of birth for the foreign-born population - Turkey (%)
Place of birth for the foreign-born population - Yemen (%)
Place of birth for the foreign-born population - Other Western Asia (%)
Place of birth for the foreign-born population - Eritrea (%)
Place of birth for the foreign-born population - Ethiopia (%)
Place of birth for the foreign-born population - Kenya (%)
Place of birth for the foreign-born population - Somalia (%)
Place of birth for the foreign-born population - Uganda (%)
Place of birth for the foreign-born population - Zimbabwe (%)
Place of birth for the foreign-born population - Other Eastern Africa (%)
Place of birth for the foreign-born population - Cameroon (%)
Place of birth for the foreign-born population - Congo (%)
Place of birth for the foreign-born population - Democratic Republic of Congo (Zaire) (%)
Place of birth for the foreign-born population - Other Middle Africa (%)
Place of birth for the foreign-born population - Egypt (%)
Place of birth for the foreign-born population - Morocco (%)
Place of birth for the foreign-born population - Sudan (%)
Place of birth for the foreign-born population - Other Northern Africa (%)
Place of birth for the foreign-born population - South Africa (%)
Place of birth for the foreign-born population - Other Southern Africa (%)
Place of birth for the foreign-born population - Cabo Verde (%)
Place of birth for the foreign-born population - Ghana (%)
Place of birth for the foreign-born population - Liberia (%)
Place of birth for the foreign-born population - Nigeria (%)
Place of birth for the foreign-born population - Senegal (%)
Place of birth for the foreign-born population - Sierra Leone (%)
Place of birth for the foreign-born population - Other Western Africa (%)
Place of birth for the foreign-born population - Australia (%)
Place of birth for the foreign-born population - New Zealand (%)
Place of birth for the foreign-born population - Fiji (%)
Place of birth for the foreign-born population - Micronesia (%)
Place of birth for the foreign-born population - Bahamas (%)
Place of birth for the foreign-born population - Barbados (%)
Place of birth for the foreign-born population - Cuba (%)
Place of birth for the foreign-born population - Dominica (%)
Place of birth for the foreign-born population - Dominican Republic (%)
Place of birth for the foreign-born population - Grenada (%)
Place of birth for the foreign-born population - Haiti (%)
Place of birth for the foreign-born population - Jamaica (%)
Place of birth for the foreign-born population - St. Vincent and the Grenadines (%)
Place of birth for the foreign-born population - Trinidad and Tobago (%)
Place of birth for the foreign-born population - West Indies (%)
Place of birth for the foreign-born population - Other Caribbean (%)
Place of birth for the foreign-born population - Belize (%)
Place of birth for the foreign-born population - Costa Rica (%)
Place of birth for the foreign-born population - El Salvador (%)
Place of birth for the foreign-born population - Guatemala (%)
Place of birth for the foreign-born population - Honduras (%)
Place of birth for the foreign-born population - Mexico (%)
Place of birth for the foreign-born population - Nicaragua (%)
Place of birth for the foreign-born population - Panama (%)
Place of birth for the foreign-born population - Other Central America (%)
Place of birth for the foreign-born population - Argentina (%)
Place of birth for the foreign-born population - Bolivia (%)
Place of birth for the foreign-born population - Brazil (%)
Place of birth for the foreign-born population - Chile (%)
Place of birth for the foreign-born population - Colombia (%)
Place of birth for the foreign-born population - Ecuador (%)
Place of birth for the foreign-born population - Guyana (%)
Place of birth for the foreign-born population - Peru (%)
Place of birth for the foreign-born population - Uruguay (%)
Place of birth for the foreign-born population - Venezuela (%)
Place of birth for the foreign-born population - Other South America (%)
Place of birth for the foreign-born population - Canada (%)
Place of birth for the foreign-born population - Other Northern America (%)
Place of birth for the foreign-born population - Other (%)
Latest news about races in Yonkers, NY collected exclusively by city-data.com from local newspapers, TV, and radio stations
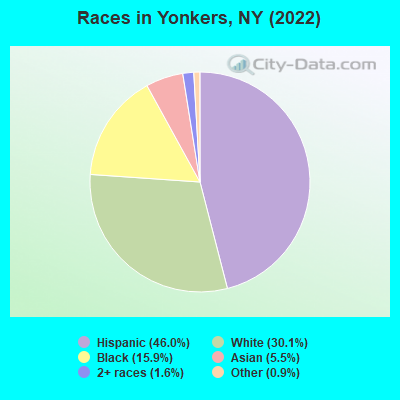
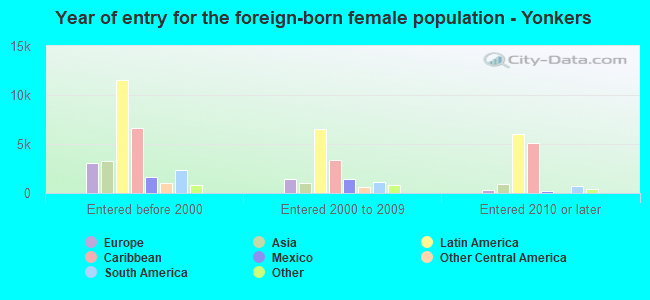
According to 2022 data, the most numerous races in Yonkers, NY are White alone (62,647 residents), Hispanic (95,779 residents), and Black alone (33,180 residents). 47.5% of Yonkers residents speak English at home. 31.9% of Yonkers, NY residents are foreign-born (20.1% born in Latin America, 5.3% born in Europe, 4.9% born in Asia), which is 31.0% greater than the foreign-born rate of 22.0% across the entire state of New York.
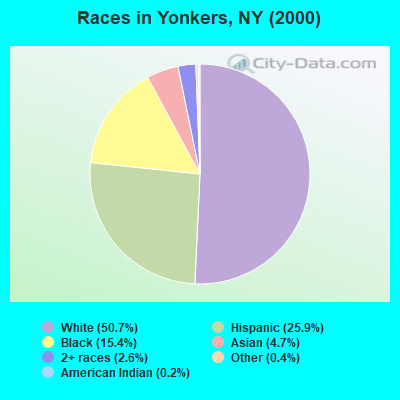
Race distribution in Yonkers
2000 2022
99,346 50.7% White alone 50,852 25.9% Hispanic 30,164 15.4% Black alone 9,290 4.7% Asian alone 5,177 2.6% Two or more races 842 0.4% Other race alone 362 0.2% American Indian alone 53 0.03% Native Hawaiian and Other
95,779 46.0% Hispanic 62,647 30.1% White alone 33,180 15.9% Black alone 11,445 5.5% Asian alone 3,263 1.6% Two or more races 1,798 0.9% Other race alone
2000 2022
11,760,981 62.0% White alone 2,867,583 15.1% Hispanic 2,812,623 14.8% Black alone 1,035,926 5.5% Asian alone 366,116 1.9% Two or more races 75,499 0.4% Other race alone 52,499 0.3% American Indian alone 5,230 0.03% Native Hawaiian and Other
10,408,933 52.9% White alone 3,867,299 19.7% Hispanic 2,633,840 13.4% Black alone 1,776,286 9.0% Asian alone 732,670 3.7% Two or more races 216,110 1.1% Other race alone 35,082 0.2% American Indian alone 6,931 0.04% Native Hawaiian and Other
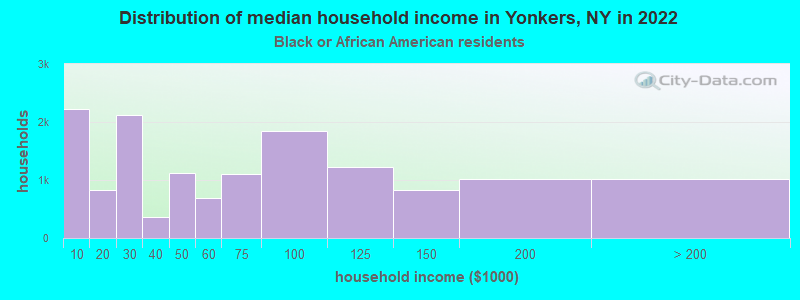
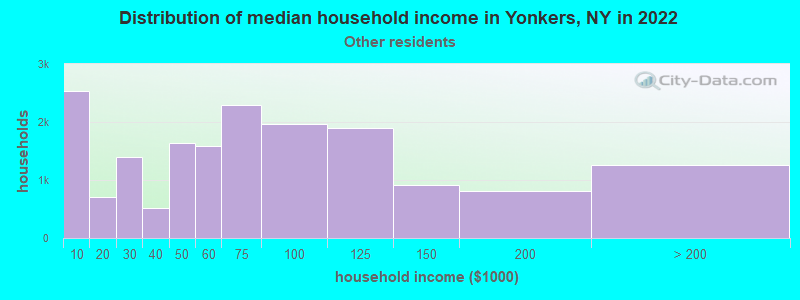
Income and house value in Yonkers Median household income in 2022 $80,072 White non-Hispanic householders$56,354 Black householders$168,225 American Indian and Alaska Native householders$93,952 Asian householders$61,111 Some other race householders$61,250 Two or more races householders$62,468 Hispanic or Latino race householdersMedian 2022 house value $559,708 White Non-Hispanic householders$477,234 Black or African American householders$439,936 American Indian or Alaska Native householders $556,001 Asian householders$434,376 Native Hawaiian and other Pacific Islander householders$528,665 Some other race householders$557,855 Two or more races householders$539,553 Hispanic or Latino householders
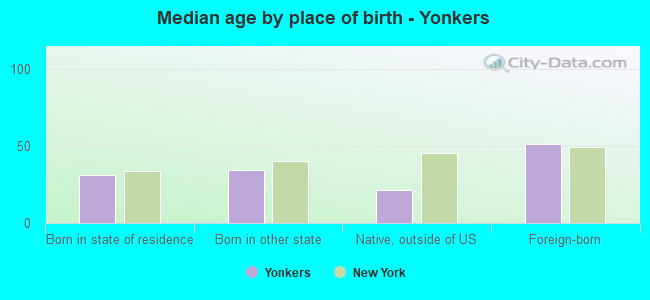
Median age by race in Yonkers
50.0 Median age for White residents47.5 52.7 35.3 Median age for Black or African American residents31.8 37.0 36.0 Median age for American Indian / Alaska Native residents34.9 39.0 43.4 Median age for Asian residents42.0 45.6 -666,666,666.0 Median age for Native Hawaiian / Pacific Islander residents-666,666,666.0 -666,666,666.0 33.0 Median age for Other race residents33.0 33.1 38.0 Median age for Two or more races residents38.3 37.8 52.6 Median age for White alone residents49.4 55.1 33.4 Median age for Hispanic or Latino residents34.3 32.8
Owner/renter occupied households by race in Yonkers
House owners and renters - White residents 20,039 64.9% Owner occupied10,825 35.1% Renter occupiedHouse owners and renters - Black or African American residents 4,828 33.5% Owner occupied9,573 66.5% Renter occupiedHouse owners and renters - American Indian / Alaska Native residents 327 33.0% Owner occupied664 67.0% Renter occupiedHouse owners and renters - Asian residents 2,939 69.9% Owner occupied1,263 30.1% Renter occupiedHouse owners and renters - Native Hawaiian / Pacific Islander residents 16 100.0% Owner occupiedHouse owners and renters - Other race residents 5,476 31.3% Owner occupied12,014 68.7% Renter occupiedHouse owners and renters - Two or more races residents 4,349 38.7% Owner occupied6,878 61.3% Renter occupiedHouse owners and renters - White alone residents 19,039 66.6% Owner occupied9,544 33.4% Renter occupiedHouse owners and renters - Hispanic or Latino residents 10,363 33.9% Owner occupied20,162 66.1% Renter occupied
Language usage in Yonkers
English speakers - Total 47.5% of residents of Yonkers speak English at home.
38.3% of residents speak Spanish at home 47,739 63.3% Speak English very well27,680 36.7% Speak English less than very well14.1% of residents speak other language at home 19,051 68.6% Speak English very well8,704 31.4% Speak English less than very well
English speakers - Born in the United States 83.1% of residents of Yonkers speak English at home.
14.9% of residents speak Spanish at home 2,191 93.5% Speak English very well153 6.5% Speak English less than very well2.0% of residents speak other language at home 314 100.0% Speak English very well
English speakers - Native, born elsewhere 15.6% of residents of Yonkers speak English at home.
65.9% of residents speak Spanish at home 3,958 62.9% Speak English very well2,336 37.1% Speak English less than very well18.5% of residents speak other language at home 1,429 80.9% Speak English very well338 19.1% Speak English less than very well
English speakers - Foreign-born 22.0% of residents of Yonkers speak English at home.
50.4% of residents speak Spanish at home 15,002 42.5% Speak English very well20,303 57.5% Speak English less than very well27.6% of residents speak other language at home 11,454 59.2% Speak English very well7,905 40.8% Speak English less than very well
White (Caucasian) - Speak only English Native:
80.1% (42,161)Foreign-born:
32.3% (4,372)
White (Caucasian) - Speak another language Native:
19.9% (10,483)Foreign-born:
67.7% (9,174)
Black or African American - Speak only English Native:
89.3% (21,792)Foreign-born:
59.6% (6,788)
Black or African American - Speak another language Native:
10.7% (2,598)Foreign-born:
40.4% (4,592)
American Indian / Alaska Native - Speak another language Native:
60.5% (904)Foreign-born:
100.0% (1,152)
Asian - Speak only English Native:
51.6% (1,708)Foreign-born:
9.4% (767)
Asian - Speak another language Native:
48.4% (1,601)Foreign-born:
90.6% (7,359)
Other race - Speak only English Native:
17.2% (4,652)Foreign-born:
11.9% (2,751)
Other race - Speak another language Native:
82.8% (22,378)Foreign-born:
88.1% (20,292)
Two or more races - Speak only English Native:
42.1% (7,275)Foreign-born:
6.1% (705)
Two or more races - Speak another language Native:
57.9% (10,010)Foreign-born:
93.9% (10,925)
White alone - Speak only English Native:
83.2% (39,684)Foreign-born:
34.3% (4,310)
White alone - Speak another language Native:
16.8% (7,999)Foreign-born:
65.7% (8,270)
Hispanic or Latino - Speak only English Native:
25.4% (12,975)Foreign-born:
8.8% (3,354)
Hispanic or Latino - Speak another language Native:
74.6% (38,125)Foreign-born:
91.2% (34,648)
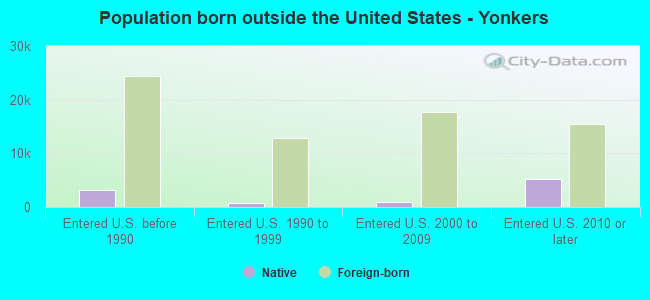
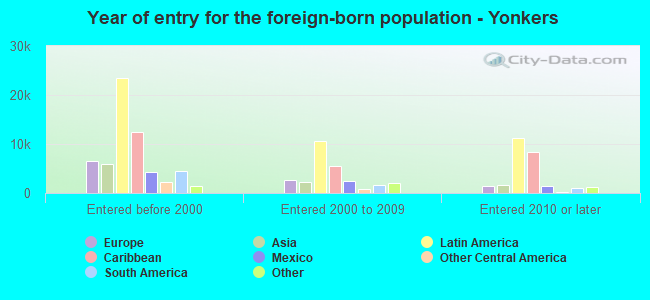
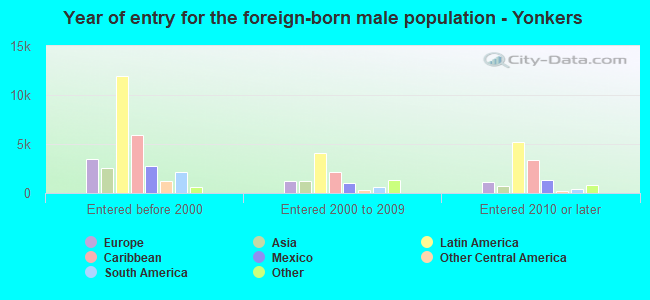
Foreign-born residents in Yonkers 66,429 residents are foreign born (20.1% Latin America , 5.3% Europe , 4.9% Asia ).
This city:
31.9%New York:
22.6%
Marital status for residents in Yonkers Marital status - White (Caucasian) population 15 years and over
Males 42.6% Never married45.7% Now married0.4% Separated2.8% Widowed8.5% DivorcedFemales 29.8% Never married40.1% Now married0.8% Separated16.9% Widowed12.4% DivorcedWomen who gave birth in the past 12 months Now married:
82.8% (985)Unmarried:
17.2% (204)
Women who did not give birth in the past 12 months Now married:
27.6% (3,167)Unmarried:
72.4% (8,294)
Marital status - Black or African American population 15 years and over
Males 46.3% Never married40.9% Now married4.1% Separated0.8% Widowed7.9% DivorcedFemales 55.7% Never married20.6% Now married6.8% Separated6.2% Widowed10.7% DivorcedWomen who gave birth in the past 12 months Now married:
67.8% (230)Unmarried:
32.2% (109)
Women who did not give birth in the past 12 months Now married:
28.4% (2,718)Unmarried:
71.6% (6,866)
Marital status - American Indian / Alaska Native population 15 years and over
Males 47.0% Never married41.5% Now married4.2% Separated3.7% Widowed3.7% DivorcedFemales 36.7% Never married48.4% Now married1.0% Separated0.0% Widowed13.9% DivorcedWomen who did not give birth in the past 12 months Now married:
37.4% (180)Unmarried:
62.6% (302)
Marital status - Asian population 15 years and over
Males 28.8% Never married60.0% Now married0.0% Separated0.0% Widowed11.2% DivorcedFemales 27.6% Never married43.9% Now married0.0% Separated14.0% Widowed14.5% DivorcedWomen who gave birth in the past 12 months Now married:
100.0% (135)Unmarried:
0.0% (0)
Women who did not give birth in the past 12 months Now married:
38.1% (1,204)Unmarried:
61.9% (1,953)
Marital status - Native Hawaiian / Pacific Islander population 15 years and over
Males 0.0% Never married0.0% Now married0.0% Separated0.0% Widowed100.0% DivorcedFemales 0.0% Never married0.0% Now married0.0% Separated100.0% Widowed0.0% DivorcedMarital status - Other race population 15 years and over
Males 39.1% Never married45.3% Now married10.4% Separated0.4% Widowed4.8% DivorcedFemales 41.8% Never married36.4% Now married5.7% Separated5.9% Widowed10.2% DivorcedWomen who gave birth in the past 12 months Now married:
72.3% (250)Unmarried:
27.7% (96)
Women who did not give birth in the past 12 months Now married:
37.3% (5,519)Unmarried:
62.7% (9,280)
Marital status - Two or more races population 15 years and over
Males 51.1% Never married36.1% Now married4.4% Separated1.0% Widowed7.4% DivorcedFemales 40.3% Never married37.6% Now married4.0% Separated6.0% Widowed12.0% DivorcedWomen who gave birth in the past 12 months Now married:
100.0% (398)Unmarried:
0.0% (0)
Women who did not give birth in the past 12 months Now married:
34.0% (2,330)Unmarried:
66.0% (4,529)
Marital status - White alone, not Hispanic / Latino population 15 years and over
Males 41.9% Never married46.1% Now married0.4% Separated3.0% Widowed8.5% DivorcedFemales 27.8% Never married41.8% Now married0.9% Separated17.3% Widowed12.2% DivorcedWomen who gave birth in the past 12 months Now married:
81.7% (911)Unmarried:
18.3% (204)
Women who did not give birth in the past 12 months Now married:
31.8% (3,093)Unmarried:
68.2% (6,626)
Marital status - Hispanic or Latino population 15 years and over
Males 43.3% Never married43.3% Now married7.2% Separated0.6% Widowed5.6% DivorcedFemales 41.9% Never married37.9% Now married4.2% Separated4.7% Widowed11.3% DivorcedWomen who gave birth in the past 12 months Now married:
88.3% (722)Unmarried:
11.7% (96)
Women who did not give birth in the past 12 months Now married:
34.6% (8,609)Unmarried:
65.4% (16,308)
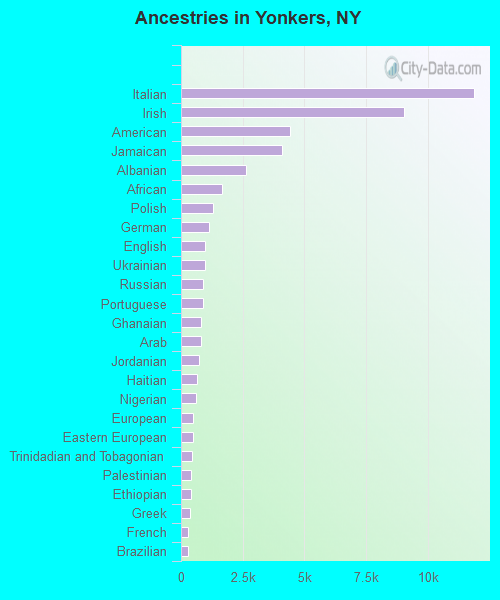
Ancestries in Yonkers
11,897 9.2% Italian9,029 7.0% Irish4,426 3.4% American4,099 3.2% Jamaican2,624 2.0% Albanian1,655 1.3% African1,317 1.0% Polish1,147 0.9% German978 0.8% English963 0.7% Ukrainian882 0.7% Russian877 0.7% Portuguese803 0.6% Ghanaian794 0.6% Arab723 0.6% Jordanian662 0.5% Haitian625 0.5% Nigerian503 0.4% European490 0.4% Eastern European426 0.3% Trinidadian and Tobagonian414 0.3% Palestinian398 0.3% Ethiopian366 0.3% Greek301 0.2% French289 0.2% Brazilian257 0.2% Guyanese252 0.2% British West Indian247 0.2% West Indian245 0.2% Scottish231 0.2% Macedonian220 0.2% Romanian188 0.1% Egyptian147 0.1% Slovak133 0.1% Assyrian122 0.09% Cape Verdean107 0.08% Moroccan101 0.08% Hungarian92 0.07% Bulgarian90 0.07% Austrian90 0.07% Czech79 0.06% Croatian78 0.06% Armenian76 0.06% Dutch76 0.06% Scotch-Irish70 0.05% Sierra Leonean68 0.05% Swedish60 0.05% Iranian55 0.04% British55 0.04% Norwegian42 0.03% Bermudan42 0.03% Welsh40 0.03% Latvian40 0.03% Lebanese39 0.03% Afghan37 0.03% Czechoslovakian36 0.03% Slavic35 0.03% Serbian34 0.03% Sudanese30 0.02% Turkish28 0.02% Belizean24 0.02% Barbadian22 0.02% Swiss22 0.02% Kenyan20 0.02% South African12 0.01% Israeli8 0.01% French Canadian7 0.01% Syrian7 0.01% Lithuanian
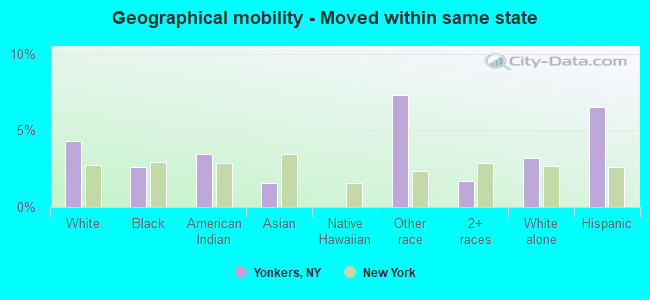
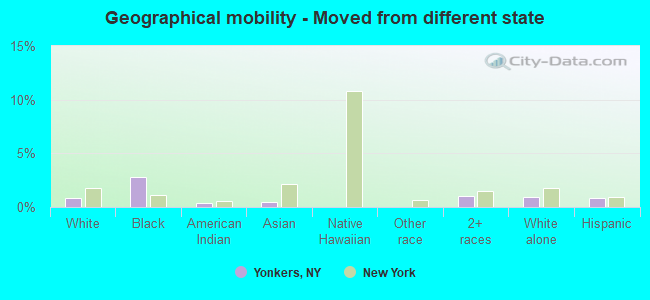
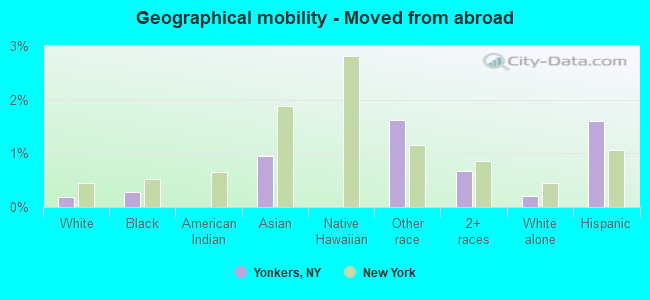
Geographical mobility in Yonkers Same house 1 year ago 62,615 92.1% White (Caucasian)33,668 89.4% Black or African American1,935 95.5% American Indian / Alaska Native10,641 91.7% Asian5 35.9% Native Hawaiian / Pacific Islander46,629 89.0% Other race28,258 89.4% Two or more races57,736 93.1% White alone, not Hispanic / Latino81,607 87.3% Hispanic or LatinoMoved within same county 1,761 2.6% White / Caucasian1,833 4.9% Black or African American46 2.3% American Indian / Alaska Native454 3.9% Asian11 73.4% Native Hawaiian / Pacific Islander1,094 2.1% Other race1,198 3.8% Two or more races1,602 2.6% White alone, not Hispanic / Latino3,521 3.8% Hispanic or LatinoMoved within same state 2,911 4.3% White / Caucasian977 2.6% Black or African American69 3.4% American Indian / Alaska Native180 1.6% Asian3,829 7.3% Other race531 1.7% Two or more races1,973 3.2% White alone, not Hispanic / Latino6,067 6.5% Hispanic or LatinoMoved from different state 577 0.8% White / Caucasian1,058 2.8% Black or African American7 0.4% American Indian / Alaska Native59 0.5% Asian324 1.0% Two or more races577 0.9% White alone, not Hispanic / Latino771 0.8% Hispanic or LatinoMoved from abroad 123 0.2% White106 0.3% Black or African American110 1.0% Asian852 1.6% Other race211 0.7% Two or more races123 0.2% White alone, not Hispanic / Latino1,492 1.6% Hispanic or Latino
Children Nativity (place of birth) in Yonkers
Children under 6 years - Living with two parents Both parents native 2,101 100.0% NativeBoth parents foreign-born 3,047 100.0% NativeOne native, one foreign-born parent 1,787 100.0% NativeChildren under 6 years - Living with one parent Native parent 2,518 100.0% NativeForeign-born parent 1,974 83.6% Native387 16.4% Foreign-bornChildren 6 to 17 years - Living with two parents Both parents native 4,356 100.0% NativeBoth parents foreign-born 9,354 96.8% Native309 3.2% Foreign-bornOne native, one foreign-born parent 5,605 100.0% NativeChildren 6 to 17 years - Living with one parent Native parent 6,010 100.0% NativeForeign-born parent 4,460 52.4% Native4,044 47.6% Foreign-born
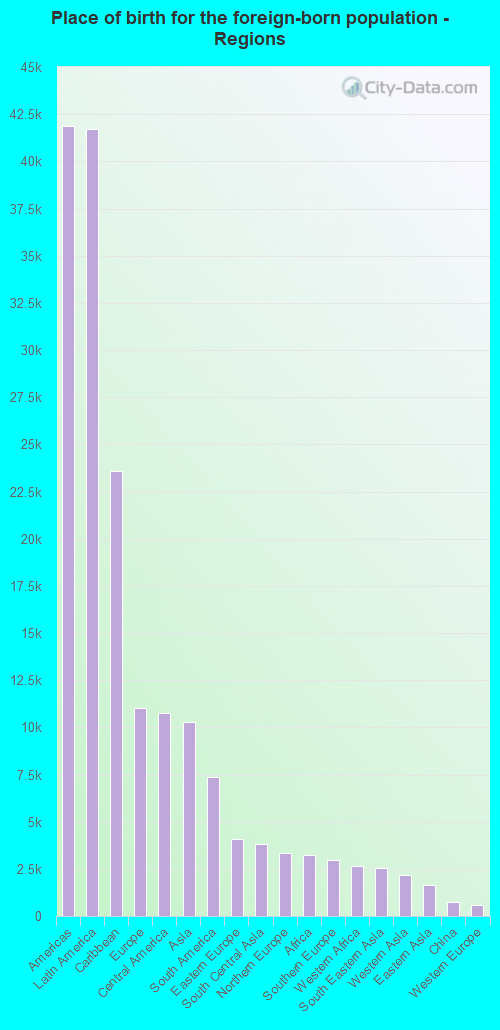
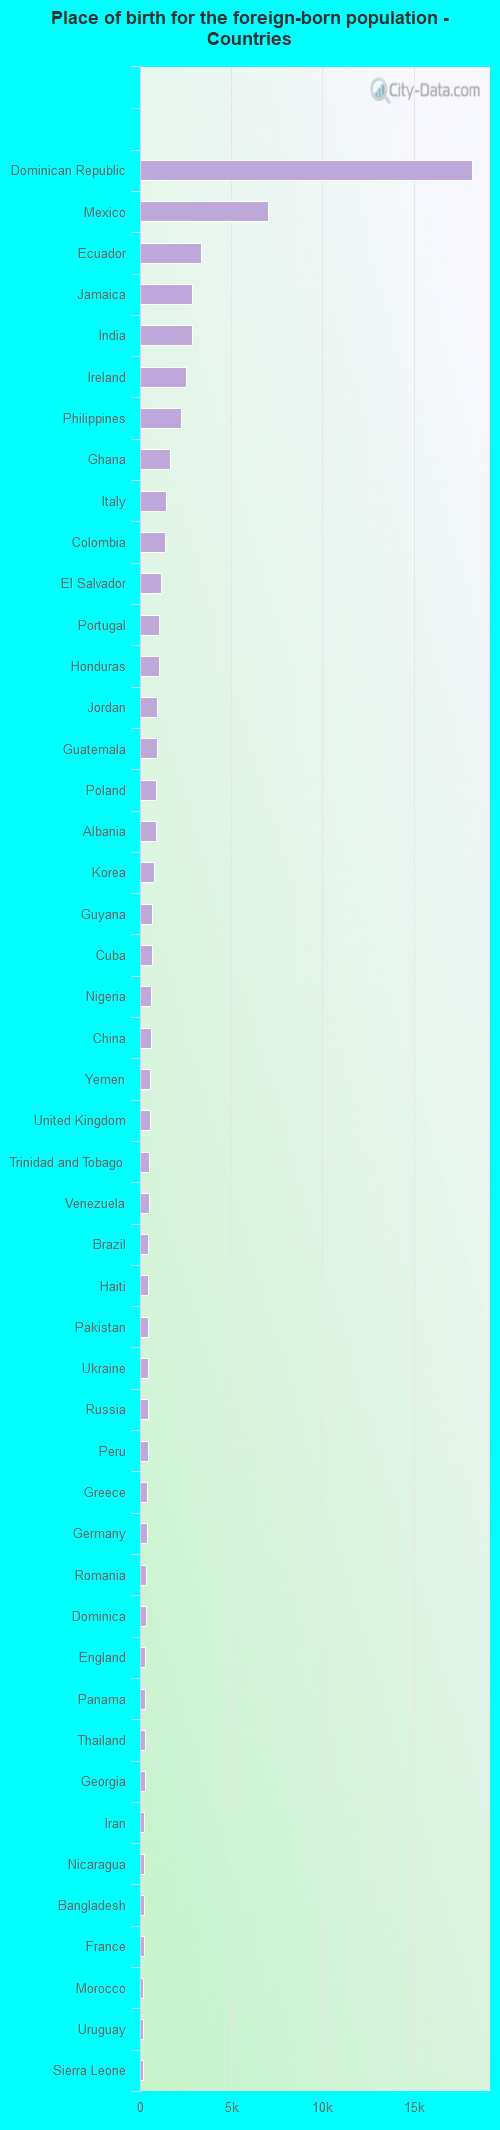
Place of birth for residents in Yonkers 41,894 Americas41,711 Latin America23,582 Caribbean11,002 Europe10,767 Central America10,258 Asia7,361 South America4,092 Eastern Europe3,812 South Central Asia3,357 Northern Europe3,238 Africa2,963 Southern Europe2,672 Western Africa2,565 South Eastern Asia2,195 Western Asia1,628 Eastern Asia755 China589 Western Europe314 Northern Africa182 Northern America130 Eastern Africa71 Middle Africa35 Oceania35 Australia and New Zealand Subregion29 Southern Africa18,226 Dominican Republic7,021 Mexico3,349 Ecuador2,840 Jamaica2,834 India2,504 Ireland2,230 Philippines1,656 Ghana1,439 Italy1,379 Colombia1,134 El Salvador1,045 Portugal1,037 Honduras950 Jordan913 Guatemala896 Poland888 Albania766 Korea681 Guyana680 Cuba593 Nigeria587 China571 Yemen534 United Kingdom513 Trinidad and Tobago477 Venezuela454 Brazil453 Haiti451 Pakistan450 Ukraine439 Russia433 Peru380 Greece364 Germany318 Romania314 Dominica284 England271 Panama266 Thailand247 Georgia231 Iran225 Nicaragua219 Bangladesh200 France182 Morocco181 Uruguay174 Sierra Leone158 Israel158 Argentina148 Chile140 Costa Rica127 Canada120 Taiwan105 Japan102 Czechoslovakia101 Egypt97 Spain85 Barbados67 Belarus65 Liberia64 Vietnam57 Serbia56 Ethiopia56 St. Lucia55 Saudi Arabia49 Kenya49 Democratic Republic of Congo (Zaire)48 Kuwait47 Hong Kong40 Bulgaria38 Lebanon36 Nepal36 United Arab Emirates35 Australia33 Cabo Verde31 Sri Lanka30 Scotland29 Senegal29 South Africa26 Latvia22 Belize21 Ivory Coast20 Bolivia17 Croatia15 Syria14 West Indies13 Switzerland13 Sudan13 Turkey12 Armenia11 Azerbaijan11 Hungary10 Bahamas7 Tanzania6 Netherlands6 Uzbekistan6 North Macedonia (Macedonia)4 Laos2 Austria2 Norway
Grandparents responsible for own grandchildren in Yonkers
Grandparents (30 to 59 years) White / Caucasian 109 46.8% Responsible for grandchildren124 53.2% Not responsible for grandchildrenBlack or African American 229 44.5% Responsible for grandchildren287 55.5% Not responsible for grandchildrenAmerican Indian / Alaska Native 10 100.0% Not responsible for grandchildrenAsian 72 100.0% Not responsible for grandchildrenOther race 274 39.9% Responsible for grandchildren412 60.1% Not responsible for grandchildrenTwo or more races 102 35.6% Responsible for grandchildren184 64.4% Not responsible for grandchildrenWhite alone, not Hispanic / Latino 74 30.7% Responsible for grandchildren167 69.3% Not responsible for grandchildrenHispanic or Latino 498 49.5% Responsible for grandchildren507 50.5% Not responsible for grandchildrenGrandparents (60 years and over) White / Caucasian 145 18.0% Responsible for grandchildren657 82.0% Not responsible for grandchildrenBlack or African American 70 10.6% Responsible for grandchildren586 89.4% Not responsible for grandchildrenAmerican Indian / Alaska Native 78 100.0% Not responsible for grandchildrenAsian 120 15.7% Responsible for grandchildren645 84.3% Not responsible for grandchildrenOther race 46 7.2% Responsible for grandchildren598 92.8% Not responsible for grandchildrenTwo or more races 124 46.1% Responsible for grandchildren145 53.9% Not responsible for grandchildrenWhite alone, not Hispanic / Latino 143 20.1% Responsible for grandchildren568 79.9% Not responsible for grandchildrenHispanic or Latino 153 16.0% Responsible for grandchildren803 84.0% Not responsible for grandchildren