Races in Woxhall, Pennsylvania (PA) Detailed Stats
According to 2022 data, the most numerous races in Woxhall, PA are White alone (1,190 residents), Black alone (11 residents), and Hispanic (94 residents). 92.0% of Woxhall residents speak English at home.
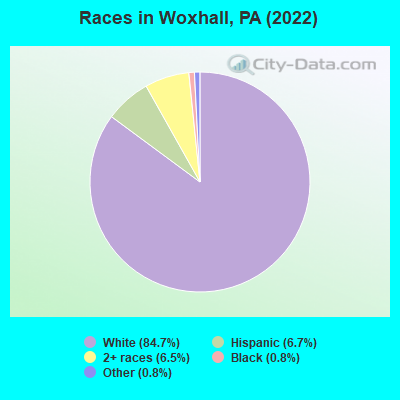
Race distribution in Woxhall 1,190 84.7% White alone 94 6.7% Hispanic 92 6.5% Two or more races 11 0.8% Black alone 11 0.8% Other race alone
2000 2022
10,322,455 84.1% White alone 1,202,437 9.8% Black alone 394,088 3.2% Hispanic 218,296 1.8% Asian alone 113,097 0.9% Two or more races 13,086 0.1% Other race alone 14,904 0.1% American Indian alone 2,691 0.02% Native Hawaiian and Other
9,487,228 73.1% White alone 1,311,581 10.1% Black alone 1,115,997 8.6% Hispanic 493,942 3.8% Two or more races 487,124 3.8% Asian alone 63,582 0.5% Other race alone 10,130 0.08% American Indian alone 2,424 0.02% Native Hawaiian and Other
Income and house value in Woxhall Median household income in 2022 $151,786 White non-Hispanic householders
Household income for White non-Hispanic householders
Median age by race in Woxhall
50.4 Median age for White residents51.1 49.6 -666,666,666.0 Median age for Black or African American residents-646,630,236.1 -698,175,787.0 -626,180,836.1 Median age for American Indian / Alaska Native residents-1,098,934,549.9 -577,519,379.3 -675,555,554.9 Median age for Asian residents-673,796,790.8 -677,304,963.9 -680,432,644.4 Median age for Native Hawaiian / Pacific Islander residents-649,523,808.9 -747,474,746.7 -601,307,188.9 Median age for Other race residents-554,476,806.3 -746,136,864.6 12.5 Median age for Two or more races residents12.6 7.8 50.1 Median age for White alone residents50.6 49.1 12.5 Median age for Hispanic or Latino residents-645,006,016.2 -676,470,587.6
Owner/renter occupied households by race in Woxhall
House owners and renters - White residents 408 97.5% Owner occupied10 2.5% Renter occupiedHouse owners and renters - Black or African American residents 5 100.0% Owner occupiedHouse owners and renters - Two or more races residents 25 100.0% Renter occupiedHouse owners and renters - White alone residents 411 97.5% Owner occupied11 2.5% Renter occupiedHouse owners and renters - Hispanic or Latino residents 20 100.0% Renter occupied
Language usage in Woxhall
English speakers - Total 92.0% of residents of Woxhall speak English at home.
7.3% of residents speak Spanish at home 48 50.0% Speak English very well48 50.0% Speak English less than very well0.9% of residents speak other language at home 12 100.0% Speak English very well
English speakers - Born in the United States 82.3% of residents of Woxhall speak English at home.
17.0% of residents speak Spanish at home 24 100.0% Speak English very well
English speakers - Foreign-born 0.0% of residents of Woxhall speak English at home.
109.3% of residents speak Spanish at home 47 100.0% Speak English less than very well11.6% of residents speak other language at home 5 100.0% Speak English very well
White (Caucasian) - Speak another language Native:
0.5% (5)Foreign-born:
96.4% (5)
Two or more races - Speak another language Native:
47.5% (71)Foreign-born:
100.0% (58)
White alone - Speak another language Native:
0.6% (6)Foreign-born:
100.0% (6)
Hispanic or Latino - Speak another language Native:
98.5% (54)Foreign-born:
100.0% (39)
Foreign-born residents in Woxhall
Marital status for residents in Woxhall Marital status - White (Caucasian) population 15 years and over
Males 22.7% Never married72.4% Now married0.0% Separated0.0% Widowed5.0% DivorcedFemales 21.9% Never married74.5% Now married0.0% Separated2.2% Widowed1.4% DivorcedWomen who gave birth in the past 12 months Now married:
100.0% (23)Unmarried:
0.0% (0)
Women who did not give birth in the past 12 months Now married:
39.4% (69)Unmarried:
60.6% (106)
Marital status - Black or African American population 15 years and over
Males 0.0% Never married100.0% Now married0.0% Separated0.0% Widowed0.0% DivorcedFemales 100.0% Never married0.0% Now married0.0% Separated0.0% Widowed0.0% DivorcedWomen who did not give birth in the past 12 months Now married:
0.0% (0)Unmarried:
100.0% (6)
Marital status - Two or more races population 15 years and over
Males 0.0% Never married100.0% Now married0.0% Separated0.0% Widowed0.0% DivorcedFemales 0.0% Never married100.0% Now married0.0% Separated0.0% Widowed0.0% DivorcedWomen who did not give birth in the past 12 months Now married:
100.0% (51)Unmarried:
0.0% (0)
Marital status - White alone, not Hispanic / Latino population 15 years and over
Males 22.7% Never married72.4% Now married0.0% Separated0.0% Widowed5.0% DivorcedFemales 21.9% Never married74.5% Now married0.0% Separated2.2% Widowed1.4% DivorcedWomen who gave birth in the past 12 months Now married:
100.0% (24)Unmarried:
0.0% (0)
Women who did not give birth in the past 12 months Now married:
39.4% (70)Unmarried:
60.6% (108)
Marital status - Hispanic or Latino population 15 years and over
Males 0.0% Never married100.0% Now married0.0% Separated0.0% Widowed0.0% DivorcedFemales 0.0% Never married100.0% Now married0.0% Separated0.0% Widowed0.0% DivorcedWomen who did not give birth in the past 12 months Now married:
100.0% (22)Unmarried:
0.0% (0)
Ancestries in Woxhall
265 38.8% German86 12.6% Polish66 9.7% American46 6.7% Slovak36 5.3% Irish30 4.4% English22 3.2% Pennsylvania German20 2.9% European16 2.3% Italian7 1.0% Scottish6 0.9% Welsh3 0.4% Eastern European
Children Nativity (place of birth) in Woxhall
Children under 6 years - Living with two parents Both parents native 81 100.0% NativeChildren under 6 years - Living with one parent Native parent 12 100.0% Native
Children 6 to 17 years - Living with two parents Both parents native 212 100.0% NativeBoth parents foreign-born 45 100.0% Native
Place of birth for residents in Woxhall 39 Americas39 Latin America39 Caribbean6 Europe6 Western Europe