Races in Woodruff, Wisconsin (WI) Detailed Stats
Ancestries, Foreign-born residents, place of birth

Data:
0.9% of Woodruff, WI residents are foreign-born , which is 482.9% less than the foreign-born rate of 5.0% across the entire state of Wisconsin.
Race distribution in Woodruff

- 1,90796.2%White alone
- 301.5%American Indian alone
- 211.1%Hispanic
- 150.8%Two or more races
- 50.3%Black alone
- 30.2%Asian alone
- 10.05%Native Hawaiian and Other
Pacific Islander alone
2000
2022
-
- 4,681,63087.3%White alone
- 300,2455.6%Black alone
- 192,9213.6%Hispanic
- 87,9951.6%Asian alone
- 51,9211.0%Two or more races
- 43,9800.8%American Indian alone
- 3,6370.07%Other race alone
- 1,3460.03%Native Hawaiian and Other
Pacific Islander alone
-
- 4,654,03179.0%White alone
- 447,0227.6%Hispanic
- 345,6785.9%Black alone
- 217,5323.7%Two or more races
- 172,2422.9%Asian alone
- 33,7620.6%American Indian alone
- 19,6800.3%Other race alone
- 2,5920.04%Native Hawaiian and Other
Pacific Islander alone
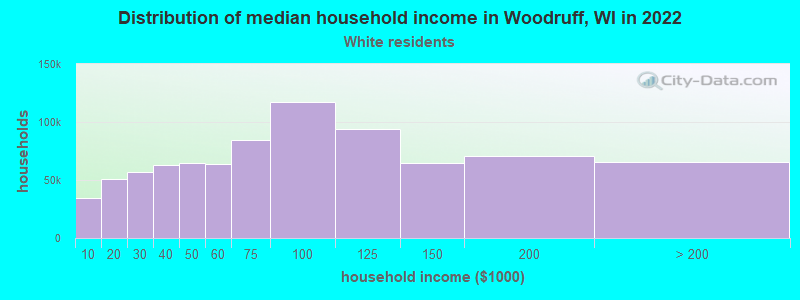
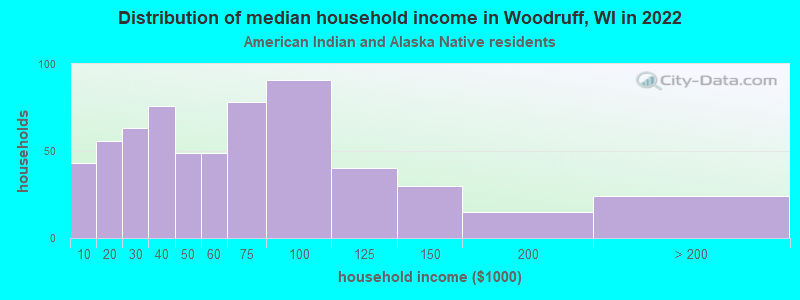
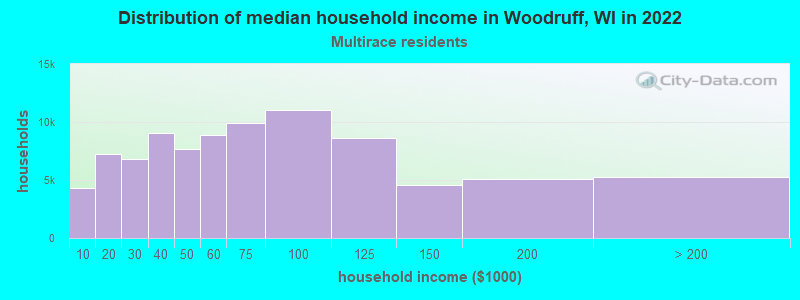
Income and house value in Woodruff
- Median household income in 2022
- $60,202White non-Hispanic householders
- $4,064American Indian and Alaska Native householders
- $82,393Two or more races householders
- Median 2022 house value
- $232,287White Non-Hispanic householders
- $170,132Two or more races householders
Foreign-born residents in Woodruff
17 residents are foreign born
| This city: | 0.9% |
| Wisconsin: | 3.6% |
Ancestries in Woodruff

- 91936.6%German
- 2419.6%Irish
- 2128.5%Polish
- 1887.5%Norwegian
- 1696.7%Other
- 1285.1%English
- 1034.1%French
- 963.8%Czech
- 963.8%Swedish
- 642.6%Italian
- 502.0%United States
- 441.8%Danish
- 391.6%Lithuanian
- 241.0%French Canadian
- 230.9%Scottish
- 220.9%Dutch
- 220.9%Swiss
- 200.8%Hungarian
- 140.6%Scotch-Irish
- 90.4%Greek
- 90.4%Slovak
- 80.3%Russian
- 40.2%Ukrainian
- 40.2%Welsh