Races in Winston-Salem, North Carolina (NC) Detailed Stats
Data:
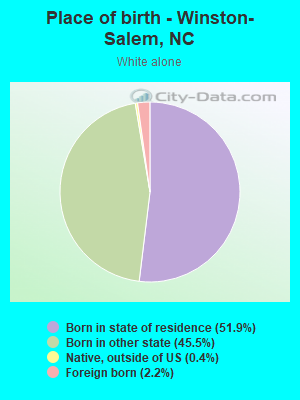
Races - White alone (%)
Races - White alone (% change since 2000)
Races - Black alone (%)
Races - Black alone (% change since 2000)
Races - American Indian alone (%)
Races - American Indian alone (% change since 2000)
Races - Asian alone (%)
Races - Asian alone (% change since 2000)
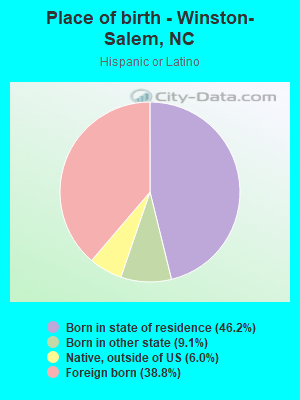
Races - Hispanic (%)
Races - Hispanic (% change since 2000)
Races - Native Hawaiian and Other Pacific Islander alone (%)
Races - Native Hawaiian and Other Pacific Islander alone (% change since 2000)
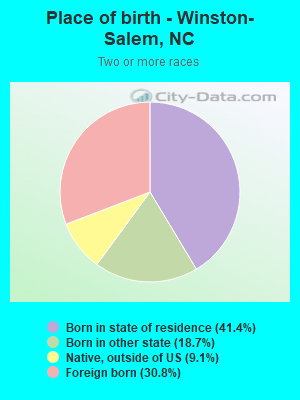
Races - Two or more races(%)
Races - Two or more races(% change since 2000)
Races - Other race alone (%)
Races - Other race alone (% change since 2000)
Racial diversity
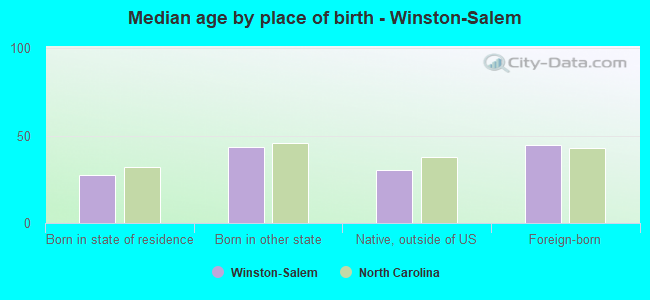
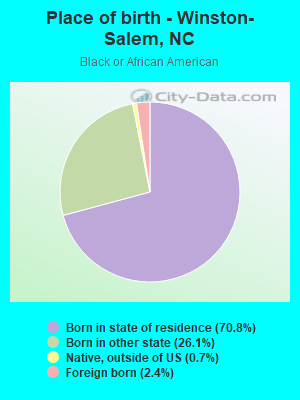
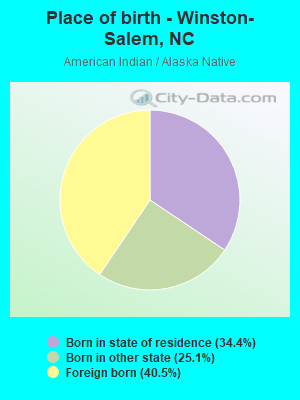
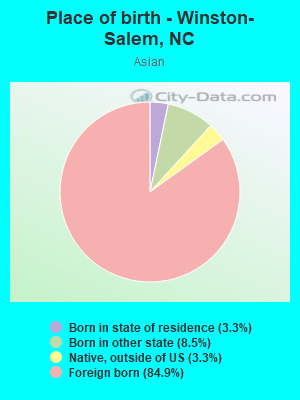
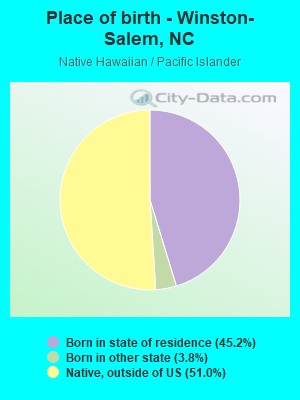
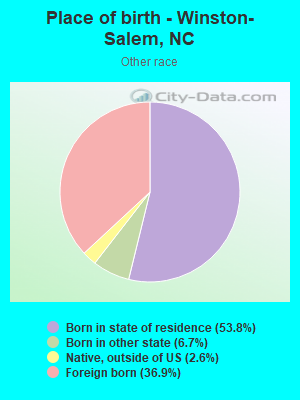
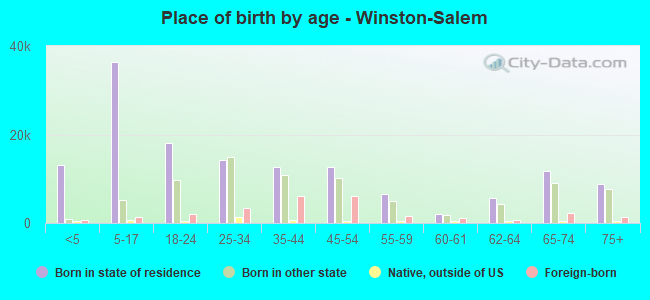
Place of birth - Born in state of residence (%)
Place of birth - Born in state of residence (%) - White
Place of birth - Born in state of residence (%) - Black or African American
Place of birth - Born in state of residence (%) - Asian
Place of birth - Born in state of residence (%) - Hispanic or Latino
Place of birth - Born in state of residence (%) - American Indian and Alaska Native
Place of birth - Born in state of residence (%) - Multirace
Place of birth - Born in state of residence (%) - Other Race
Place of birth - Born in other state (%)
Place of birth - Born in other state (%) - White
Place of birth - Born in other state (%) - Black or African American
Place of birth - Born in other state (%) - Asian
Place of birth - Born in other state (%) - Hispanic or Latino
Place of birth - Born in other state (%) - American Indian and Alaska Native
Place of birth - Born in other state (%) - Multirace
Place of birth - Born in other state (%) - Other Race
Place of birth - Native, outside of US (%)
Place of birth - Native, outside of US (%) - White
Place of birth - Native, outside of US (%) - Black or African American
Place of birth - Native, outside of US (%) - Asian
Place of birth - Native, outside of US (%) - Hispanic or Latino
Place of birth - Native, outside of US (%) - American Indian and Alaska Native
Place of birth - Native, outside of US (%) - Multirace
Place of birth - Native, outside of US (%) - Other Race
Place of birth - Foreign born (%)
Place of birth - Foreign born (%) - White
Place of birth - Foreign born (%) - Black or African American
Place of birth - Foreign born (%) - Asian
Place of birth - Foreign born (%) - Hispanic or Latino
Place of birth - Foreign born (%) - American Indian and Alaska Native
Place of birth - Foreign born (%) - Multirace
Place of birth - Foreign born (%) - Other Race
Residents speaking English at home (%)
Residents speaking English at home - Born in the United States (%)
Residents speaking English at home - Native, born elsewhere (%)
Residents speaking English at home - Foreign born (%)
Residents speaking Spanish at home (%)
Residents speaking Spanish at home - Born in the United States (%)
Residents speaking Spanish at home - Native, born elsewhere (%)
Residents speaking Spanish at home - Foreign born (%)
Residents speaking other language at home (%)
Residents speaking other language at home - Born in the United States (%)
Residents speaking other language at home - Native, born elsewhere (%)
Residents speaking other language at home - Foreign born (%)
Marital status - Never married (%)
Marital status - Now married (%)
Marital status - Separated (%)
Marital status - Widowed (%)
Marital status - Divorced (%)
Ancestries Reported - Arab (%)
Ancestries Reported - Czech (%)
Ancestries Reported - Danish (%)
Ancestries Reported - Dutch (%)
Ancestries Reported - English (%)
Ancestries Reported - French (%)
Ancestries Reported - French Canadian (%)
Ancestries Reported - German (%)
Ancestries Reported - Greek (%)
Ancestries Reported - Hungarian (%)
Ancestries Reported - Irish (%)
Ancestries Reported - Italian (%)
Ancestries Reported - Lithuanian (%)
Ancestries Reported - Norwegian (%)
Ancestries Reported - Polish (%)
Ancestries Reported - Portuguese (%)
Ancestries Reported - Russian (%)
Ancestries Reported - Scotch-Irish (%)
Ancestries Reported - Scottish (%)
Ancestries Reported - Slovak (%)
Ancestries Reported - Subsaharan African (%)
Ancestries Reported - Swedish (%)
Ancestries Reported - Swiss (%)
Ancestries Reported - Ukrainian (%)
Ancestries Reported - United States (%)
Ancestries Reported - Welsh (%)
Ancestries Reported - West Indian (%)
Ancestries Reported - Other (%)
Geographical mobility - Same house 1 year ago (%)
Geographical mobility - Same house 1 year ago (%) - White
Geographical mobility - Same house 1 year ago (%) - Black or African American
Geographical mobility - Same house 1 year ago (%) - Asian
Geographical mobility - Same house 1 year ago (%) - Hispanic or Latino
Geographical mobility - Same house 1 year ago (%) - American Indian and Alaska Native
Geographical mobility - Same house 1 year ago (%) - Multirace
Geographical mobility - Same house 1 year ago (%) - Other Race
Geographical mobility - Moved within same county (%)
Geographical mobility - Moved within same county (%) - White
Geographical mobility - Moved within same county (%) - Black or African American
Geographical mobility - Moved within same county (%) - Asian
Geographical mobility - Moved within same county (%) - Hispanic or Latino
Geographical mobility - Moved within same county (%) - American Indian and Alaska Native
Geographical mobility - Moved within same county (%) - Multirace
Geographical mobility - Moved within same county (%) - Other Race
Geographical mobility - Moved from different county within same state (%)
Geographical mobility - Moved from different county within same state (%) - White
Geographical mobility - Moved from different county within same state (%) - Black or African American
Geographical mobility - Moved from different county within same state (%) - Asian
Geographical mobility - Moved from different county within same state (%) - Hispanic or Latino
Geographical mobility - Moved from different county within same state (%) - American Indian and Alaska Native
Geographical mobility - Moved from different county within same state (%) - Multirace
Geographical mobility - Moved from different county within same state (%) - Other Race
Geographical mobility - Moved from different state (%)
Geographical mobility - Moved from different state (%) - White
Geographical mobility - Moved from different state (%) - Black or African American
Geographical mobility - Moved from different state (%) - Asian
Geographical mobility - Moved from different state (%) - Hispanic or Latino
Geographical mobility - Moved from different state (%) - American Indian and Alaska Native
Geographical mobility - Moved from different state (%) - Multirace
Geographical mobility - Moved from different state (%) - Other Race
Geographical mobility - Moved from abroad (%)
Geographical mobility - Moved from abroad (%) - White
Geographical mobility - Moved from abroad (%) - Black or African American
Geographical mobility - Moved from abroad (%) - Asian
Geographical mobility - Moved from abroad (%) - Hispanic or Latino
Geographical mobility - Moved from abroad (%) - American Indian and Alaska Native
Geographical mobility - Moved from abroad (%) - Multirace
Geographical mobility - Moved from abroad (%) - Other Race
Place of birth for the foreign-born population - Ireland (%)
Place of birth for the foreign-born population - Denmark (%)
Place of birth for the foreign-born population - Norway (%)
Place of birth for the foreign-born population - Sweden (%)
Place of birth for the foreign-born population - United Kingdom (%)
Place of birth for the foreign-born population - England (%)
Place of birth for the foreign-born population - Scotland (%)
Place of birth for the foreign-born population - Other Northern Europe (%)
Place of birth for the foreign-born population - Austria (%)
Place of birth for the foreign-born population - Belgium (%)
Place of birth for the foreign-born population - France (%)
Place of birth for the foreign-born population - Germany (%)
Place of birth for the foreign-born population - Netherlands (%)
Place of birth for the foreign-born population - Switzerland (%)
Place of birth for the foreign-born population - Other Western Europe (%)
Place of birth for the foreign-born population - Greece (%)
Place of birth for the foreign-born population - Italy (%)
Place of birth for the foreign-born population - Portugal (%)
Place of birth for the foreign-born population - Spain (%)
Place of birth for the foreign-born population - Other Southern Europe (%)
Place of birth for the foreign-born population - Albania (%)
Place of birth for the foreign-born population - Belarus (%)
Place of birth for the foreign-born population - Bosnia and Herzegovina (%)
Place of birth for the foreign-born population - Bulgaria (%)
Place of birth for the foreign-born population - Croatia (%)
Place of birth for the foreign-born population - Czechoslovakia (%)
Place of birth for the foreign-born population - Hungary (%)
Place of birth for the foreign-born population - Latvia (%)
Place of birth for the foreign-born population - Lithuania (%)
Place of birth for the foreign-born population - North Macedonia (Macedonia) (%)
Place of birth for the foreign-born population - Moldova (%)
Place of birth for the foreign-born population - Poland (%)
Place of birth for the foreign-born population - Romania (%)
Place of birth for the foreign-born population - Russia (%)
Place of birth for the foreign-born population - Serbia (%)
Place of birth for the foreign-born population - Ukraine (%)
Place of birth for the foreign-born population - Other Eastern Europe (%)
Place of birth for the foreign-born population - China (%)
Place of birth for the foreign-born population - Hong Kong (%)
Place of birth for the foreign-born population - Taiwan (%)
Place of birth for the foreign-born population - Japan (%)
Place of birth for the foreign-born population - Korea (%)
Place of birth for the foreign-born population - Other Eastern Asia (%)
Place of birth for the foreign-born population - Afghanistan (%)
Place of birth for the foreign-born population - Bangladesh (%)
Place of birth for the foreign-born population - India (%)
Place of birth for the foreign-born population - Iran (%)
Place of birth for the foreign-born population - Kazakhstan (%)
Place of birth for the foreign-born population - Nepal (%)
Place of birth for the foreign-born population - Pakistan (%)
Place of birth for the foreign-born population - Sri Lanka (%)
Place of birth for the foreign-born population - Uzbekistan (%)
Place of birth for the foreign-born population - Other South Central Asia (%)
Place of birth for the foreign-born population - Burma (%)
Place of birth for the foreign-born population - Cambodia (%)
Place of birth for the foreign-born population - Indonesia (%)
Place of birth for the foreign-born population - Laos (%)
Place of birth for the foreign-born population - Malaysia (%)
Place of birth for the foreign-born population - Philippines (%)
Place of birth for the foreign-born population - Singapore (%)
Place of birth for the foreign-born population - Thailand (%)
Place of birth for the foreign-born population - Vietnam (%)
Place of birth for the foreign-born population - Other South Eastern Asia (%)
Place of birth for the foreign-born population - Armenia (%)
Place of birth for the foreign-born population - Iraq (%)
Place of birth for the foreign-born population - Israel (%)
Place of birth for the foreign-born population - Jordan (%)
Place of birth for the foreign-born population - Kuwait (%)
Place of birth for the foreign-born population - Lebanon (%)
Place of birth for the foreign-born population - Saudi Arabia (%)
Place of birth for the foreign-born population - Syria (%)
Place of birth for the foreign-born population - Turkey (%)
Place of birth for the foreign-born population - Yemen (%)
Place of birth for the foreign-born population - Other Western Asia (%)
Place of birth for the foreign-born population - Eritrea (%)
Place of birth for the foreign-born population - Ethiopia (%)
Place of birth for the foreign-born population - Kenya (%)
Place of birth for the foreign-born population - Somalia (%)
Place of birth for the foreign-born population - Uganda (%)
Place of birth for the foreign-born population - Zimbabwe (%)
Place of birth for the foreign-born population - Other Eastern Africa (%)
Place of birth for the foreign-born population - Cameroon (%)
Place of birth for the foreign-born population - Congo (%)
Place of birth for the foreign-born population - Democratic Republic of Congo (Zaire) (%)
Place of birth for the foreign-born population - Other Middle Africa (%)
Place of birth for the foreign-born population - Egypt (%)
Place of birth for the foreign-born population - Morocco (%)
Place of birth for the foreign-born population - Sudan (%)
Place of birth for the foreign-born population - Other Northern Africa (%)
Place of birth for the foreign-born population - South Africa (%)
Place of birth for the foreign-born population - Other Southern Africa (%)
Place of birth for the foreign-born population - Cabo Verde (%)
Place of birth for the foreign-born population - Ghana (%)
Place of birth for the foreign-born population - Liberia (%)
Place of birth for the foreign-born population - Nigeria (%)
Place of birth for the foreign-born population - Senegal (%)
Place of birth for the foreign-born population - Sierra Leone (%)
Place of birth for the foreign-born population - Other Western Africa (%)
Place of birth for the foreign-born population - Australia (%)
Place of birth for the foreign-born population - New Zealand (%)
Place of birth for the foreign-born population - Fiji (%)
Place of birth for the foreign-born population - Micronesia (%)
Place of birth for the foreign-born population - Bahamas (%)
Place of birth for the foreign-born population - Barbados (%)
Place of birth for the foreign-born population - Cuba (%)
Place of birth for the foreign-born population - Dominica (%)
Place of birth for the foreign-born population - Dominican Republic (%)
Place of birth for the foreign-born population - Grenada (%)
Place of birth for the foreign-born population - Haiti (%)
Place of birth for the foreign-born population - Jamaica (%)
Place of birth for the foreign-born population - St. Vincent and the Grenadines (%)
Place of birth for the foreign-born population - Trinidad and Tobago (%)
Place of birth for the foreign-born population - West Indies (%)
Place of birth for the foreign-born population - Other Caribbean (%)
Place of birth for the foreign-born population - Belize (%)
Place of birth for the foreign-born population - Costa Rica (%)
Place of birth for the foreign-born population - El Salvador (%)
Place of birth for the foreign-born population - Guatemala (%)
Place of birth for the foreign-born population - Honduras (%)
Place of birth for the foreign-born population - Mexico (%)
Place of birth for the foreign-born population - Nicaragua (%)
Place of birth for the foreign-born population - Panama (%)
Place of birth for the foreign-born population - Other Central America (%)
Place of birth for the foreign-born population - Argentina (%)
Place of birth for the foreign-born population - Bolivia (%)
Place of birth for the foreign-born population - Brazil (%)
Place of birth for the foreign-born population - Chile (%)
Place of birth for the foreign-born population - Colombia (%)
Place of birth for the foreign-born population - Ecuador (%)
Place of birth for the foreign-born population - Guyana (%)
Place of birth for the foreign-born population - Peru (%)
Place of birth for the foreign-born population - Uruguay (%)
Place of birth for the foreign-born population - Venezuela (%)
Place of birth for the foreign-born population - Other South America (%)
Place of birth for the foreign-born population - Canada (%)
Place of birth for the foreign-born population - Other Northern America (%)
Place of birth for the foreign-born population - Other (%)
Latest news about races in Winston-Salem, NC collected exclusively by city-data.com from local newspapers, TV, and radio stations
According to 2022 data, the most numerous races in Winston-Salem, NC are White alone (108,978 residents), Black alone (83,884 residents), and Hispanic (42,223 residents). 80.6% of Winston-Salem residents speak English at home. 10.9% of Winston-Salem, NC residents are foreign-born (6.9% born in Latin America, 2.1% born in Asia), which is 26.5% greater than the foreign-born rate of 8.0% across the entire state of North Carolina.
Race distribution in Winston-Salem
2000 2022
97,420 52.4% White alone 67,648 36.4% Black alone 16,043 8.6% Hispanic 2,082 1.1% Asian alone 1,819 1.0% Two or more races 453 0.2% American Indian alone 267 0.1% Other race alone 44 0.02% Native Hawaiian and Other
108,978 43.4% White alone 83,884 33.4% Black alone 42,223 16.8% Hispanic 7,263 2.9% Two or more races 6,909 2.7% Asian alone 1,588 0.6% Other race alone 303 0.1% Native Hawaiian and Other 195 0.08% American Indian alone
2000 2022
5,647,155 70.2% White alone 1,723,301 21.4% Black alone 378,963 4.7% Hispanic 112,416 1.4% Asian alone 95,333 1.2% American Indian alone 79,965 1.0% Two or more races 9,015 0.1% Other race alone 3,165 0.04% Native Hawaiian and Other
6,497,519 60.7% White alone 2,155,650 20.1% Black alone 1,114,799 10.4% Hispanic 438,061 4.1% Two or more races 341,052 3.2% Asian alone 91,758 0.9% American Indian alone 50,180 0.5% Other race alone 9,954 0.09% Native Hawaiian and Other
Income and house value in Winston-Salem Median household income in 2022 $71,495 White non-Hispanic householders$40,698 Black householders$2,499 American Indian and Alaska Native householders$87,193 Asian householders$47,956 Some other race householders$49,503 Two or more races householders$49,237 Hispanic or Latino race householdersMedian 2022 house value $280,267 White Non-Hispanic householders$175,137 Black or African American householders$215,175 American Indian or Alaska Native householders $279,096 Asian householders$175,606 Native Hawaiian and other Pacific Islander householders$204,405 Some other race householders$243,975 Two or more races householders$198,551 Hispanic or Latino householders
Median age by race in Winston-Salem
42.3 Median age for White residents39.9 43.5 34.6 Median age for Black or African American residents33.8 34.6 47.9 Median age for American Indian / Alaska Native residents-666,666,666.0 57.5 32.1 Median age for Asian residents33.0 32.1 50.2 Median age for Native Hawaiian / Pacific Islander residents8.2 45.0 22.2 Median age for Other race residents20.8 22.5 29.4 Median age for Two or more races residents26.9 30.6 43.3 Median age for White alone residents41.0 44.3 24.1 Median age for Hispanic or Latino residents24.1 23.0
Owner/renter occupied households by race in Winston-Salem
House owners and renters - White residents 33,050 64.0% Owner occupied18,601 36.0% Renter occupiedHouse owners and renters - Black or African American residents 15,540 44.5% Owner occupied19,364 55.5% Renter occupiedHouse owners and renters - American Indian / Alaska Native residents 191 67.3% Owner occupied93 32.7% Renter occupiedHouse owners and renters - Asian residents 1,077 53.3% Owner occupied943 46.7% Renter occupiedHouse owners and renters - Native Hawaiian / Pacific Islander residents 40 100.0% Owner occupiedHouse owners and renters - Other race residents 2,242 49.5% Owner occupied2,285 50.5% Renter occupiedHouse owners and renters - Two or more races residents 2,686 36.5% Owner occupied4,670 63.5% Renter occupiedHouse owners and renters - White alone residents 32,648 64.6% Owner occupied17,904 35.4% Renter occupiedHouse owners and renters - Hispanic or Latino residents 4,470 41.7% Owner occupied6,254 58.3% Renter occupied
Language usage in Winston-Salem
English speakers - Total 80.6% of residents of Winston-Salem speak English at home.
14.7% of residents speak Spanish at home 21,339 61.4% Speak English very well13,413 38.6% Speak English less than very well4.7% of residents speak other language at home 8,189 73.0% Speak English very well3,022 27.0% Speak English less than very well
English speakers - Born in the United States 93.3% of residents of Winston-Salem speak English at home.
3.9% of residents speak Spanish at home 2,525 82.7% Speak English very well529 17.3% Speak English less than very well2.8% of residents speak other language at home 1,750 80.2% Speak English very well433 19.8% Speak English less than very well
English speakers - Native, born elsewhere 42.9% of residents of Winston-Salem speak English at home.
52.9% of residents speak Spanish at home 1,485 73.8% Speak English very well526 26.2% Speak English less than very well4.2% of residents speak other language at home 159 100.0% Speak English very well
English speakers - Foreign-born 11.4% of residents of Winston-Salem speak English at home.
60.2% of residents speak Spanish at home 4,840 31.0% Speak English very well10,774 69.0% Speak English less than very well28.4% of residents speak other language at home 4,944 67.2% Speak English very well2,408 32.8% Speak English less than very well
White (Caucasian) - Speak only English Native:
95.7% (100,705)Foreign-born:
27.5% (1,029)
White (Caucasian) - Speak another language Native:
4.3% (4,516)Foreign-born:
72.5% (2,716)
Black or African American - Speak only English Native:
96.7% (76,101)Foreign-born:
2.0% (42)
Black or African American - Speak another language Native:
3.3% (2,604)Foreign-born:
98.0% (2,019)
American Indian / Alaska Native - Speak only English Native:
57.4% (327)Foreign-born:
2.3% (10)
American Indian / Alaska Native - Speak another language Native:
53.0% (302)Foreign-born:
100.0% (422)
Asian - Speak only English Native:
82.4% (770)Foreign-born:
21.5% (1,149)
Asian - Speak another language Native:
17.6% (165)Foreign-born:
78.5% (4,189)
Other race - Speak only English Native:
19.1% (2,149)Foreign-born:
5.1% (392)
Other race - Speak another language Native:
80.9% (9,118)Foreign-born:
94.9% (7,289)
Two or more races - Speak only English Native:
54.3% (7,699)Foreign-born:
4.3% (304)
Two or more races - Speak another language Native:
45.7% (6,467)Foreign-born:
95.7% (6,697)
White alone - Speak only English Native:
97.0% (99,194)Foreign-born:
40.4% (968)
White alone - Speak another language Native:
3.0% (3,018)Foreign-born:
59.6% (1,429)
Hispanic or Latino - Speak only English Native:
25.0% (5,566)Foreign-born:
3.8% (614)
Hispanic or Latino - Speak another language Native:
75.0% (16,669)Foreign-born:
96.2% (15,646)
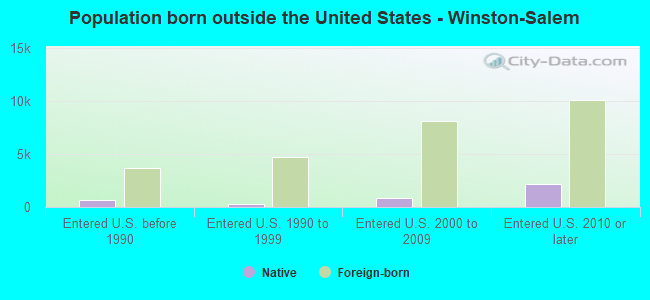
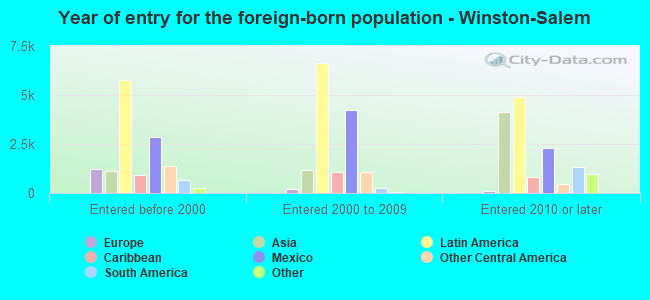
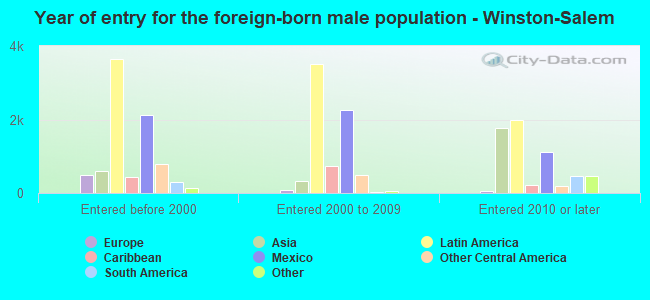
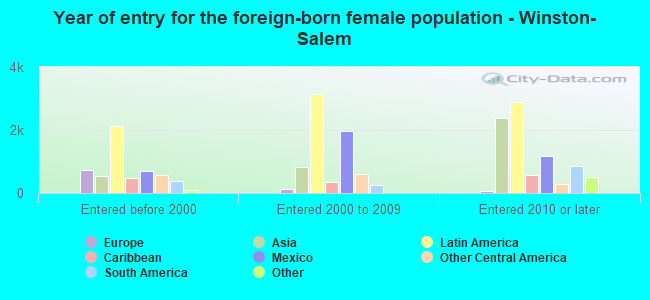
Foreign-born residents in Winston-Salem 27,532 residents are foreign born (6.9% Latin America , 2.1% Asia ).
This city:
10.9%North Carolina:
8.3%
Marital status for residents in Winston-Salem Marital status - White (Caucasian) population 15 years and over
Males 34.8% Never married50.0% Now married1.8% Separated3.5% Widowed9.8% DivorcedFemales 30.0% Never married43.8% Now married2.9% Separated9.6% Widowed13.7% DivorcedWomen who gave birth in the past 12 months Now married:
91.3% (822)Unmarried:
8.7% (78)
Women who did not give birth in the past 12 months Now married:
40.9% (10,668)Unmarried:
59.1% (15,393)
Marital status - Black or African American population 15 years and over
Males 49.2% Never married39.1% Now married2.7% Separated1.6% Widowed7.4% DivorcedFemales 56.1% Never married23.6% Now married1.5% Separated6.6% Widowed12.1% DivorcedWomen who gave birth in the past 12 months Now married:
22.2% (274)Unmarried:
77.8% (961)
Women who did not give birth in the past 12 months Now married:
15.7% (3,529)Unmarried:
84.3% (18,924)
Marital status - American Indian / Alaska Native population 15 years and over
Males 55.3% Never married29.2% Now married3.3% Separated0.0% Widowed12.2% DivorcedFemales 47.1% Never married40.7% Now married0.0% Separated7.1% Widowed5.1% DivorcedWomen who gave birth in the past 12 months Now married:
100.0% (13)Unmarried:
0.0% (0)
Women who did not give birth in the past 12 months Now married:
29.9% (59)Unmarried:
70.1% (139)
Marital status - Asian population 15 years and over
Males 29.4% Never married67.3% Now married0.0% Separated1.0% Widowed2.2% DivorcedFemales 36.8% Never married52.5% Now married2.3% Separated2.5% Widowed5.9% DivorcedWomen who gave birth in the past 12 months Now married:
100.0% (224)Unmarried:
0.0% (0)
Women who did not give birth in the past 12 months Now married:
25.2% (592)Unmarried:
74.8% (1,758)
Marital status - Native Hawaiian / Pacific Islander population 15 years and over
Males 48.1% Never married51.9% Now married0.0% Separated0.0% Widowed0.0% DivorcedFemales 63.6% Never married7.3% Now married0.0% Separated29.1% Widowed0.0% DivorcedWomen who did not give birth in the past 12 months Now married:
0.0% (0)Unmarried:
100.0% (25)
Marital status - Other race population 15 years and over
Males 55.4% Never married34.2% Now married5.5% Separated1.1% Widowed3.9% DivorcedFemales 58.5% Never married31.1% Now married3.0% Separated3.7% Widowed3.8% DivorcedWomen who gave birth in the past 12 months Now married:
36.1% (116)Unmarried:
63.9% (205)
Women who did not give birth in the past 12 months Now married:
35.8% (2,013)Unmarried:
64.2% (3,608)
Marital status - Two or more races population 15 years and over
Males 50.4% Never married32.9% Now married2.9% Separated9.7% Widowed4.1% DivorcedFemales 39.6% Never married39.9% Now married3.4% Separated8.6% Widowed8.6% DivorcedWomen who gave birth in the past 12 months Now married:
44.1% (319)Unmarried:
55.9% (405)
Women who did not give birth in the past 12 months Now married:
37.8% (1,951)Unmarried:
62.2% (3,206)
Marital status - White alone, not Hispanic / Latino population 15 years and over
Males 33.3% Never married51.0% Now married1.8% Separated3.7% Widowed10.2% DivorcedFemales 29.0% Never married44.3% Now married3.0% Separated9.9% Widowed13.8% DivorcedWomen who gave birth in the past 12 months Now married:
91.3% (822)Unmarried:
8.7% (78)
Women who did not give birth in the past 12 months Now married:
41.9% (10,322)Unmarried:
58.1% (14,304)
Marital status - Hispanic or Latino population 15 years and over
Males 52.3% Never married33.9% Now married4.6% Separated5.7% Widowed3.5% DivorcedFemales 50.7% Never married35.1% Now married1.4% Separated5.1% Widowed7.6% DivorcedWomen who gave birth in the past 12 months Now married:
17.3% (165)Unmarried:
82.7% (787)
Women who did not give birth in the past 12 months Now married:
34.6% (3,668)Unmarried:
65.4% (6,933)
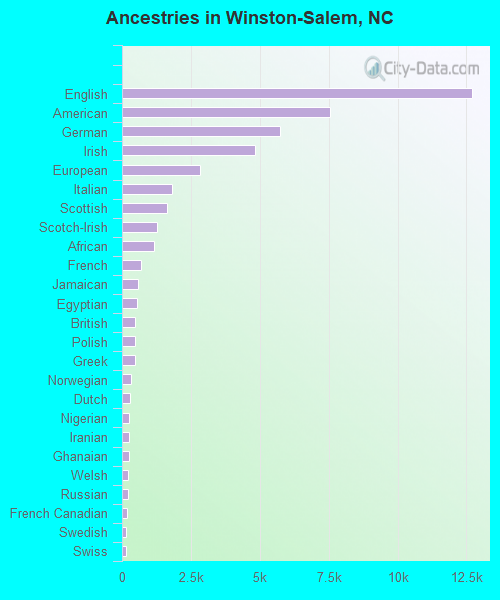
Ancestries in Winston-Salem
12,686 8.6% English7,553 5.1% American5,750 3.9% German4,839 3.3% Irish2,815 1.9% European1,820 1.2% Italian1,626 1.1% Scottish1,259 0.9% Scotch-Irish1,173 0.8% African680 0.5% French574 0.4% Jamaican540 0.4% Egyptian483 0.3% British458 0.3% Polish454 0.3% Greek310 0.2% Norwegian284 0.2% Dutch245 0.2% Nigerian239 0.2% Iranian238 0.2% Ghanaian235 0.2% Welsh201 0.1% Russian191 0.1% French Canadian159 0.1% Swedish156 0.1% Swiss147 0.10% Sudanese144 0.10% Senegalese138 0.09% Eastern European136 0.09% Czech133 0.09% Zimbabwean127 0.09% Haitian117 0.08% Northern European105 0.07% New Zealander100 0.07% Guyanese98 0.07% Scandinavian97 0.07% Moroccan96 0.06% Hungarian96 0.06% Ukrainian92 0.06% Romanian79 0.05% Danish78 0.05% Croatian76 0.05% Lebanese74 0.05% Brazilian71 0.05% Canadian67 0.05% Portuguese63 0.04% Estonian62 0.04% Ugandan59 0.04% Arab55 0.04% Slovak49 0.03% Austrian41 0.03% Czechoslovakian31 0.02% Pennsylvania German29 0.02% Finnish29 0.02% Armenian28 0.02% West Indian27 0.02% Celtic27 0.02% Kenyan25 0.02% Cape Verdean24 0.02% Trinidadian and Tobagonian22 0.01% Turkish21 0.01% Australian15 0.01% Lithuanian14 0.01% Serbian13 0.01% U.S. Virgin Islander11 0.01% Yugoslavian10 0.01% Israeli8 0.01% Slavic8 0.01% Ethiopian
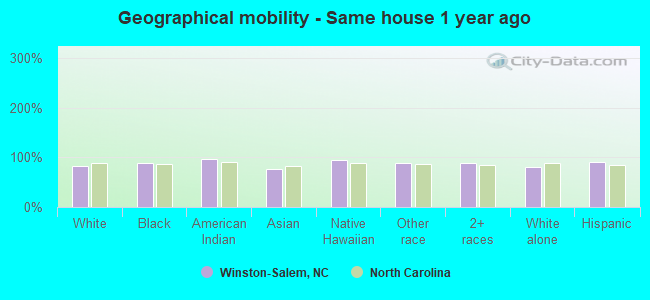
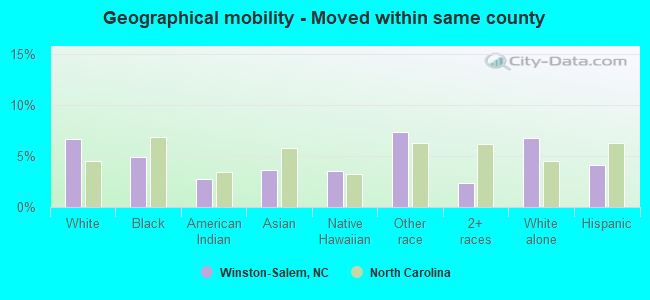
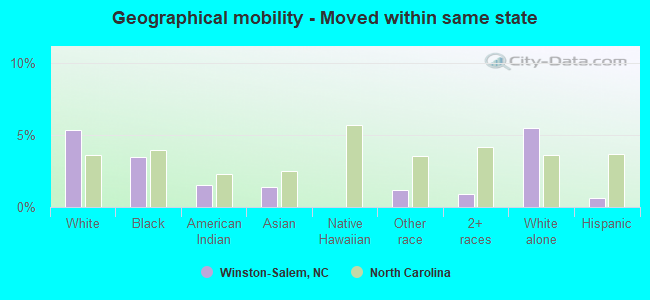
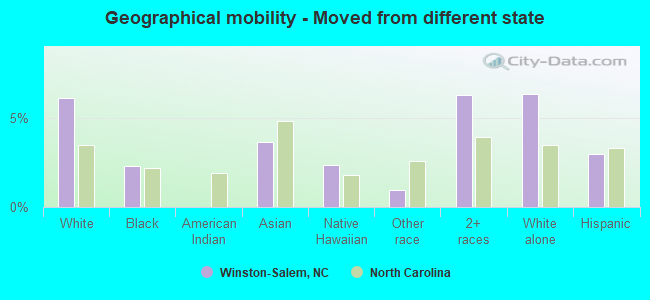
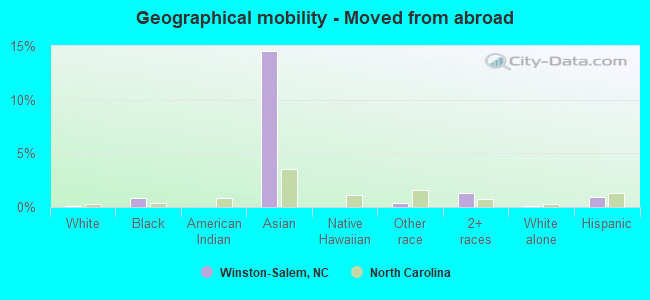
Geographical mobility in Winston-Salem Same house 1 year ago 92,076 81.8% White (Caucasian)75,474 88.5% Black or African American887 96.4% American Indian / Alaska Native5,347 76.9% Asian193 94.7% Native Hawaiian / Pacific Islander15,274 89.5% Other race19,809 89.1% Two or more races87,694 81.3% White alone, not Hispanic / Latino37,392 91.4% Hispanic or LatinoMoved within same county 7,503 6.7% White / Caucasian4,176 4.9% Black or African American26 2.8% American Indian / Alaska Native250 3.6% Asian7 3.5% Native Hawaiian / Pacific Islander1,262 7.4% Other race530 2.4% Two or more races7,353 6.8% White alone, not Hispanic / Latino1,673 4.1% Hispanic or LatinoMoved within same state 5,989 5.3% White / Caucasian2,982 3.5% Black or African American14 1.5% American Indian / Alaska Native98 1.4% Asian201 1.2% Other race201 0.9% Two or more races5,918 5.5% White alone, not Hispanic / Latino258 0.6% Hispanic or LatinoMoved from different state 6,864 6.1% White / Caucasian1,948 2.3% Black or African American253 3.6% Asian5 2.4% Native Hawaiian / Pacific Islander164 1.0% Other race1,390 6.3% Two or more races6,794 6.3% White alone, not Hispanic / Latino1,203 2.9% Hispanic or LatinoMoved from abroad 84 0.1% White697 0.8% Black or African American1,009 14.5% Asian61 0.4% Other race296 1.3% Two or more races84 0.1% White alone, not Hispanic / Latino367 0.9% Hispanic or Latino
Children Nativity (place of birth) in Winston-Salem
Children under 6 years - Living with two parents Both parents native 6,327 100.0% NativeBoth parents foreign-born 1,601 73.7% Native571 26.3% Foreign-bornOne native, one foreign-born parent 1,113 100.0% NativeChildren under 6 years - Living with one parent Native parent 5,833 100.0% NativeForeign-born parent 1,763 94.4% Native104 5.6% Foreign-bornChildren 6 to 17 years - Living with two parents Both parents native 11,279 100.0% NativeBoth parents foreign-born 5,110 86.6% Native790 13.4% Foreign-bornOne native, one foreign-born parent 1,798 94.0% Native115 6.0% Foreign-bornChildren 6 to 17 years - Living with one parent Native parent 14,042 100.0% NativeForeign-born parent 4,223 51.5% Native3,984 48.5% Foreign-born
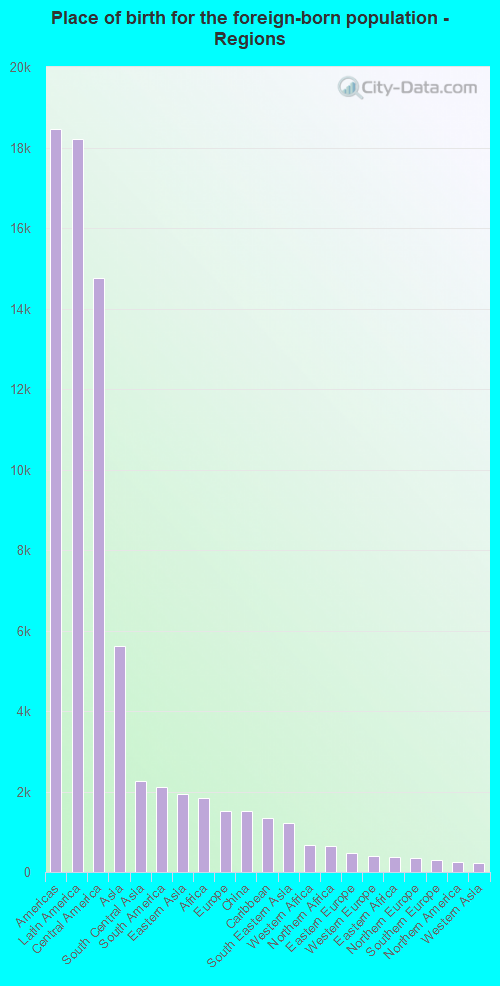
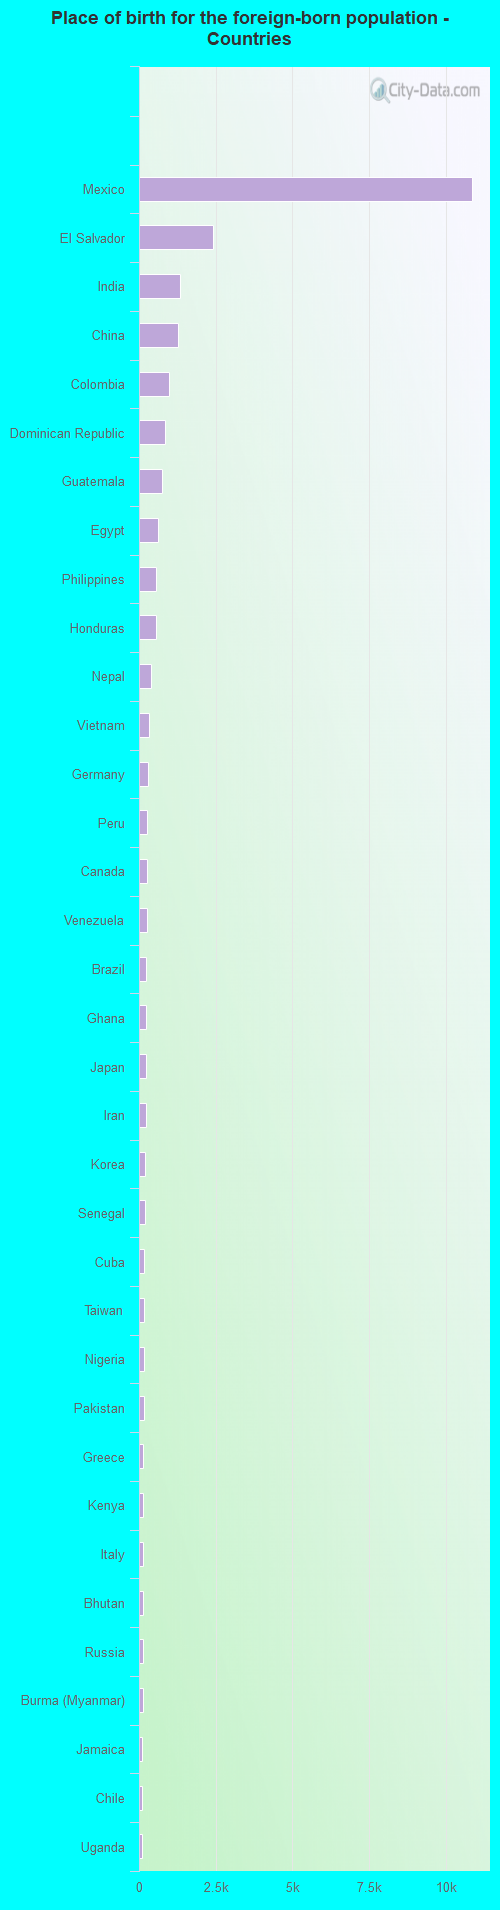
Place of birth for residents in Winston-Salem 18,467 Americas18,212 Latin America14,768 Central America5,614 Asia2,257 South Central Asia2,105 South America1,928 Eastern Asia1,845 Africa1,519 Europe1,512 China1,338 Caribbean1,214 South Eastern Asia683 Western Africa654 Northern Africa475 Eastern Europe395 Western Europe363 Eastern Africa340 Northern Europe309 Southern Europe255 Northern America213 Western Asia85 Oceania85 Australia and New Zealand Subregion22 Middle Africa10,872 Mexico2,422 El Salvador1,347 India1,269 China965 Colombia852 Dominican Republic764 Guatemala617 Egypt540 Philippines540 Honduras382 Nepal335 Vietnam299 Germany263 Peru255 Canada247 Venezuela240 Brazil227 Ghana222 Japan220 Iran193 Korea185 Senegal178 Cuba163 Taiwan153 Nigeria149 Pakistan145 Greece138 Kenya134 Italy127 Bhutan121 Russia116 Burma (Myanmar)113 Jamaica101 Chile100 Uganda94 Thailand90 Uruguay89 Sweden89 Guyana85 England79 Hong Kong72 Nicaragua67 Australia67 Moldova67 Argentina65 Lebanon64 Costa Rica61 Ukraine59 Zimbabwe58 Bosnia and Herzegovina54 Indonesia49 Hungary49 Haiti45 France43 Norway43 Ireland40 United Kingdom39 Ecuador35 West Indies35 Turkey33 Austria33 Poland32 Singapore32 Liberia31 Panama31 Jordan29 Czechoslovakia29 Sudan28 Scotland28 Cambodia28 Israel28 Bangladesh22 Democratic Republic of Congo (Zaire)19 Spain17 New Zealand16 United Arab Emirates13 Kuwait11 Romania10 Portugal9 Trinidad and Tobago9 Denmark9 Belgium9 Yemen7 Malaysia7 Eritrea7 Morocco6 Saudi Arabia5 Syria4 Laos1 Croatia
Grandparents responsible for own grandchildren in Winston-Salem
Grandparents (30 to 59 years) White / Caucasian 391 59.0% Responsible for grandchildren272 41.0% Not responsible for grandchildrenBlack or African American 928 49.2% Responsible for grandchildren958 50.8% Not responsible for grandchildrenAsian 209 87.4% Responsible for grandchildren30 12.6% Not responsible for grandchildrenNative Hawaiian / Pacific Islander 14 100.0% Responsible for grandchildrenOther race 206 58.5% Responsible for grandchildren146 41.5% Not responsible for grandchildrenTwo or more races 138 100.0% Responsible for grandchildrenWhite alone, not Hispanic / Latino 327 56.9% Responsible for grandchildren248 43.1% Not responsible for grandchildrenHispanic or Latino 343 61.4% Responsible for grandchildren216 38.6% Not responsible for grandchildrenGrandparents (60 years and over) White / Caucasian 168 32.9% Responsible for grandchildren343 67.1% Not responsible for grandchildrenBlack or African American 508 66.1% Responsible for grandchildren261 33.9% Not responsible for grandchildrenAsian 90 70.1% Responsible for grandchildren38 29.9% Not responsible for grandchildrenNative Hawaiian / Pacific Islander 14 100.0% Not responsible for grandchildrenOther race 203 100.0% Not responsible for grandchildrenTwo or more races 52 31.3% Responsible for grandchildren114 68.7% Not responsible for grandchildrenWhite alone, not Hispanic / Latino 168 32.4% Responsible for grandchildren352 67.6% Not responsible for grandchildrenHispanic or Latino 54 100.0% Not responsible for grandchildren