Races in Windham, New Hampshire (NH) Detailed Stats
Ancestries, Foreign-born residents, place of birth

Recent posts about races in Windham, New Hampshire on our local forum with over 2,400,000 registered users:
 | Windham Relocation (7 replies) |
| Question about moving to Windham NH (21 replies) |
| Cougar/Mountain Lion sighted in Wakefield... off of Route 16 (47 replies) |
| Living between Hanover and Boston (5 replies) |
| Pros and cons of Shifting to New Hampshire from Massachusetts (21 replies) |
| High Speed Internet, like Fios (18 replies) |
Latest news about races in Windham, NH collected exclusively by city-data.com from local newspapers, TV, and radio stations
3.7% of Windham, NH residents are foreign-born (1.2% born in Asia, 1.2% born in Europe, 0.8% born in North America), which is 33.5% less than the foreign-born rate of 5.0% across the entire state of New Hampshire.
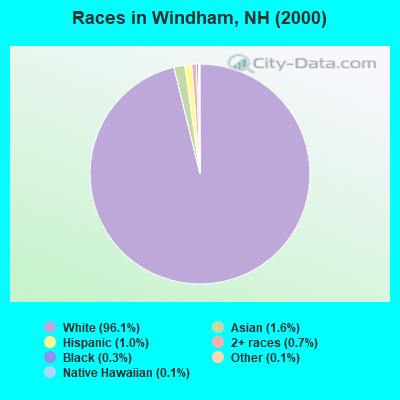
Race distribution in Windham

- 10,29596.1%White alone
- 1671.6%Asian alone
- 1061.0%Hispanic
- 720.7%Two or more races
- 330.3%Black alone
- 160.1%Other race alone
- 130.1%Native Hawaiian and Other
Pacific Islander alone - 70.07%American Indian alone
2000
2022
-
- 1,175,25295.1%White alone
- 20,4891.7%Hispanic
- 15,8031.3%Asian alone
- 11,6060.9%Two or more races
- 8,3540.7%Black alone
- 2,6980.2%American Indian alone
- 1,2540.1%Other race alone
- 3300.03%Native Hawaiian and Other
Pacific Islander alone

-
- 1,208,10186.6%White alone
- 63,4794.5%Hispanic
- 60,7244.4%Two or more races
- 36,5192.6%Asian alone
- 17,9311.3%Black alone
- 6,6150.5%Other race alone
- 1,0140.07%American Indian alone
- 8480.06%Native Hawaiian and Other
Pacific Islander alone

Income and house value in Windham
- Median household income in 2022
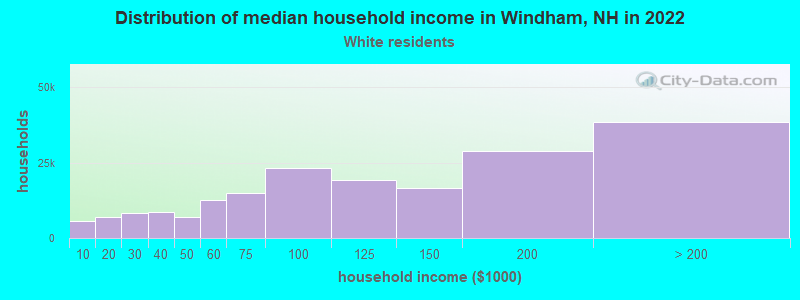
- $175,983White non-Hispanic householders
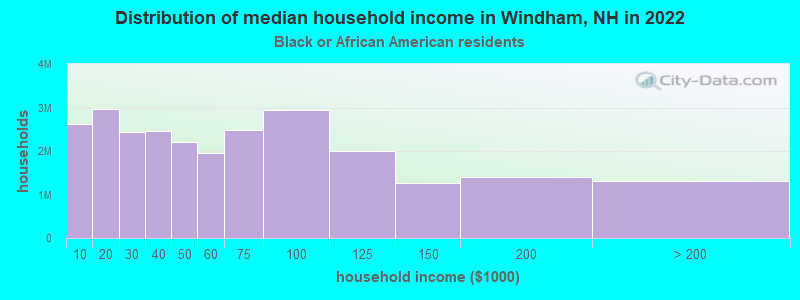
- $72,309Black householders
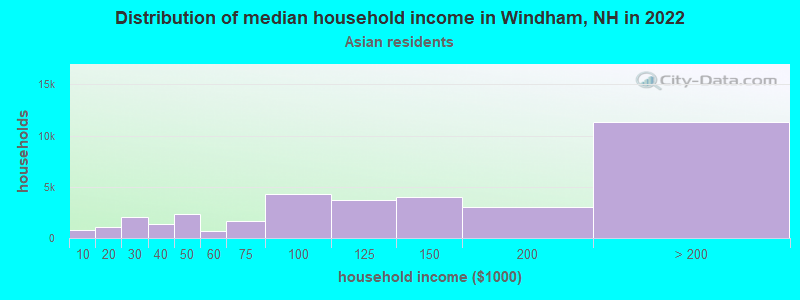
- over $200,000Asian householders
- $180,390Some other race householders
- $48,577Two or more races householders
- over $200,000Hispanic or Latino race householders
- Median 2022 house value
- $702,480White Non-Hispanic householders
- $776,731Black or African American householders
- $861,982Asian householders
- $987,872Some other race householders
- $455,894Hispanic or Latino householders
Household income for White non-Hispanic householders
Household income for Black householders
Household income for Asian householders
Household income for Two or more races householders
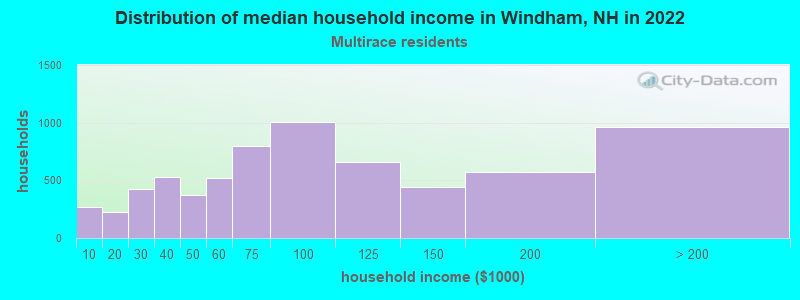
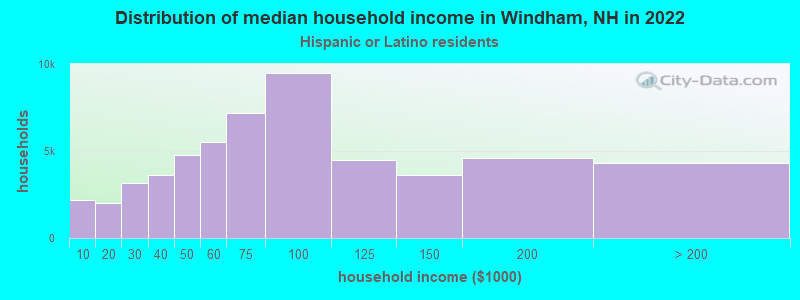
Household income for Hispanic or Latino race householders
Foreign-born residents in Windham
401 residents are foreign born (1.2% Asia, 1.2% Europe, 0.8% North America).
| This city: | 3.7% |
| New Hampshire: | 4.4% |
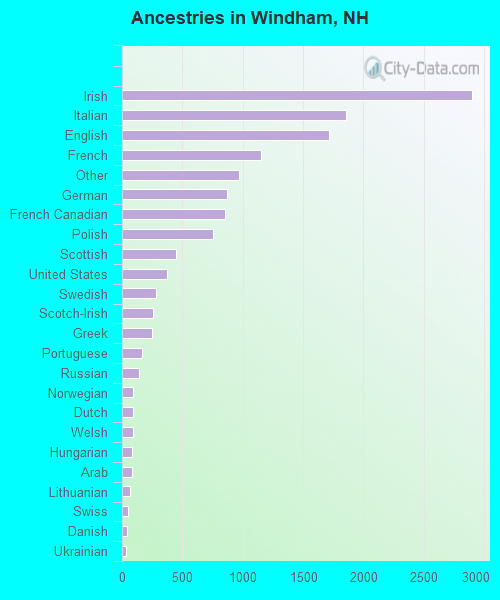
Ancestries in Windham

- 2,89521.3%Irish
- 1,85713.7%Italian
- 1,71312.6%English
- 1,1528.5%French
- 9687.1%Other
- 8686.4%German
- 8516.3%French Canadian
- 7525.5%Polish
- 4483.3%Scottish
- 3732.7%United States
- 2782.0%Swedish
- 2541.9%Scotch-Irish
- 2521.9%Greek
- 1691.2%Portuguese
- 1431.1%Russian
- 910.7%Norwegian
- 900.7%Dutch
- 870.6%Welsh
- 850.6%Hungarian
- 800.6%Arab
- 680.5%Lithuanian
- 530.4%Swiss
- 380.3%Danish
- 310.2%Ukrainian
- 70.05%Slovak
Zip codes: 03087.