Races in Windemere, Texas (TX) Detailed Stats
Ancestries, Foreign-born residents, place of birth

Discuss Windemere, Texas races on our local forum with over 2,400,000 registered users
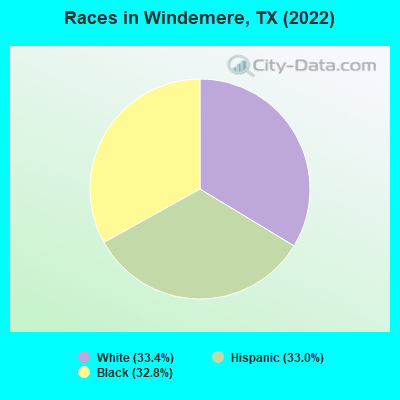
According to 2022 data, the most numerous races in Windemere, TX are Hispanic (294 residents), White alone (298 residents), and Black alone (293 residents). 69.5% of Windemere residents speak English at home. 9.7% of Windemere, TX residents are foreign-born (4.8% born in Africa, 3.6% born in Latin America, 1.3% born in Asia), which is 75.8% less than the foreign-born rate of 17.0% across the entire state of Texas.
Race distribution in Windemere

2000
2022

- 10,933,31352.4%White alone
- 6,669,66632.0%Hispanic
- 2,364,25511.3%Black alone
- 554,4452.7%Asian alone
- 230,5671.1%Two or more races
- 68,8590.3%American Indian alone
- 19,9580.10%Other race alone
- 10,7570.05%Native Hawaiian and Other
Pacific Islander alone

-
- 12,070,64240.2%Hispanic
- 11,683,43038.9%White alone
- 3,508,70611.7%Black alone
- 1,608,1735.4%Asian alone
- 956,5603.2%Two or more races
- 125,7630.4%Other race alone
- 47,0230.2%American Indian alone
- 29,2750.10%Native Hawaiian and Other
Pacific Islander alone

Income and house value in Windemere
- Median household income in 2022
- $83,395White non-Hispanic householders
- $49,154Black householders
- $104,424American Indian and Alaska Native householders
- $181,223Asian householders
- $42,344Some other race householders
- $124,927Two or more races householders
- $91,195Hispanic or Latino race householders
- Median 2022 house value
- $497,976White Non-Hispanic householders
- $547,459Black or African American householders
- $562,304American Indian or Alaska Native householders
- $563,203Asian householders
- $527,216Some other race householders
- $562,304Two or more races householders
- $492,128Hispanic or Latino householders
Household income for White non-Hispanic householders

Household income for Black householders

Household income for Hispanic or Latino race householders

Median age by race in Windemere
- 31.7Median age for White residents
- 31.4Males
- 31.8Females
- 15.9Median age for Black or African American residents
- 12.2Males
- 32.7Females
- 16.7Median age for Other race residents
- 6.6Males
- 50.5Females
- 31.3Median age for White alone residents
- 35.3Males
- 29.6Females
- 30.9Median age for Hispanic or Latino residents
- 30.5Males
- 43.9Females
Owner/renter occupied households by race in Windemere
- House owners and renters - White residents
- 125.1%Owner occupied
- 22194.9%Renter occupied
- House owners and renters - Black or African American residents
- 115100.0%Renter occupied
- House owners and renters - White alone residents
- 137.8%Owner occupied
- 15092.2%Renter occupied
- House owners and renters - Hispanic or Latino residents
- 111100.0%Renter occupied
Language usage in Windemere
- English speakers - Total
- 69.5% of residents of Windemere speak English at home.
- 24.1% of residents speak Spanish at home
- 17985.2%Speak English very well
- 3114.8%Speak English less than very well
- 8.8% of residents speak other language at home
- 77100.0%Speak English very well
- English speakers - Born in the United States
- 82.2% of residents of Windemere speak English at home.
- 16.0% of residents speak Spanish at home
- 43100.0%Speak English very well
- English speakers - Foreign-born
- 0.0% of residents of Windemere speak English at home.
- 29.4% of residents speak Spanish at home
- 30100.0%Speak English less than very well
- 83.3% of residents speak other language at home
- 85100.0%Speak English very well
White (Caucasian) - Speak another language
| Native: | 25.9% (115) |
| Foreign-born: | 95.1% (30) |
Hispanic or Latino - Speak another language
| Native: | 61.3% (176) |
| Foreign-born: | 97.2% (33) |
Foreign-born residents in Windemere
88 residents are foreign born (4.8% Africa, 3.6% Latin America, 1.3% Asia).
| This city: | 9.7% |
| Texas: | 100.0% |


Marital status for residents in Windemere
Marital status - White (Caucasian) population 15 years and over
- Males
- 52.8%Never married
- 37.3%Now married
- 0.0%Separated
- 0.0%Widowed
- 9.9%Divorced
- Females
- 47.1%Never married
- 20.5%Now married
- 4.0%Separated
- 4.0%Widowed
- 24.2%Divorced
Women who did not give birth in the past 12 months
| Now married: | 15.4% (26) |
| Unmarried: | 84.6% (143) |
Marital status - Black or African American population 15 years and over
- Males
- 100.0%Never married
- 0.0%Now married
- 0.0%Separated
- 0.0%Widowed
- 0.0%Divorced
- Females
- 100.0%Never married
- 0.0%Now married
- 0.0%Separated
- 0.0%Widowed
- 0.0%Divorced
Women who did not give birth in the past 12 months
| Now married: | 0.0% (0) |
| Unmarried: | 100.0% (83) |
Marital status - White alone, not Hispanic / Latino population 15 years and over
- Males
- 17.4%Never married
- 65.2%Now married
- 0.0%Separated
- 0.0%Widowed
- 17.4%Divorced
- Females
- 50.7%Never married
- 31.4%Now married
- 8.6%Separated
- 0.0%Widowed
- 9.3%Divorced
Women who did not give birth in the past 12 months
| Now married: | 73.7% (27) |
| Unmarried: | 26.3% (10) |
Marital status - Hispanic or Latino population 15 years and over
- Males
- 100.0%Never married
- 0.0%Now married
- 0.0%Separated
- 0.0%Widowed
- 0.0%Divorced
- Females
- 43.9%Never married
- 10.8%Now married
- 0.0%Separated
- 7.6%Widowed
- 37.6%Divorced
Women who did not give birth in the past 12 months
| Now married: | 0.0% (0) |
| Unmarried: | 100.0% (182) |
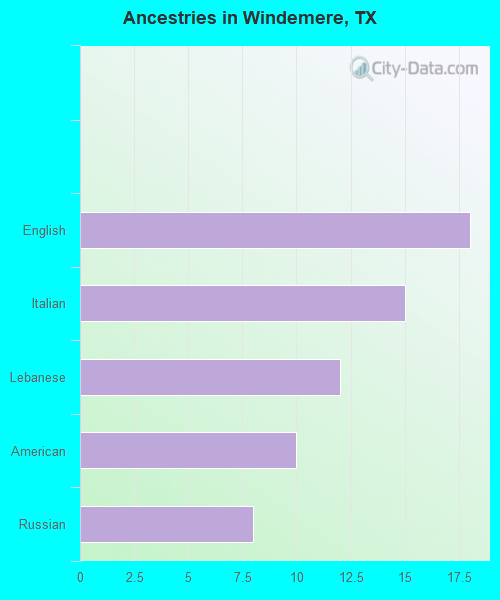
Ancestries in Windemere

- 183.6%English
- 153.0%Italian
- 122.4%Lebanese
- 102.0%American
- 81.6%Russian
Geographical mobility in Windemere

- Same house 1 year ago
- 24749.1%White (Caucasian)
- 9933.2%Black or African American
- 13443.6%White alone, not Hispanic / Latino
- 17257.3%Hispanic or Latino

-
- Moved within same county
- 8617.0%White / Caucasian
- 268.6%White alone, not Hispanic / Latino
- 6521.7%Hispanic or Latino

-
- Moved within same state
- 224.3%White / Caucasian
- 216.9%White alone, not Hispanic / Latino

-
- Moved from different state
- 14228.2%White / Caucasian
- 24782.2%Black or African American
- 13443.7%White alone, not Hispanic / Latino
- 217.1%Hispanic or Latino

Children Nativity (place of birth) in Windemere
Place of birth for residents in Windemere
![Place of birth for the foreign-born population - Regions]()
- 43Africa
- 43Eastern Africa
- 33Americas
- 33Latin America
- 33Caribbean
- 12Asia
- 12Western Asia

Zip codes: 78660.