Races in Wilmington Manor, Delaware (DE) Detailed Stats
Ancestries, Foreign-born residents, place of birth
Settings
X


Discuss Wilmington Manor, Delaware races on our local forum with over 2,400,000 registered users
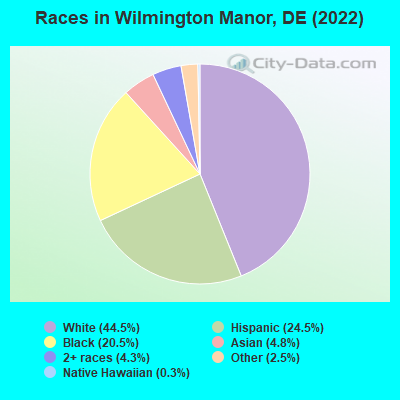
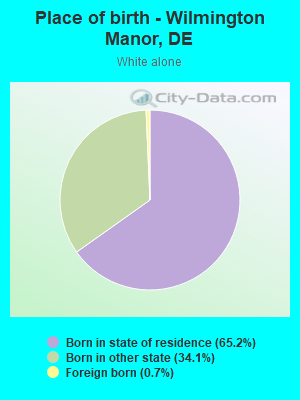
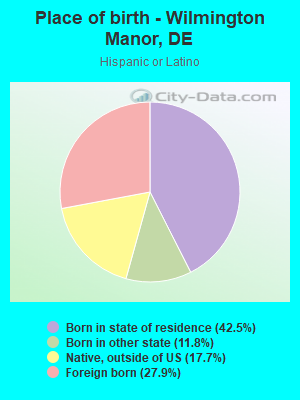
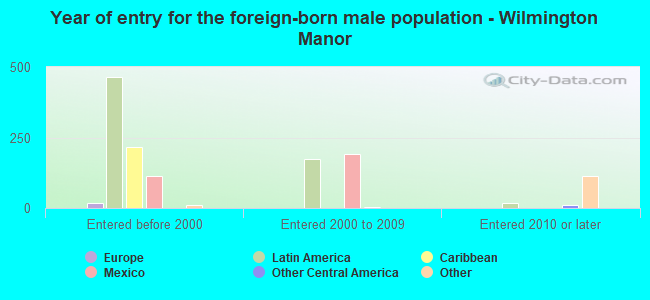
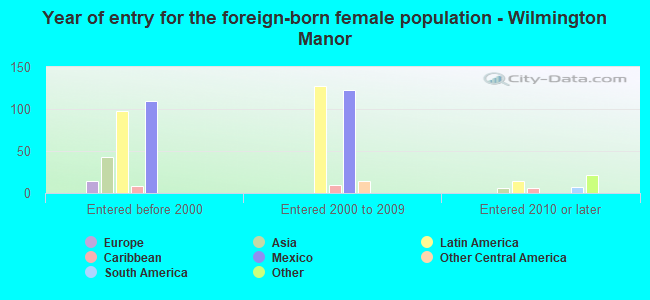
According to 2022 data, the most numerous races in Wilmington Manor, DE are White alone (3,707 residents), Black alone (1,708 residents), and Hispanic (2,042 residents). 79.3% of Wilmington Manor residents speak English at home. 13.4% of Wilmington Manor, DE residents are foreign-born (11.1% born in Latin America), which is 32.6% greater than the foreign-born rate of 9.0% across the entire state of Delaware.
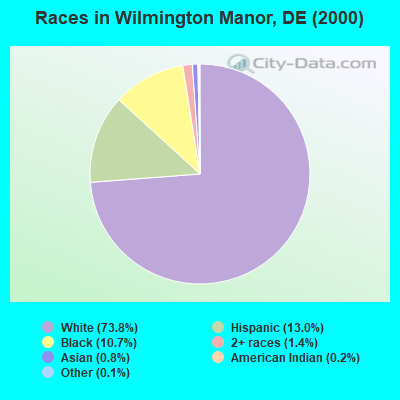
Race distribution in Wilmington Manor
2000
2022

- 6,09473.8%White alone
- 1,07113.0%Hispanic
- 88810.7%Black alone
- 1151.4%Two or more races
- 650.8%Asian alone
- 140.2%American Indian alone
- 100.1%Other race alone
- 50.06%Native Hawaiian and Other
Pacific Islander alone
-
- 3,70744.5%White alone
- 2,04224.5%Hispanic
- 1,70820.5%Black alone
- 4004.8%Asian alone
- 3564.3%Two or more races
- 2062.5%Other race alone
- 220.3%Native Hawaiian and Other
Pacific Islander alone - 40.05%American Indian alone
2000
2022
-
- 567,97372.5%White alone
- 148,43518.9%Black alone
- 37,2774.8%Hispanic
- 16,1102.1%Asian alone
- 10,2221.3%Two or more races
- 2,3240.3%American Indian alone
- 1,0250.1%Other race alone
- 2340.03%Native Hawaiian and Other
Pacific Islander alone

-
- 599,34758.9%White alone
- 220,01021.6%Black alone
- 105,30010.3%Hispanic
- 46,0164.5%Two or more races
- 41,3504.1%Asian alone
- 5,0970.5%Other race alone
- 1,2760.1%American Indian alone

Income and house value in Wilmington Manor
- Median household income in 2022
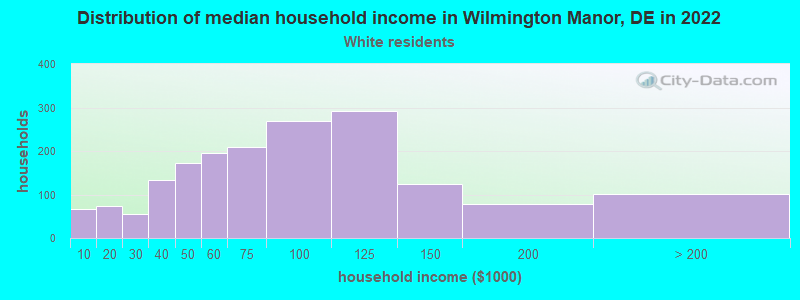
- $67,823White non-Hispanic householders
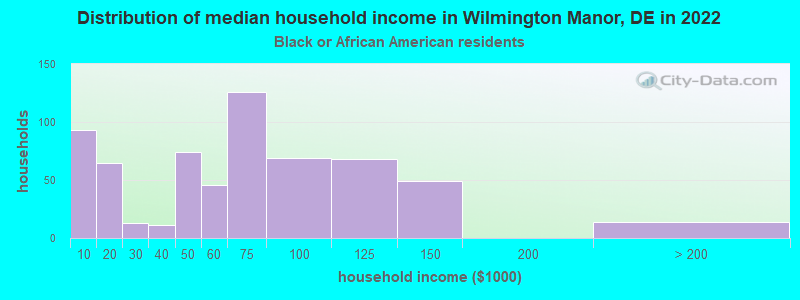
- $63,935Black householders
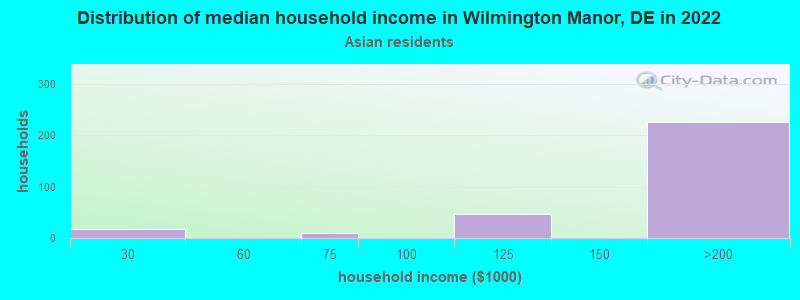
- $140,459Asian householders
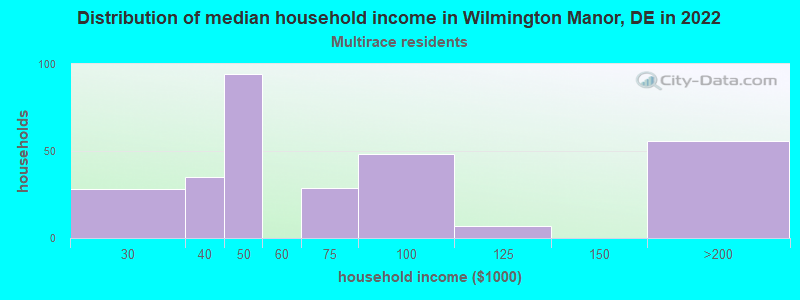
- $47,504Two or more races householders
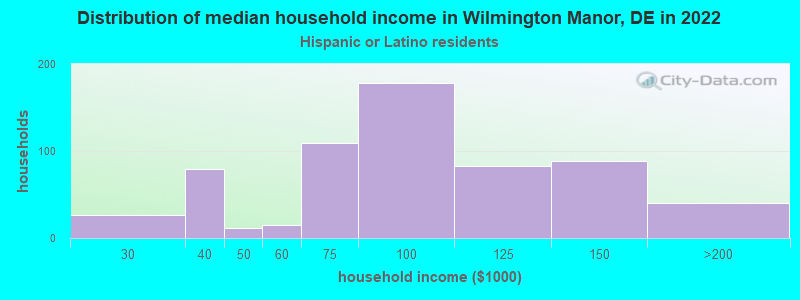
- $89,459Hispanic or Latino race householders
- Median 2022 house value
- $210,088White Non-Hispanic householders
- $254,180Black or African American householders
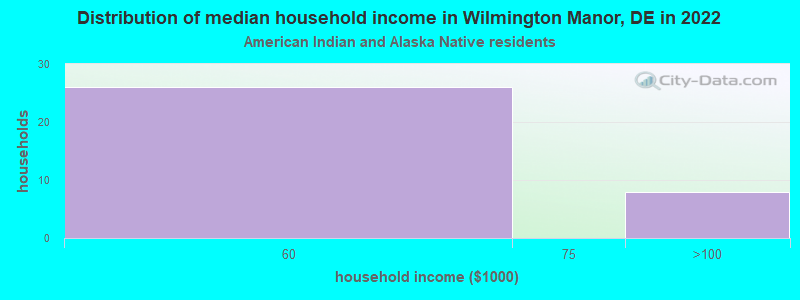
- $243,157American Indian or Alaska Native householders
- $205,333Asian householders
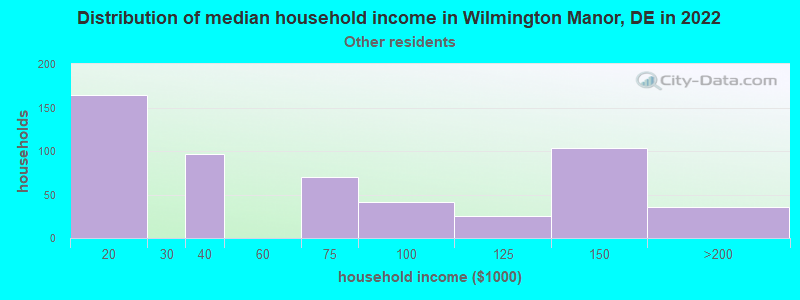
- $195,606Some other race householders
- $196,903Two or more races householders
- $189,122Hispanic or Latino householders
Household income for White non-Hispanic householders
Household income for Black householders
Household income for American Indian and Alaska Native householders
Household income for Asian householders
Household income for Some other race householders
Household income for Two or more races householders
Household income for Hispanic or Latino race householders
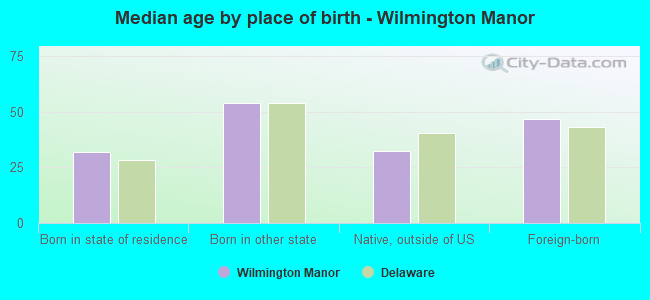
Median age by race in Wilmington Manor
- 41.3Median age for White residents
- 41.1Males
- 41.8Females
- 40.7Median age for Black or African American residents
- 40.6Males
- 40.2Females
- 39.9Median age for American Indian / Alaska Native residents
- 56.9Males
- -659,673,659.0Females
- 71.6Median age for Asian residents
- 70.3Males
- 61.6Females
- -666,666,666.0Median age for Native Hawaiian / Pacific Islander residents
- -668,724,279.2Males
- -670,599,802.7Females
- 27.2Median age for Other race residents
- 38.1Males
- 22.0Females
- 19.9Median age for Two or more races residents
- 13.8Males
- 24.5Females
- 44.8Median age for White alone residents
- 42.7Males
- 47.7Females
- 28.6Median age for Hispanic or Latino residents
- 32.3Males
- 20.8Females
Owner/renter occupied households by race in Wilmington Manor
- House owners and renters - White residents
- 1,63089.8%Owner occupied
- 18510.2%Renter occupied
- House owners and renters - Black or African American residents
- 34553.1%Owner occupied
- 30546.9%Renter occupied
- House owners and renters - American Indian / Alaska Native residents
- 62100.0%Owner occupied
- House owners and renters - Asian residents
- 34292.2%Owner occupied
- 297.8%Renter occupied
- House owners and renters - Native Hawaiian / Pacific Islander residents
- 10100.0%Owner occupied
- House owners and renters - Other race residents
- 41379.3%Owner occupied
- 10820.7%Renter occupied
- House owners and renters - Two or more races residents
- 12337.5%Owner occupied
- 20562.5%Renter occupied
- House owners and renters - White alone residents
- 1,48790.9%Owner occupied
- 1489.1%Renter occupied
- House owners and renters - Hispanic or Latino residents
- 43768.6%Owner occupied
- 20031.4%Renter occupied
Language usage in Wilmington Manor
- English speakers - Total
- 79.3% of residents of Wilmington Manor speak English at home.
- 17.5% of residents speak Spanish at home
- 98872.0%Speak English very well
- 38528.0%Speak English less than very well
- 2.7% of residents speak other language at home
- 15071.4%Speak English very well
- 6028.6%Speak English less than very well
- English speakers - Born in the United States
- 93.0% of residents of Wilmington Manor speak English at home.
- 4.7% of residents speak Spanish at home
- 111100.0%Speak English very well
- 2.1% of residents speak other language at home
- 2854.9%Speak English very well
- 2345.1%Speak English less than very well
- English speakers - Native, born elsewhere
- 5.3% of residents of Wilmington Manor speak English at home.
- 87.6% of residents speak Spanish at home
- 26078.5%Speak English very well
- 7121.5%Speak English less than very well
- English speakers - Foreign-born
- 38.6% of residents of Wilmington Manor speak English at home.
- 46.6% of residents speak Spanish at home
- 25648.7%Speak English very well
- 27051.3%Speak English less than very well
- 13.8% of residents speak other language at home
- 11674.4%Speak English very well
- 4025.6%Speak English less than very well
White (Caucasian) - Speak only English
| Native: | 97.4% (3,670) |
| Foreign-born: | 6.7% (11) |
White (Caucasian) - Speak another language
| Native: | 2.3% (88) |
| Foreign-born: | 81.1% (137) |
Black or African American - Speak only English
| Native: | 98.0% (1,533) |
| Foreign-born: | 15.5% (20) |
Black or African American - Speak another language
| Native: | 2.0% (31) |
| Foreign-born: | 96.3% (125) |
American Indian / Alaska Native - Speak another language
| Native: | 78.2% (20) |
| Foreign-born: | 100.0% (57) |
Other race - Speak another language
| Native: | 71.3% (647) |
| Foreign-born: | 91.5% (260) |
Two or more races - Speak another language
| Native: | 27.5% (165) |
| Foreign-born: | 98.6% (77) |
White alone - Speak only English
| Native: | 99.6% (3,504) |
| Foreign-born: | 47.6% (12) |
White alone - Speak another language
| Native: | 0.7% (24) |
| Foreign-born: | 52.8% (14) |
Hispanic or Latino - Speak another language
| Native: | 60.8% (879) |
| Foreign-born: | 94.0% (529) |
Foreign-born residents in Wilmington Manor
1,113 residents are foreign born (11.1% Latin America).
| This city: | 13.4% |
| Delaware: | 9.8% |
Marital status for residents in Wilmington Manor
Marital status - White (Caucasian) population 15 years and over
- Males
- 37.3%Never married
- 49.2%Now married
- 0.7%Separated
- 1.8%Widowed
- 11.0%Divorced
- Females
- 29.2%Never married
- 38.4%Now married
- 3.1%Separated
- 10.4%Widowed
- 18.9%Divorced
Women who gave birth in the past 12 months
| Now married: | 74.2% (21) |
| Unmarried: | 25.8% (7) |
Women who did not give birth in the past 12 months
| Now married: | 43.0% (413) |
| Unmarried: | 57.0% (548) |
Marital status - Black or African American population 15 years and over
- Males
- 34.3%Never married
- 49.1%Now married
- 3.1%Separated
- 0.0%Widowed
- 13.5%Divorced
- Females
- 38.8%Never married
- 36.8%Now married
- 1.5%Separated
- 6.6%Widowed
- 16.3%Divorced
Women who did not give birth in the past 12 months
| Now married: | 39.5% (188) |
| Unmarried: | 60.5% (288) |
Marital status - American Indian / Alaska Native population 15 years and over
- Males
- 0.0%Never married
- 100.0%Now married
- 0.0%Separated
- 0.0%Widowed
- 0.0%Divorced
- Females
- 0.0%Never married
- 100.0%Now married
- 0.0%Separated
- 0.0%Widowed
- 0.0%Divorced
Women who did not give birth in the past 12 months
| Now married: | 100.0% (18) |
| Unmarried: | 0.0% (0) |
Marital status - Asian population 15 years and over
- Males
- 0.0%Never married
- 4.2%Now married
- 0.0%Separated
- 0.0%Widowed
- 95.8%Divorced
- Females
- 55.9%Never married
- 28.8%Now married
- 0.0%Separated
- 15.3%Widowed
- 0.0%Divorced
Women who gave birth in the past 12 months
| Now married: | 100.0% (9) |
| Unmarried: | 0.0% (0) |
Women who did not give birth in the past 12 months
| Now married: | 100.0% (8) |
| Unmarried: | 0.0% (0) |
Marital status - Native Hawaiian / Pacific Islander population 15 years and over
- Males
- 100.0%Never married
- 0.0%Now married
- 0.0%Separated
- 0.0%Widowed
- 0.0%Divorced
- Females
- 0.0%Never married
- 100.0%Now married
- 0.0%Separated
- 0.0%Widowed
- 0.0%Divorced
Marital status - Other race population 15 years and over
- Males
- 28.7%Never married
- 52.2%Now married
- 0.0%Separated
- 0.0%Widowed
- 19.1%Divorced
- Females
- 55.0%Never married
- 45.0%Now married
- 0.0%Separated
- 0.0%Widowed
- 0.0%Divorced
Women who did not give birth in the past 12 months
| Now married: | 62.7% (253) |
| Unmarried: | 37.3% (151) |
Marital status - Two or more races population 15 years and over
- Males
- 69.7%Never married
- 23.9%Now married
- 0.0%Separated
- 6.3%Widowed
- 0.0%Divorced
- Females
- 53.5%Never married
- 42.2%Now married
- 0.0%Separated
- 0.0%Widowed
- 4.3%Divorced
Women who gave birth in the past 12 months
| Now married: | 15.2% (7) |
| Unmarried: | 84.8% (38) |
Women who did not give birth in the past 12 months
| Now married: | 25.3% (28) |
| Unmarried: | 74.7% (84) |
Marital status - White alone, not Hispanic / Latino population 15 years and over
- Males
- 35.7%Never married
- 50.1%Now married
- 0.8%Separated
- 2.2%Widowed
- 11.2%Divorced
- Females
- 23.9%Never married
- 39.5%Now married
- 3.5%Separated
- 11.7%Widowed
- 21.4%Divorced
Women who gave birth in the past 12 months
| Now married: | 74.2% (22) |
| Unmarried: | 25.8% (8) |
Women who did not give birth in the past 12 months
| Now married: | 46.7% (370) |
| Unmarried: | 53.3% (422) |
Marital status - Hispanic or Latino population 15 years and over
- Males
- 38.8%Never married
- 49.7%Now married
- 0.0%Separated
- 0.0%Widowed
- 11.5%Divorced
- Females
- 47.0%Never married
- 53.0%Now married
- 0.0%Separated
- 0.0%Widowed
- 0.0%Divorced
Women who did not give birth in the past 12 months
| Now married: | 49.5% (320) |
| Unmarried: | 50.5% (326) |
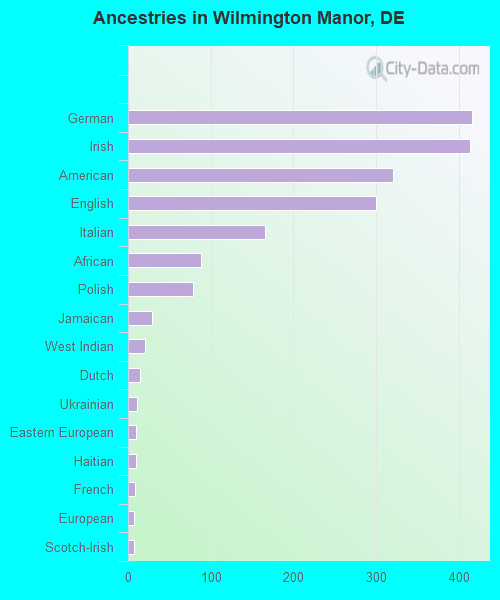
Ancestries in Wilmington Manor

- 41610.6%German
- 41410.6%Irish
- 3218.2%American
- 3007.7%English
- 1664.2%Italian
- 882.3%African
- 792.0%Polish
- 290.7%Jamaican
- 200.5%West Indian
- 150.4%Dutch
- 110.3%Ukrainian
- 100.3%Eastern European
- 100.3%Haitian
- 90.2%French
- 70.2%European
- 70.2%Scotch-Irish
- 10.03%Trinidadian and Tobagonian
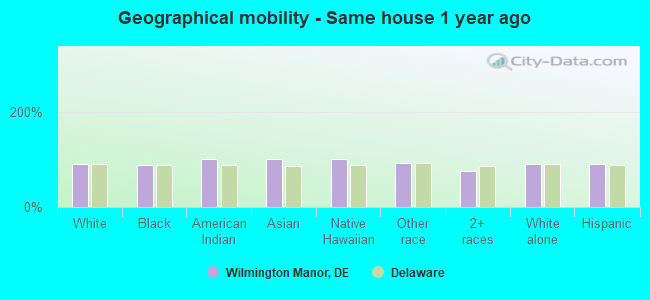
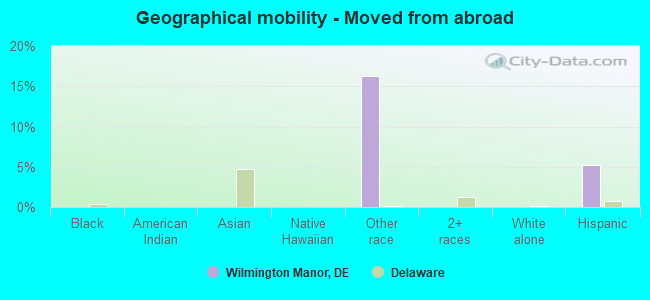
Geographical mobility in Wilmington Manor

- Same house 1 year ago
- 3,71190.9%White (Caucasian)
- 1,58087.8%Black or African American
- 69100.0%American Indian / Alaska Native
- 406100.0%Asian
- 24100.0%Native Hawaiian / Pacific Islander
- 1,13092.6%Other race
- 65976.0%Two or more races
- 3,31990.3%White alone, not Hispanic / Latino
- 1,84390.2%Hispanic or Latino
-
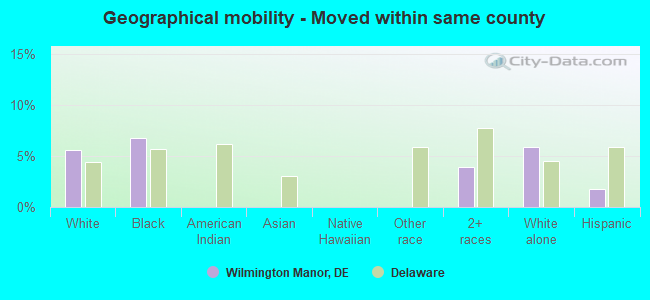
- Moved within same county
- 2275.6%White / Caucasian
- 1216.7%Black or African American
- 344.0%Two or more races
- 2175.9%White alone, not Hispanic / Latino
- 371.8%Hispanic or Latino
-
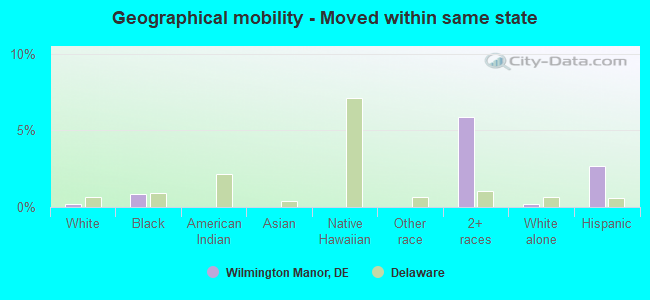
- Moved within same state
- 90.2%White / Caucasian
- 160.9%Black or African American
- 515.9%Two or more races
- 80.2%White alone, not Hispanic / Latino
- 552.7%Hispanic or Latino
-
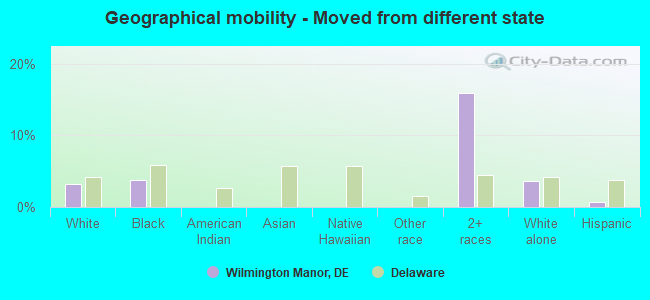
- Moved from different state
- 1313.2%White / Caucasian
- 683.8%Black or African American
- 13816.0%Two or more races
- 1343.6%White alone, not Hispanic / Latino
- 140.7%Hispanic or Latino
-
- Moved from abroad
- 19816.2%Other race
- 1055.2%Hispanic or Latino
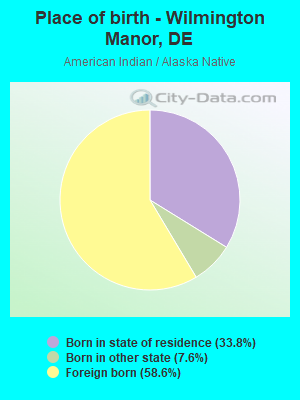
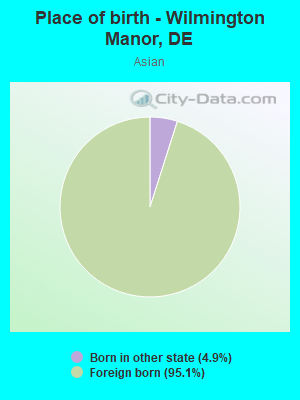
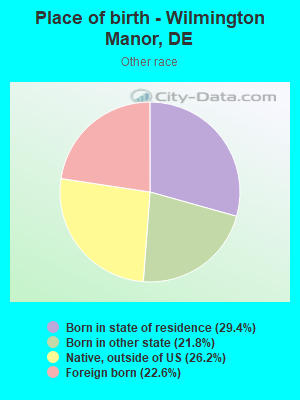
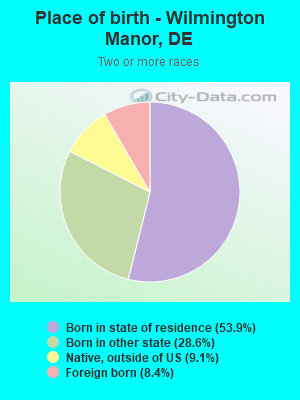
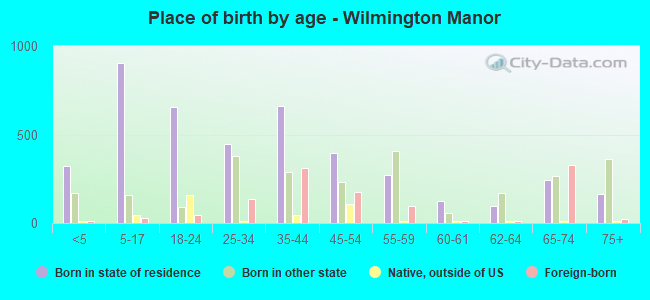
Children Nativity (place of birth) in Wilmington Manor
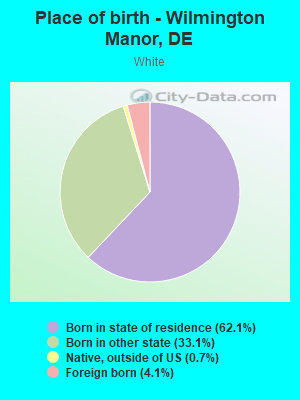
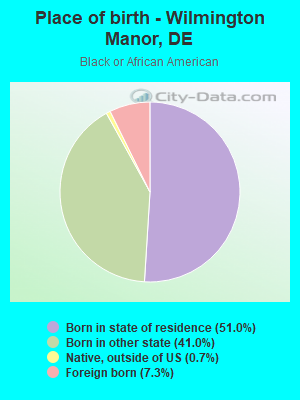
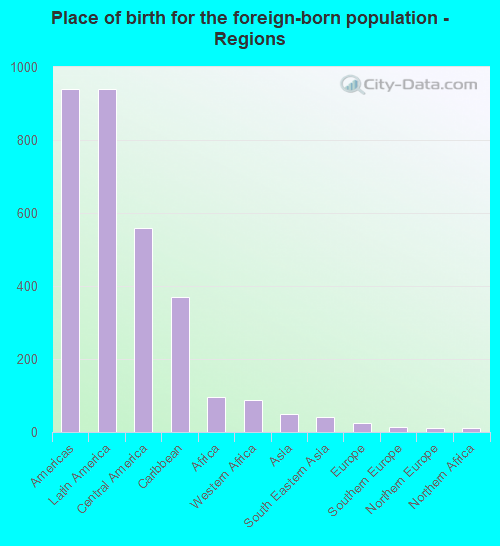
Place of birth for residents in Wilmington Manor
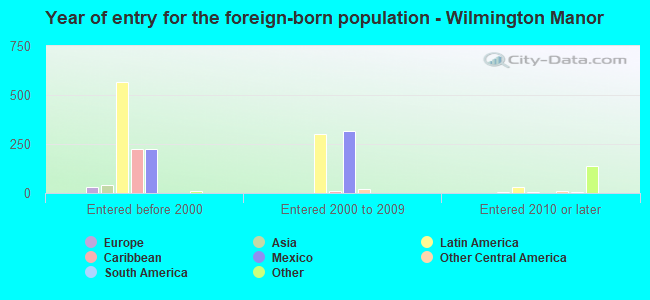
![Place of birth for the foreign-born population - Regions]()
- 939Americas
- 939Latin America
- 559Central America
- 371Caribbean
- 97Africa
- 87Western Africa
- 49Asia
- 41South Eastern Asia
- 26Europe
- 14Southern Europe
- 12Northern Europe
- 10Northern Africa
- 8Eastern Asia
- 8South America
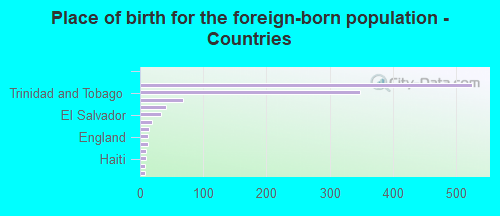
![Place of birth for the foreign-born population - Countries]()
- 526Mexico
- 348Trinidad and Tobago
- 68Nigeria
- 41Philippines
- 33El Salvador
- 19Ghana
- 14Italy
- 12England
- 12Jamaica
- 10Morocco
- 10Haiti
- 8Korea
- 8Colombia
Grandparents responsible for own grandchildren in Wilmington Manor
Zip codes: 19720.