Races in Willamina, Oregon (OR) Detailed Stats
Data:
Races - White alone (%)
Races - White alone (% change since 2000)
Races - Black alone (%)
Races - Black alone (% change since 2000)
Races - American Indian alone (%)
Races - American Indian alone (% change since 2000)
Races - Asian alone (%)
Races - Asian alone (% change since 2000)
Races - Hispanic (%)
Races - Hispanic (% change since 2000)
Races - Native Hawaiian and Other Pacific Islander alone (%)
Races - Native Hawaiian and Other Pacific Islander alone (% change since 2000)
Races - Two or more races(%)
Races - Two or more races(% change since 2000)
Races - Other race alone (%)
Races - Other race alone (% change since 2000)
Racial diversity
Place of birth - Born in state of residence (%)
Place of birth - Born in state of residence (%) - White
Place of birth - Born in state of residence (%) - Black or African American
Place of birth - Born in state of residence (%) - Asian
Place of birth - Born in state of residence (%) - Hispanic or Latino
Place of birth - Born in state of residence (%) - American Indian and Alaska Native
Place of birth - Born in state of residence (%) - Multirace
Place of birth - Born in state of residence (%) - Other Race
Place of birth - Born in other state (%)
Place of birth - Born in other state (%) - White
Place of birth - Born in other state (%) - Black or African American
Place of birth - Born in other state (%) - Asian
Place of birth - Born in other state (%) - Hispanic or Latino
Place of birth - Born in other state (%) - American Indian and Alaska Native
Place of birth - Born in other state (%) - Multirace
Place of birth - Born in other state (%) - Other Race
Place of birth - Native, outside of US (%)
Place of birth - Native, outside of US (%) - White
Place of birth - Native, outside of US (%) - Black or African American
Place of birth - Native, outside of US (%) - Asian
Place of birth - Native, outside of US (%) - Hispanic or Latino
Place of birth - Native, outside of US (%) - American Indian and Alaska Native
Place of birth - Native, outside of US (%) - Multirace
Place of birth - Native, outside of US (%) - Other Race
Place of birth - Foreign born (%)
Place of birth - Foreign born (%) - White
Place of birth - Foreign born (%) - Black or African American
Place of birth - Foreign born (%) - Asian
Place of birth - Foreign born (%) - Hispanic or Latino
Place of birth - Foreign born (%) - American Indian and Alaska Native
Place of birth - Foreign born (%) - Multirace
Place of birth - Foreign born (%) - Other Race
Residents speaking English at home (%)
Residents speaking English at home - Born in the United States (%)
Residents speaking English at home - Native, born elsewhere (%)
Residents speaking English at home - Foreign born (%)
Residents speaking Spanish at home (%)
Residents speaking Spanish at home - Born in the United States (%)
Residents speaking Spanish at home - Native, born elsewhere (%)
Residents speaking Spanish at home - Foreign born (%)
Residents speaking other language at home (%)
Residents speaking other language at home - Born in the United States (%)
Residents speaking other language at home - Native, born elsewhere (%)
Residents speaking other language at home - Foreign born (%)
Marital status - Never married (%)
Marital status - Now married (%)
Marital status - Separated (%)
Marital status - Widowed (%)
Marital status - Divorced (%)
Ancestries Reported - Arab (%)
Ancestries Reported - Czech (%)
Ancestries Reported - Danish (%)
Ancestries Reported - Dutch (%)
Ancestries Reported - English (%)
Ancestries Reported - French (%)
Ancestries Reported - French Canadian (%)
Ancestries Reported - German (%)
Ancestries Reported - Greek (%)
Ancestries Reported - Hungarian (%)
Ancestries Reported - Irish (%)
Ancestries Reported - Italian (%)
Ancestries Reported - Lithuanian (%)
Ancestries Reported - Norwegian (%)
Ancestries Reported - Polish (%)
Ancestries Reported - Portuguese (%)
Ancestries Reported - Russian (%)
Ancestries Reported - Scotch-Irish (%)
Ancestries Reported - Scottish (%)
Ancestries Reported - Slovak (%)
Ancestries Reported - Subsaharan African (%)
Ancestries Reported - Swedish (%)
Ancestries Reported - Swiss (%)
Ancestries Reported - Ukrainian (%)
Ancestries Reported - United States (%)
Ancestries Reported - Welsh (%)
Ancestries Reported - West Indian (%)
Ancestries Reported - Other (%)
Geographical mobility - Same house 1 year ago (%)
Geographical mobility - Same house 1 year ago (%) - White
Geographical mobility - Same house 1 year ago (%) - Black or African American
Geographical mobility - Same house 1 year ago (%) - Asian
Geographical mobility - Same house 1 year ago (%) - Hispanic or Latino
Geographical mobility - Same house 1 year ago (%) - American Indian and Alaska Native
Geographical mobility - Same house 1 year ago (%) - Multirace
Geographical mobility - Same house 1 year ago (%) - Other Race
Geographical mobility - Moved within same county (%)
Geographical mobility - Moved within same county (%) - White
Geographical mobility - Moved within same county (%) - Black or African American
Geographical mobility - Moved within same county (%) - Asian
Geographical mobility - Moved within same county (%) - Hispanic or Latino
Geographical mobility - Moved within same county (%) - American Indian and Alaska Native
Geographical mobility - Moved within same county (%) - Multirace
Geographical mobility - Moved within same county (%) - Other Race
Geographical mobility - Moved from different county within same state (%)
Geographical mobility - Moved from different county within same state (%) - White
Geographical mobility - Moved from different county within same state (%) - Black or African American
Geographical mobility - Moved from different county within same state (%) - Asian
Geographical mobility - Moved from different county within same state (%) - Hispanic or Latino
Geographical mobility - Moved from different county within same state (%) - American Indian and Alaska Native
Geographical mobility - Moved from different county within same state (%) - Multirace
Geographical mobility - Moved from different county within same state (%) - Other Race
Geographical mobility - Moved from different state (%)
Geographical mobility - Moved from different state (%) - White
Geographical mobility - Moved from different state (%) - Black or African American
Geographical mobility - Moved from different state (%) - Asian
Geographical mobility - Moved from different state (%) - Hispanic or Latino
Geographical mobility - Moved from different state (%) - American Indian and Alaska Native
Geographical mobility - Moved from different state (%) - Multirace
Geographical mobility - Moved from different state (%) - Other Race
Geographical mobility - Moved from abroad (%)
Geographical mobility - Moved from abroad (%) - White
Geographical mobility - Moved from abroad (%) - Black or African American
Geographical mobility - Moved from abroad (%) - Asian
Geographical mobility - Moved from abroad (%) - Hispanic or Latino
Geographical mobility - Moved from abroad (%) - American Indian and Alaska Native
Geographical mobility - Moved from abroad (%) - Multirace
Geographical mobility - Moved from abroad (%) - Other Race
Place of birth for the foreign-born population - Ireland (%)
Place of birth for the foreign-born population - Denmark (%)
Place of birth for the foreign-born population - Norway (%)
Place of birth for the foreign-born population - Sweden (%)
Place of birth for the foreign-born population - United Kingdom (%)
Place of birth for the foreign-born population - England (%)
Place of birth for the foreign-born population - Scotland (%)
Place of birth for the foreign-born population - Other Northern Europe (%)
Place of birth for the foreign-born population - Austria (%)
Place of birth for the foreign-born population - Belgium (%)
Place of birth for the foreign-born population - France (%)
Place of birth for the foreign-born population - Germany (%)
Place of birth for the foreign-born population - Netherlands (%)
Place of birth for the foreign-born population - Switzerland (%)
Place of birth for the foreign-born population - Other Western Europe (%)
Place of birth for the foreign-born population - Greece (%)
Place of birth for the foreign-born population - Italy (%)
Place of birth for the foreign-born population - Portugal (%)
Place of birth for the foreign-born population - Spain (%)
Place of birth for the foreign-born population - Other Southern Europe (%)
Place of birth for the foreign-born population - Albania (%)
Place of birth for the foreign-born population - Belarus (%)
Place of birth for the foreign-born population - Bosnia and Herzegovina (%)
Place of birth for the foreign-born population - Bulgaria (%)
Place of birth for the foreign-born population - Croatia (%)
Place of birth for the foreign-born population - Czechoslovakia (%)
Place of birth for the foreign-born population - Hungary (%)
Place of birth for the foreign-born population - Latvia (%)
Place of birth for the foreign-born population - Lithuania (%)
Place of birth for the foreign-born population - North Macedonia (Macedonia) (%)
Place of birth for the foreign-born population - Moldova (%)
Place of birth for the foreign-born population - Poland (%)
Place of birth for the foreign-born population - Romania (%)
Place of birth for the foreign-born population - Russia (%)
Place of birth for the foreign-born population - Serbia (%)
Place of birth for the foreign-born population - Ukraine (%)
Place of birth for the foreign-born population - Other Eastern Europe (%)
Place of birth for the foreign-born population - China (%)
Place of birth for the foreign-born population - Hong Kong (%)
Place of birth for the foreign-born population - Taiwan (%)
Place of birth for the foreign-born population - Japan (%)
Place of birth for the foreign-born population - Korea (%)
Place of birth for the foreign-born population - Other Eastern Asia (%)
Place of birth for the foreign-born population - Afghanistan (%)
Place of birth for the foreign-born population - Bangladesh (%)
Place of birth for the foreign-born population - India (%)
Place of birth for the foreign-born population - Iran (%)
Place of birth for the foreign-born population - Kazakhstan (%)
Place of birth for the foreign-born population - Nepal (%)
Place of birth for the foreign-born population - Pakistan (%)
Place of birth for the foreign-born population - Sri Lanka (%)
Place of birth for the foreign-born population - Uzbekistan (%)
Place of birth for the foreign-born population - Other South Central Asia (%)
Place of birth for the foreign-born population - Burma (%)
Place of birth for the foreign-born population - Cambodia (%)
Place of birth for the foreign-born population - Indonesia (%)
Place of birth for the foreign-born population - Laos (%)
Place of birth for the foreign-born population - Malaysia (%)
Place of birth for the foreign-born population - Philippines (%)
Place of birth for the foreign-born population - Singapore (%)
Place of birth for the foreign-born population - Thailand (%)
Place of birth for the foreign-born population - Vietnam (%)
Place of birth for the foreign-born population - Other South Eastern Asia (%)
Place of birth for the foreign-born population - Armenia (%)
Place of birth for the foreign-born population - Iraq (%)
Place of birth for the foreign-born population - Israel (%)
Place of birth for the foreign-born population - Jordan (%)
Place of birth for the foreign-born population - Kuwait (%)
Place of birth for the foreign-born population - Lebanon (%)
Place of birth for the foreign-born population - Saudi Arabia (%)
Place of birth for the foreign-born population - Syria (%)
Place of birth for the foreign-born population - Turkey (%)
Place of birth for the foreign-born population - Yemen (%)
Place of birth for the foreign-born population - Other Western Asia (%)
Place of birth for the foreign-born population - Eritrea (%)
Place of birth for the foreign-born population - Ethiopia (%)
Place of birth for the foreign-born population - Kenya (%)
Place of birth for the foreign-born population - Somalia (%)
Place of birth for the foreign-born population - Uganda (%)
Place of birth for the foreign-born population - Zimbabwe (%)
Place of birth for the foreign-born population - Other Eastern Africa (%)
Place of birth for the foreign-born population - Cameroon (%)
Place of birth for the foreign-born population - Congo (%)
Place of birth for the foreign-born population - Democratic Republic of Congo (Zaire) (%)
Place of birth for the foreign-born population - Other Middle Africa (%)
Place of birth for the foreign-born population - Egypt (%)
Place of birth for the foreign-born population - Morocco (%)
Place of birth for the foreign-born population - Sudan (%)
Place of birth for the foreign-born population - Other Northern Africa (%)
Place of birth for the foreign-born population - South Africa (%)
Place of birth for the foreign-born population - Other Southern Africa (%)
Place of birth for the foreign-born population - Cabo Verde (%)
Place of birth for the foreign-born population - Ghana (%)
Place of birth for the foreign-born population - Liberia (%)
Place of birth for the foreign-born population - Nigeria (%)
Place of birth for the foreign-born population - Senegal (%)
Place of birth for the foreign-born population - Sierra Leone (%)
Place of birth for the foreign-born population - Other Western Africa (%)
Place of birth for the foreign-born population - Australia (%)
Place of birth for the foreign-born population - New Zealand (%)
Place of birth for the foreign-born population - Fiji (%)
Place of birth for the foreign-born population - Micronesia (%)
Place of birth for the foreign-born population - Bahamas (%)
Place of birth for the foreign-born population - Barbados (%)
Place of birth for the foreign-born population - Cuba (%)
Place of birth for the foreign-born population - Dominica (%)
Place of birth for the foreign-born population - Dominican Republic (%)
Place of birth for the foreign-born population - Grenada (%)
Place of birth for the foreign-born population - Haiti (%)
Place of birth for the foreign-born population - Jamaica (%)
Place of birth for the foreign-born population - St. Vincent and the Grenadines (%)
Place of birth for the foreign-born population - Trinidad and Tobago (%)
Place of birth for the foreign-born population - West Indies (%)
Place of birth for the foreign-born population - Other Caribbean (%)
Place of birth for the foreign-born population - Belize (%)
Place of birth for the foreign-born population - Costa Rica (%)
Place of birth for the foreign-born population - El Salvador (%)
Place of birth for the foreign-born population - Guatemala (%)
Place of birth for the foreign-born population - Honduras (%)
Place of birth for the foreign-born population - Mexico (%)
Place of birth for the foreign-born population - Nicaragua (%)
Place of birth for the foreign-born population - Panama (%)
Place of birth for the foreign-born population - Other Central America (%)
Place of birth for the foreign-born population - Argentina (%)
Place of birth for the foreign-born population - Bolivia (%)
Place of birth for the foreign-born population - Brazil (%)
Place of birth for the foreign-born population - Chile (%)
Place of birth for the foreign-born population - Colombia (%)
Place of birth for the foreign-born population - Ecuador (%)
Place of birth for the foreign-born population - Guyana (%)
Place of birth for the foreign-born population - Peru (%)
Place of birth for the foreign-born population - Uruguay (%)
Place of birth for the foreign-born population - Venezuela (%)
Place of birth for the foreign-born population - Other South America (%)
Place of birth for the foreign-born population - Canada (%)
Place of birth for the foreign-born population - Other Northern America (%)
Place of birth for the foreign-born population - Other (%)
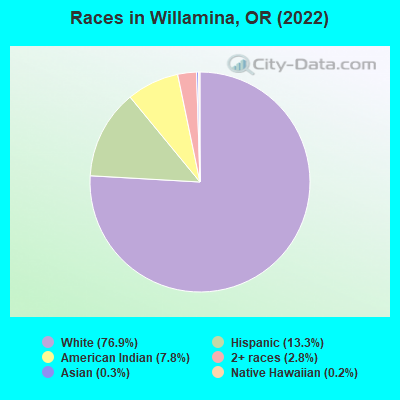
According to 2022 data, the most numerous races in Willamina, OR are White alone (1,767 residents), Hispanic (305 residents), and Two or more races (65 residents). 97.3% of Willamina residents speak English at home. 1.1% of Willamina, OR residents are foreign-born , which is 695.8% less than the foreign-born rate of 9.0% across the entire state of Oregon.
Race distribution in Willamina
2000 2022
2,857,616 83.5% White alone 275,314 8.0% Hispanic 100,333 2.9% Asian alone 82,733 2.4% Two or more races 53,325 1.6% Black alone 40,130 1.2% American Indian alone 7,398 0.2% Native Hawaiian and Other 4,550 0.1% Other race alone
3,037,571 71.6% White alone 609,538 14.4% Hispanic 252,744 6.0% Two or more races 191,283 4.5% Asian alone 78,228 1.8% Black alone 29,399 0.7% American Indian alone 25,731 0.6% Other race alone 15,643 0.4% Native Hawaiian and Other
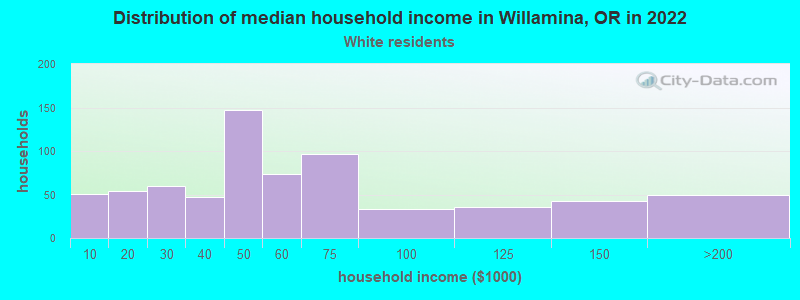
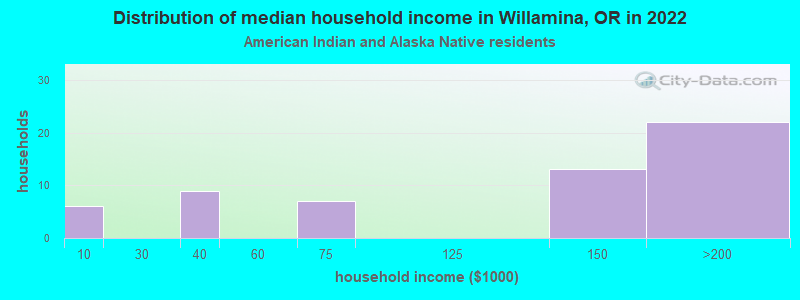
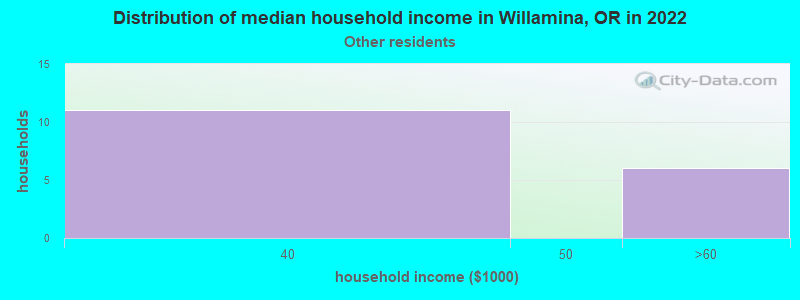
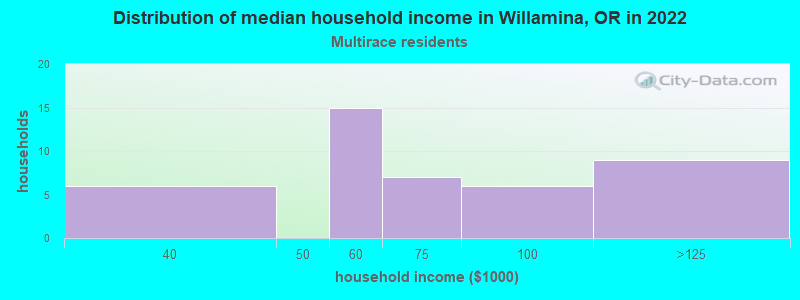
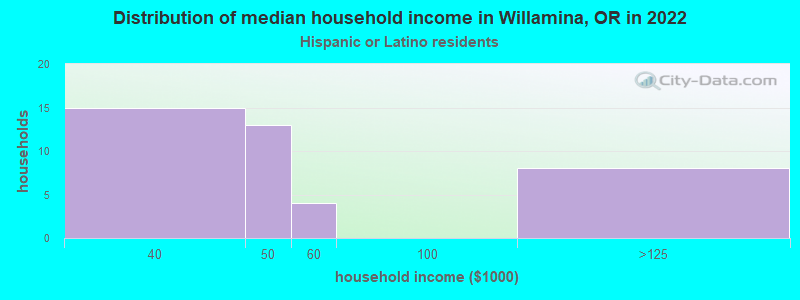
Income and house value in Willamina Median household income in 2022 $51,750 White non-Hispanic householders$98,943 American Indian and Alaska Native householders$62,150 Two or more races householders$34,569 Hispanic or Latino race householdersMedian 2022 house value $255,612 White Non-Hispanic householders$287,564 American Indian or Alaska Native householders $276,999 Asian householders$289,883 Some other race householders$264,115 Two or more races householders$273,907 Hispanic or Latino householders
Median age by race in Willamina
38.9 Median age for White residents34.9 48.6 -644,257,702.4 Median age for Black or African American residents-594,315,244.9 -625,514,402.7 61.2 Median age for American Indian / Alaska Native residents37.2 79.0 -666,666,666.0 Median age for Asian residents-737,931,033.7 -708,994,708.3 -764,705,881.6 Median age for Native Hawaiian / Pacific Islander residents-764,119,600.6 -774,891,774.1 44.4 Median age for Other race residents38.1 61.7 13.5 Median age for Two or more races residents13.8 12.5 40.6 Median age for White alone residents35.9 47.2 14.3 Median age for Hispanic or Latino residents14.2 15.2
Owner/renter occupied households by race in Willamina
House owners and renters - White residents 350 50.1% Owner occupied349 49.9% Renter occupiedHouse owners and renters - American Indian / Alaska Native residents 35 55.0% Owner occupied29 45.0% Renter occupiedHouse owners and renters - Other race residents 3 34.6% Owner occupied6 65.4% Renter occupiedHouse owners and renters - Two or more races residents 16 41.2% Owner occupied23 58.8% Renter occupiedHouse owners and renters - White alone residents 359 50.2% Owner occupied356 49.8% Renter occupiedHouse owners and renters - Hispanic or Latino residents 8 24.8% Owner occupied25 75.2% Renter occupied
Language usage in Willamina
English speakers - Total 97.3% of residents of Willamina speak English at home.
1.7% of residents speak Spanish at home 15 41.7% Speak English very well21 58.3% Speak English less than very well1.0% of residents speak other language at home 22 100.0% Speak English very well
English speakers - Born in the United States 98.7% of residents of Willamina speak English at home.
1.5% of residents speak Spanish at home 6 50.0% Speak English very well6 50.0% Speak English less than very well
All residents speak only English at home
English speakers - Foreign-born 39.3% of residents of Willamina speak English at home.
7.1% of residents speak Spanish at home 2 100.0% Speak English less than very well32.1% of residents speak other language at home 9 100.0% Speak English very well
White (Caucasian) - Speak only English Native:
98.9% (1,735)Foreign-born:
83.2% (9)
White (Caucasian) - Speak another language Native:
1.3% (22)Foreign-born:
29.0% (3)
Other race - Speak another language Native:
34.1% (9)Foreign-born:
100.0% (2)
White alone - Speak only English Native:
97.7% (1,649)Foreign-born:
62.9% (9)
White alone - Speak another language Native:
2.2% (37)Foreign-born:
37.0% (6)
Hispanic or Latino - Speak another language Native:
4.8% (12)Foreign-born:
100.0% (2)
Foreign-born residents in Willamina 26 residents are foreign born
This city:
1.1%Oregon:
9.8%
Marital status for residents in Willamina Marital status - White (Caucasian) population 15 years and over
Males 39.2% Never married45.1% Now married2.6% Separated3.2% Widowed9.9% DivorcedFemales 24.6% Never married47.9% Now married0.0% Separated3.2% Widowed24.3% DivorcedWomen who gave birth in the past 12 months Now married:
100.0% (19)Unmarried:
0.0% (0)
Women who did not give birth in the past 12 months Now married:
40.1% (134)Unmarried:
59.9% (200)
Marital status - American Indian / Alaska Native population 15 years and over
Males 49.1% Never married47.4% Now married3.5% Separated0.0% Widowed0.0% DivorcedFemales 7.0% Never married21.1% Now married0.0% Separated56.1% Widowed15.8% DivorcedWomen who did not give birth in the past 12 months Now married:
22.2% (2)Unmarried:
77.8% (8)
Marital status - Other race population 15 years and over
Males 8.3% Never married91.7% Now married0.0% Separated0.0% Widowed0.0% DivorcedFemales 0.0% Never married93.8% Now married0.0% Separated6.2% Widowed0.0% DivorcedWomen who did not give birth in the past 12 months Now married:
100.0% (11)Unmarried:
0.0% (0)
Marital status - Two or more races population 15 years and over
Males 81.5% Never married0.0% Now married0.0% Separated0.0% Widowed18.5% DivorcedFemales 13.3% Never married58.3% Now married0.0% Separated0.0% Widowed28.3% DivorcedWomen who gave birth in the past 12 months Now married:
100.0% (4)Unmarried:
0.0% (0)
Women who did not give birth in the past 12 months Now married:
60.4% (40)Unmarried:
39.6% (26)
Marital status - White alone, not Hispanic / Latino population 15 years and over
Males 39.2% Never married45.1% Now married2.6% Separated3.2% Widowed9.9% DivorcedFemales 25.1% Never married48.3% Now married0.0% Separated3.3% Widowed23.3% DivorcedWomen who gave birth in the past 12 months Now married:
100.0% (20)Unmarried:
0.0% (0)
Women who did not give birth in the past 12 months Now married:
39.4% (138)Unmarried:
60.6% (212)
Marital status - Hispanic or Latino population 15 years and over
Males 57.6% Never married42.4% Now married0.0% Separated0.0% Widowed0.0% DivorcedFemales 6.8% Never married58.9% Now married0.0% Separated1.4% Widowed32.9% DivorcedWomen who did not give birth in the past 12 months Now married:
66.7% (37)Unmarried:
33.3% (19)
Ancestries in Willamina
208 19.8% American120 11.4% German103 9.8% European101 9.6% English72 6.9% Irish28 2.7% Danish20 1.9% Scandinavian17 1.6% Italian16 1.5% Scottish10 1.0% Scotch-Irish9 0.9% Ukrainian8 0.8% French6 0.6% Northern European5 0.5% Czech5 0.5% Norwegian5 0.5% Swiss
Children Nativity (place of birth) in Willamina
Children under 6 years - Living with two parents Both parents native 86 100.0% NativeOne native, one foreign-born parent 5 100.0% NativeChildren under 6 years - Living with one parent Native parent 40 100.0% Native
Children 6 to 17 years - Living with two parents Both parents native 130 100.0% NativeOne native, one foreign-born parent 6 100.0% NativeChildren 6 to 17 years - Living with one parent Native parent 202 100.0% Native
Grandparents responsible for own grandchildren in Willamina
Grandparents (30 to 59 years) White / Caucasian 24 60.1% Responsible for grandchildren16 39.9% Not responsible for grandchildrenWhite alone, not Hispanic / Latino 25 57.7% Responsible for grandchildren18 42.3% Not responsible for grandchildrenGrandparents (60 years and over) White / Caucasian 4 33.9% Responsible for grandchildren7 66.1% Not responsible for grandchildrenWhite alone, not Hispanic / Latino 4 33.7% Responsible for grandchildren8 66.3% Not responsible for grandchildren