Races in Whitehall, Ohio (OH) Detailed Stats
Data:
Races - White alone (%)
Races - White alone (% change since 2000)
Races - Black alone (%)
Races - Black alone (% change since 2000)
Races - American Indian alone (%)
Races - American Indian alone (% change since 2000)
Races - Asian alone (%)
Races - Asian alone (% change since 2000)
Races - Hispanic (%)
Races - Hispanic (% change since 2000)
Races - Native Hawaiian and Other Pacific Islander alone (%)
Races - Native Hawaiian and Other Pacific Islander alone (% change since 2000)
Races - Two or more races(%)
Races - Two or more races(% change since 2000)
Races - Other race alone (%)
Races - Other race alone (% change since 2000)
Racial diversity
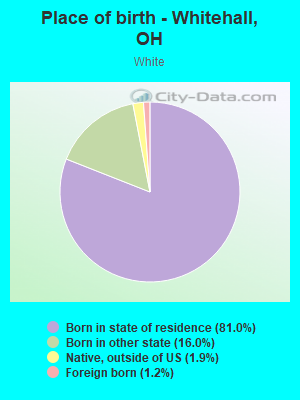
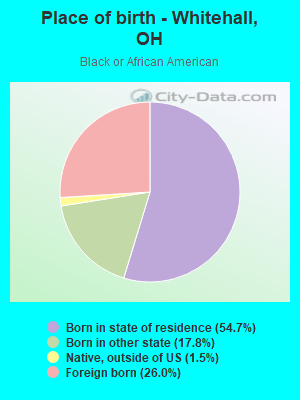
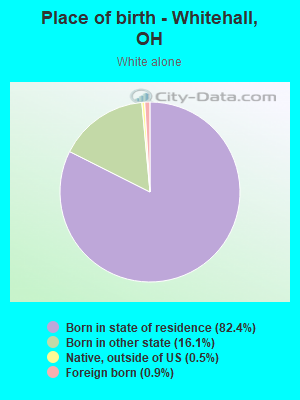
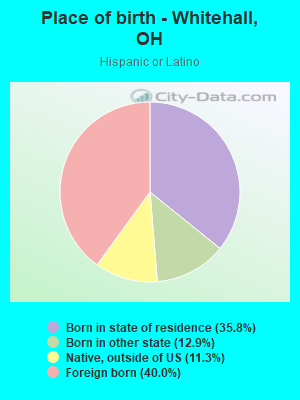
Place of birth - Born in state of residence (%)
Place of birth - Born in state of residence (%) - White
Place of birth - Born in state of residence (%) - Black or African American
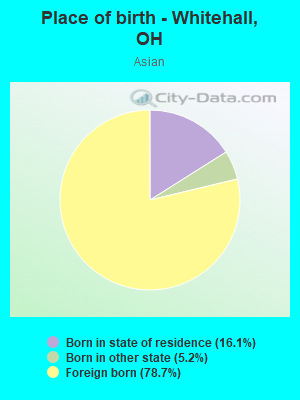
Place of birth - Born in state of residence (%) - Asian
Place of birth - Born in state of residence (%) - Hispanic or Latino
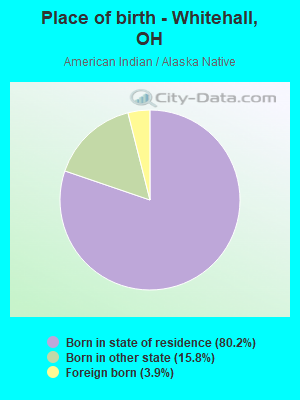
Place of birth - Born in state of residence (%) - American Indian and Alaska Native
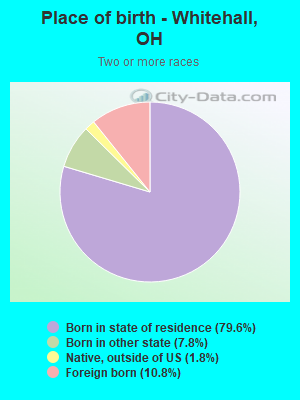
Place of birth - Born in state of residence (%) - Multirace
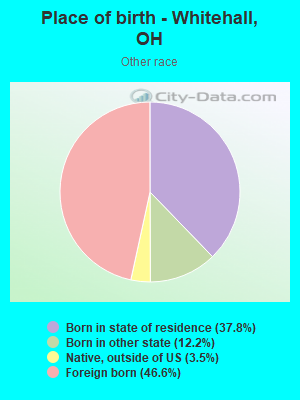
Place of birth - Born in state of residence (%) - Other Race
Place of birth - Born in other state (%)
Place of birth - Born in other state (%) - White
Place of birth - Born in other state (%) - Black or African American
Place of birth - Born in other state (%) - Asian
Place of birth - Born in other state (%) - Hispanic or Latino
Place of birth - Born in other state (%) - American Indian and Alaska Native
Place of birth - Born in other state (%) - Multirace
Place of birth - Born in other state (%) - Other Race
Place of birth - Native, outside of US (%)
Place of birth - Native, outside of US (%) - White
Place of birth - Native, outside of US (%) - Black or African American
Place of birth - Native, outside of US (%) - Asian
Place of birth - Native, outside of US (%) - Hispanic or Latino
Place of birth - Native, outside of US (%) - American Indian and Alaska Native
Place of birth - Native, outside of US (%) - Multirace
Place of birth - Native, outside of US (%) - Other Race
Place of birth - Foreign born (%)
Place of birth - Foreign born (%) - White
Place of birth - Foreign born (%) - Black or African American
Place of birth - Foreign born (%) - Asian
Place of birth - Foreign born (%) - Hispanic or Latino
Place of birth - Foreign born (%) - American Indian and Alaska Native
Place of birth - Foreign born (%) - Multirace
Place of birth - Foreign born (%) - Other Race
Residents speaking English at home (%)
Residents speaking English at home - Born in the United States (%)
Residents speaking English at home - Native, born elsewhere (%)
Residents speaking English at home - Foreign born (%)
Residents speaking Spanish at home (%)
Residents speaking Spanish at home - Born in the United States (%)
Residents speaking Spanish at home - Native, born elsewhere (%)
Residents speaking Spanish at home - Foreign born (%)
Residents speaking other language at home (%)
Residents speaking other language at home - Born in the United States (%)
Residents speaking other language at home - Native, born elsewhere (%)
Residents speaking other language at home - Foreign born (%)
Marital status - Never married (%)
Marital status - Now married (%)
Marital status - Separated (%)
Marital status - Widowed (%)
Marital status - Divorced (%)
Ancestries Reported - Arab (%)
Ancestries Reported - Czech (%)
Ancestries Reported - Danish (%)
Ancestries Reported - Dutch (%)
Ancestries Reported - English (%)
Ancestries Reported - French (%)
Ancestries Reported - French Canadian (%)
Ancestries Reported - German (%)
Ancestries Reported - Greek (%)
Ancestries Reported - Hungarian (%)
Ancestries Reported - Irish (%)
Ancestries Reported - Italian (%)
Ancestries Reported - Lithuanian (%)
Ancestries Reported - Norwegian (%)
Ancestries Reported - Polish (%)
Ancestries Reported - Portuguese (%)
Ancestries Reported - Russian (%)
Ancestries Reported - Scotch-Irish (%)
Ancestries Reported - Scottish (%)
Ancestries Reported - Slovak (%)
Ancestries Reported - Subsaharan African (%)
Ancestries Reported - Swedish (%)
Ancestries Reported - Swiss (%)
Ancestries Reported - Ukrainian (%)
Ancestries Reported - United States (%)
Ancestries Reported - Welsh (%)
Ancestries Reported - West Indian (%)
Ancestries Reported - Other (%)
Geographical mobility - Same house 1 year ago (%)
Geographical mobility - Same house 1 year ago (%) - White
Geographical mobility - Same house 1 year ago (%) - Black or African American
Geographical mobility - Same house 1 year ago (%) - Asian
Geographical mobility - Same house 1 year ago (%) - Hispanic or Latino
Geographical mobility - Same house 1 year ago (%) - American Indian and Alaska Native
Geographical mobility - Same house 1 year ago (%) - Multirace
Geographical mobility - Same house 1 year ago (%) - Other Race
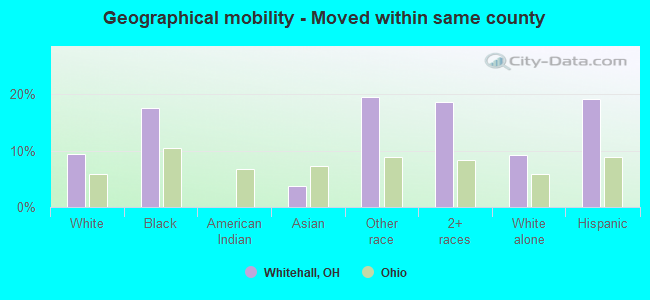
Geographical mobility - Moved within same county (%)
Geographical mobility - Moved within same county (%) - White
Geographical mobility - Moved within same county (%) - Black or African American
Geographical mobility - Moved within same county (%) - Asian
Geographical mobility - Moved within same county (%) - Hispanic or Latino
Geographical mobility - Moved within same county (%) - American Indian and Alaska Native
Geographical mobility - Moved within same county (%) - Multirace
Geographical mobility - Moved within same county (%) - Other Race
Geographical mobility - Moved from different county within same state (%)
Geographical mobility - Moved from different county within same state (%) - White
Geographical mobility - Moved from different county within same state (%) - Black or African American
Geographical mobility - Moved from different county within same state (%) - Asian
Geographical mobility - Moved from different county within same state (%) - Hispanic or Latino
Geographical mobility - Moved from different county within same state (%) - American Indian and Alaska Native
Geographical mobility - Moved from different county within same state (%) - Multirace
Geographical mobility - Moved from different county within same state (%) - Other Race
Geographical mobility - Moved from different state (%)
Geographical mobility - Moved from different state (%) - White
Geographical mobility - Moved from different state (%) - Black or African American
Geographical mobility - Moved from different state (%) - Asian
Geographical mobility - Moved from different state (%) - Hispanic or Latino
Geographical mobility - Moved from different state (%) - American Indian and Alaska Native
Geographical mobility - Moved from different state (%) - Multirace
Geographical mobility - Moved from different state (%) - Other Race
Geographical mobility - Moved from abroad (%)
Geographical mobility - Moved from abroad (%) - White
Geographical mobility - Moved from abroad (%) - Black or African American
Geographical mobility - Moved from abroad (%) - Asian
Geographical mobility - Moved from abroad (%) - Hispanic or Latino
Geographical mobility - Moved from abroad (%) - American Indian and Alaska Native
Geographical mobility - Moved from abroad (%) - Multirace
Geographical mobility - Moved from abroad (%) - Other Race
Place of birth for the foreign-born population - Ireland (%)
Place of birth for the foreign-born population - Denmark (%)
Place of birth for the foreign-born population - Norway (%)
Place of birth for the foreign-born population - Sweden (%)
Place of birth for the foreign-born population - United Kingdom (%)
Place of birth for the foreign-born population - England (%)
Place of birth for the foreign-born population - Scotland (%)
Place of birth for the foreign-born population - Other Northern Europe (%)
Place of birth for the foreign-born population - Austria (%)
Place of birth for the foreign-born population - Belgium (%)
Place of birth for the foreign-born population - France (%)
Place of birth for the foreign-born population - Germany (%)
Place of birth for the foreign-born population - Netherlands (%)
Place of birth for the foreign-born population - Switzerland (%)
Place of birth for the foreign-born population - Other Western Europe (%)
Place of birth for the foreign-born population - Greece (%)
Place of birth for the foreign-born population - Italy (%)
Place of birth for the foreign-born population - Portugal (%)
Place of birth for the foreign-born population - Spain (%)
Place of birth for the foreign-born population - Other Southern Europe (%)
Place of birth for the foreign-born population - Albania (%)
Place of birth for the foreign-born population - Belarus (%)
Place of birth for the foreign-born population - Bosnia and Herzegovina (%)
Place of birth for the foreign-born population - Bulgaria (%)
Place of birth for the foreign-born population - Croatia (%)
Place of birth for the foreign-born population - Czechoslovakia (%)
Place of birth for the foreign-born population - Hungary (%)
Place of birth for the foreign-born population - Latvia (%)
Place of birth for the foreign-born population - Lithuania (%)
Place of birth for the foreign-born population - North Macedonia (Macedonia) (%)
Place of birth for the foreign-born population - Moldova (%)
Place of birth for the foreign-born population - Poland (%)
Place of birth for the foreign-born population - Romania (%)
Place of birth for the foreign-born population - Russia (%)
Place of birth for the foreign-born population - Serbia (%)
Place of birth for the foreign-born population - Ukraine (%)
Place of birth for the foreign-born population - Other Eastern Europe (%)
Place of birth for the foreign-born population - China (%)
Place of birth for the foreign-born population - Hong Kong (%)
Place of birth for the foreign-born population - Taiwan (%)
Place of birth for the foreign-born population - Japan (%)
Place of birth for the foreign-born population - Korea (%)
Place of birth for the foreign-born population - Other Eastern Asia (%)
Place of birth for the foreign-born population - Afghanistan (%)
Place of birth for the foreign-born population - Bangladesh (%)
Place of birth for the foreign-born population - India (%)
Place of birth for the foreign-born population - Iran (%)
Place of birth for the foreign-born population - Kazakhstan (%)
Place of birth for the foreign-born population - Nepal (%)
Place of birth for the foreign-born population - Pakistan (%)
Place of birth for the foreign-born population - Sri Lanka (%)
Place of birth for the foreign-born population - Uzbekistan (%)
Place of birth for the foreign-born population - Other South Central Asia (%)
Place of birth for the foreign-born population - Burma (%)
Place of birth for the foreign-born population - Cambodia (%)
Place of birth for the foreign-born population - Indonesia (%)
Place of birth for the foreign-born population - Laos (%)
Place of birth for the foreign-born population - Malaysia (%)
Place of birth for the foreign-born population - Philippines (%)
Place of birth for the foreign-born population - Singapore (%)
Place of birth for the foreign-born population - Thailand (%)
Place of birth for the foreign-born population - Vietnam (%)
Place of birth for the foreign-born population - Other South Eastern Asia (%)
Place of birth for the foreign-born population - Armenia (%)
Place of birth for the foreign-born population - Iraq (%)
Place of birth for the foreign-born population - Israel (%)
Place of birth for the foreign-born population - Jordan (%)
Place of birth for the foreign-born population - Kuwait (%)
Place of birth for the foreign-born population - Lebanon (%)
Place of birth for the foreign-born population - Saudi Arabia (%)
Place of birth for the foreign-born population - Syria (%)
Place of birth for the foreign-born population - Turkey (%)
Place of birth for the foreign-born population - Yemen (%)
Place of birth for the foreign-born population - Other Western Asia (%)
Place of birth for the foreign-born population - Eritrea (%)
Place of birth for the foreign-born population - Ethiopia (%)
Place of birth for the foreign-born population - Kenya (%)
Place of birth for the foreign-born population - Somalia (%)
Place of birth for the foreign-born population - Uganda (%)
Place of birth for the foreign-born population - Zimbabwe (%)
Place of birth for the foreign-born population - Other Eastern Africa (%)
Place of birth for the foreign-born population - Cameroon (%)
Place of birth for the foreign-born population - Congo (%)
Place of birth for the foreign-born population - Democratic Republic of Congo (Zaire) (%)
Place of birth for the foreign-born population - Other Middle Africa (%)
Place of birth for the foreign-born population - Egypt (%)
Place of birth for the foreign-born population - Morocco (%)
Place of birth for the foreign-born population - Sudan (%)
Place of birth for the foreign-born population - Other Northern Africa (%)
Place of birth for the foreign-born population - South Africa (%)
Place of birth for the foreign-born population - Other Southern Africa (%)
Place of birth for the foreign-born population - Cabo Verde (%)
Place of birth for the foreign-born population - Ghana (%)
Place of birth for the foreign-born population - Liberia (%)
Place of birth for the foreign-born population - Nigeria (%)
Place of birth for the foreign-born population - Senegal (%)
Place of birth for the foreign-born population - Sierra Leone (%)
Place of birth for the foreign-born population - Other Western Africa (%)
Place of birth for the foreign-born population - Australia (%)
Place of birth for the foreign-born population - New Zealand (%)
Place of birth for the foreign-born population - Fiji (%)
Place of birth for the foreign-born population - Micronesia (%)
Place of birth for the foreign-born population - Bahamas (%)
Place of birth for the foreign-born population - Barbados (%)
Place of birth for the foreign-born population - Cuba (%)
Place of birth for the foreign-born population - Dominica (%)
Place of birth for the foreign-born population - Dominican Republic (%)
Place of birth for the foreign-born population - Grenada (%)
Place of birth for the foreign-born population - Haiti (%)
Place of birth for the foreign-born population - Jamaica (%)
Place of birth for the foreign-born population - St. Vincent and the Grenadines (%)
Place of birth for the foreign-born population - Trinidad and Tobago (%)
Place of birth for the foreign-born population - West Indies (%)
Place of birth for the foreign-born population - Other Caribbean (%)
Place of birth for the foreign-born population - Belize (%)
Place of birth for the foreign-born population - Costa Rica (%)
Place of birth for the foreign-born population - El Salvador (%)
Place of birth for the foreign-born population - Guatemala (%)
Place of birth for the foreign-born population - Honduras (%)
Place of birth for the foreign-born population - Mexico (%)
Place of birth for the foreign-born population - Nicaragua (%)
Place of birth for the foreign-born population - Panama (%)
Place of birth for the foreign-born population - Other Central America (%)
Place of birth for the foreign-born population - Argentina (%)
Place of birth for the foreign-born population - Bolivia (%)
Place of birth for the foreign-born population - Brazil (%)
Place of birth for the foreign-born population - Chile (%)
Place of birth for the foreign-born population - Colombia (%)
Place of birth for the foreign-born population - Ecuador (%)
Place of birth for the foreign-born population - Guyana (%)
Place of birth for the foreign-born population - Peru (%)
Place of birth for the foreign-born population - Uruguay (%)
Place of birth for the foreign-born population - Venezuela (%)
Place of birth for the foreign-born population - Other South America (%)
Place of birth for the foreign-born population - Canada (%)
Place of birth for the foreign-born population - Other Northern America (%)
Place of birth for the foreign-born population - Other (%)
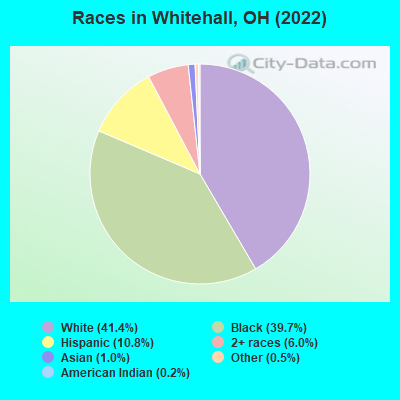
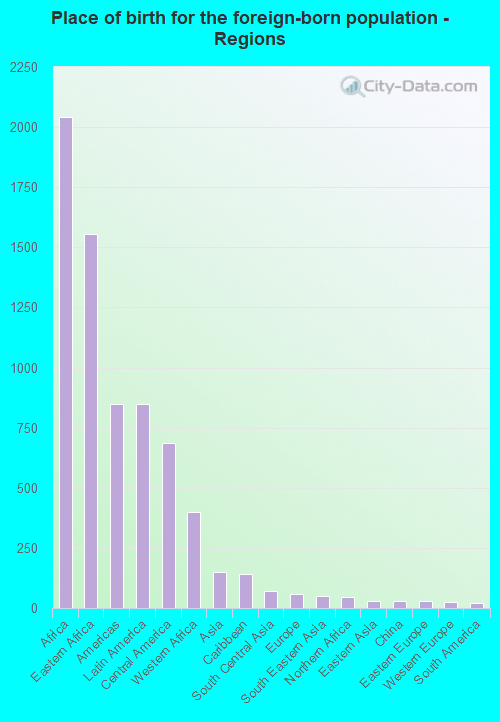
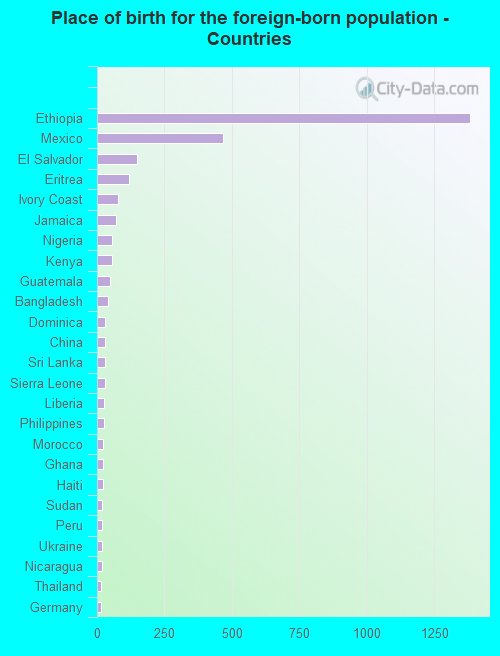
According to 2022 data, the most numerous races in Whitehall, OH are White alone (8,327 residents), Black alone (7,979 residents), and Two or more races (1,205 residents). 77.7% of Whitehall residents speak English at home. 15.4% of Whitehall, OH residents are foreign-born (10.0% born in Africa, 4.1% born in Latin America), which is 74.1% greater than the foreign-born rate of 4.0% across the entire state of Ohio.
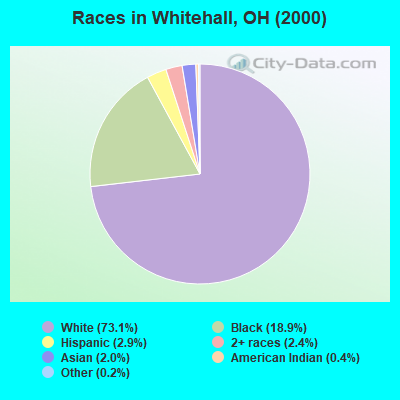
Race distribution in Whitehall
2000 2022
9,538,111 84.0% White alone 1,290,662 11.4% Black alone 217,123 1.9% Hispanic 137,770 1.2% Two or more races 131,670 1.2% Asian alone 21,985 0.2% American Indian alone 13,483 0.1% Other race alone 2,336 0.02% Native Hawaiian and Other
8,948,793 76.1% White alone 1,401,403 11.9% Black alone 529,291 4.5% Two or more races 517,232 4.4% Hispanic 293,387 2.5% Asian alone 52,805 0.4% Other race alone 9,785 0.08% American Indian alone 3,362 0.03% Native Hawaiian and Other
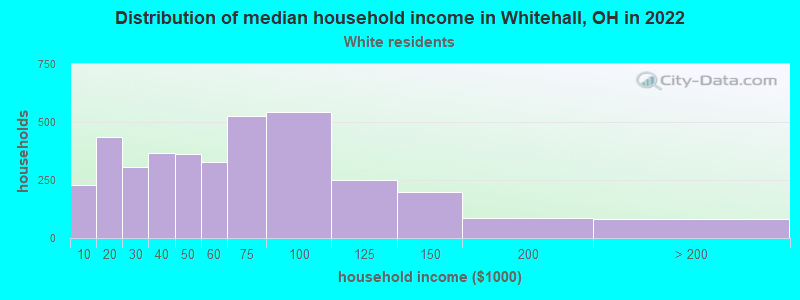
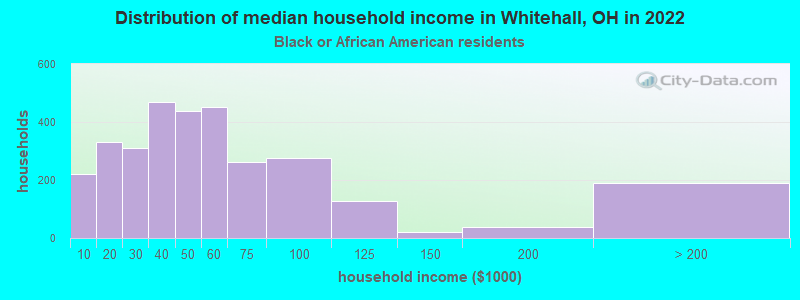
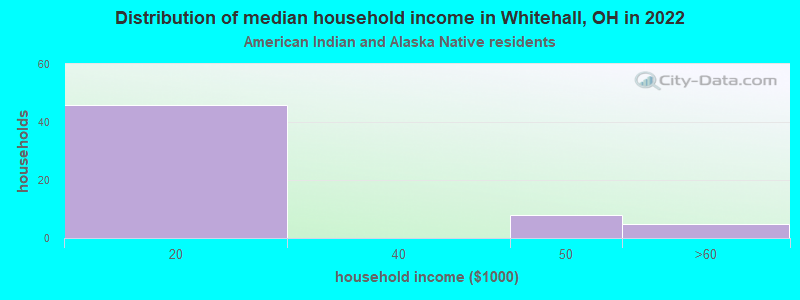
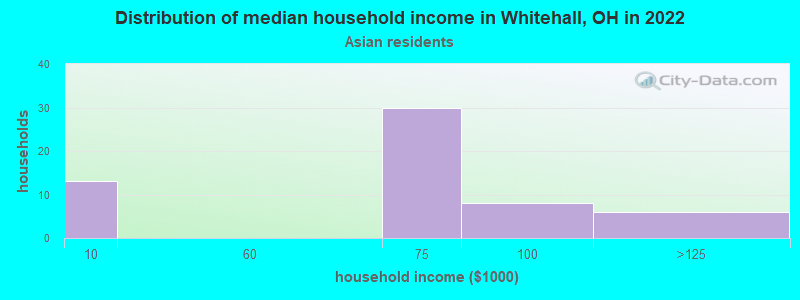
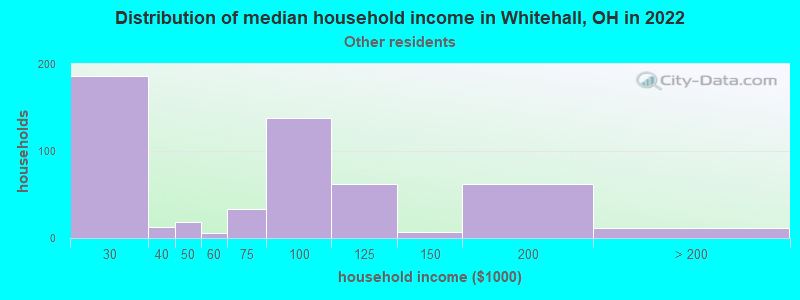
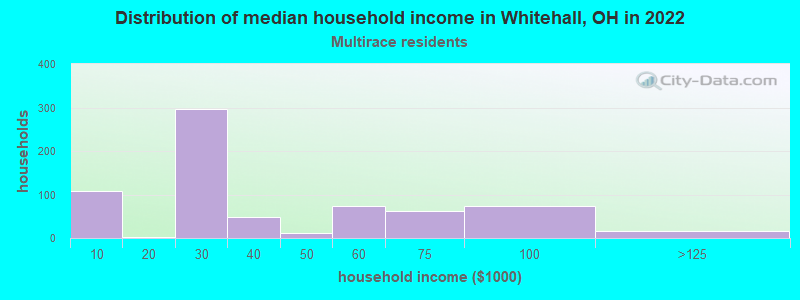
Income and house value in Whitehall Median household income in 2022 $52,433 White non-Hispanic householders$44,381 Black householders$59,277 Asian householders$70,742 Some other race householders$26,441 Two or more races householders$43,567 Hispanic or Latino race householdersMedian 2022 house value $144,391 White Non-Hispanic householders$206,247 Black or African American householders $169,687 Asian householders$125,373 Two or more races householders$149,192 Hispanic or Latino householders
Median age by race in Whitehall
44.8 Median age for White residents43.9 46.5 33.0 Median age for Black or African American residents27.0 37.0 41.7 Median age for American Indian / Alaska Native residents40.5 54.0 40.5 Median age for Asian residents51.3 40.9 -497,206,703.4 Median age for Native Hawaiian / Pacific Islander residents-544,891,640.3 -805,394,989.6 25.4 Median age for Other race residents29.0 22.3 25.5 Median age for Two or more races residents33.3 17.3 45.7 Median age for White alone residents43.3 47.9 32.1 Median age for Hispanic or Latino residents38.5 24.6
Owner/renter occupied households by race in Whitehall
House owners and renters - White residents 2,257 60.1% Owner occupied1,496 39.9% Renter occupiedHouse owners and renters - Black or African American residents 663 20.8% Owner occupied2,519 79.2% Renter occupiedHouse owners and renters - American Indian / Alaska Native residents 4 4.6% Owner occupied80 95.4% Renter occupiedHouse owners and renters - Asian residents 34 60.9% Owner occupied22 39.1% Renter occupiedHouse owners and renters - Other race residents 174 29.6% Owner occupied412 70.4% Renter occupiedHouse owners and renters - Two or more races residents 209 35.9% Owner occupied373 64.1% Renter occupiedHouse owners and renters - White alone residents 2,259 61.2% Owner occupied1,433 38.8% Renter occupiedHouse owners and renters - Hispanic or Latino residents 163 20.4% Owner occupied639 79.6% Renter occupied
Language usage in Whitehall
English speakers - Total 77.7% of residents of Whitehall speak English at home.
9.7% of residents speak Spanish at home 673 37.1% Speak English very well1,142 62.9% Speak English less than very well13.6% of residents speak other language at home 1,287 50.3% Speak English very well1,272 49.7% Speak English less than very well
English speakers - Born in the United States 93.1% of residents of Whitehall speak English at home.
6.2% of residents speak Spanish at home 154 78.6% Speak English very well42 21.4% Speak English less than very well0.9% of residents speak other language at home 28 100.0% Speak English very well
English speakers - Native, born elsewhere 39.3% of residents of Whitehall speak English at home.
51.0% of residents speak Spanish at home 49 25.0% Speak English very well147 75.0% Speak English less than very well11.2% of residents speak other language at home 43 100.0% Speak English less than very well
English speakers - Foreign-born 13.5% of residents of Whitehall speak English at home.
25.1% of residents speak Spanish at home 54 6.8% Speak English very well735 93.2% Speak English less than very well63.4% of residents speak other language at home 757 38.0% Speak English very well1,234 62.0% Speak English less than very well
White (Caucasian) - Speak only English Native:
97.3% (7,747)Foreign-born:
26.8% (26)
White (Caucasian) - Speak another language Native:
2.6% (205)Foreign-born:
73.3% (72)
Black or African American - Speak only English Native:
91.1% (4,911)Foreign-born:
18.0% (369)
Black or African American - Speak another language Native:
9.7% (522)Foreign-born:
82.1% (1,686)
American Indian / Alaska Native - Speak another language Native:
52.9% (131)Foreign-born:
99.1% (9)
Asian - Speak only English Native:
71.6% (21)Foreign-born:
10.5% (16)
Asian - Speak another language Native:
31.7% (9)Foreign-born:
90.0% (135)
Other race - Speak only English Native:
17.8% (155)Foreign-born:
2.5% (22)
Other race - Speak another language Native:
95.1% (827)Foreign-born:
97.5% (852)
Two or more races - Speak only English Native:
96.8% (1,070)Foreign-born:
1.9% (3)
Two or more races - Speak another language Native:
4.0% (44)Foreign-born:
97.9% (149)
White alone - Speak only English Native:
98.3% (7,725)Foreign-born:
13.1% (10)
White alone - Speak another language Native:
1.7% (131)Foreign-born:
89.4% (69)
Hispanic or Latino - Speak only English Native:
23.8% (278)Foreign-born:
10.0% (85)
Hispanic or Latino - Speak another language Native:
83.7% (977)Foreign-born:
90.6% (777)
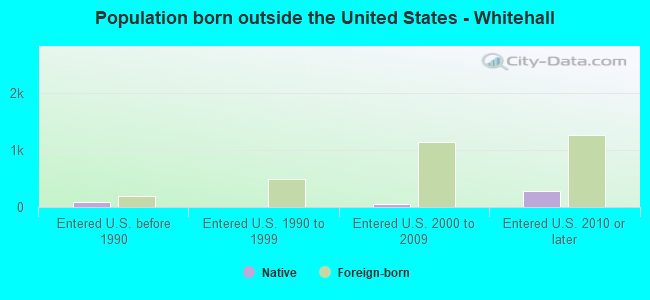
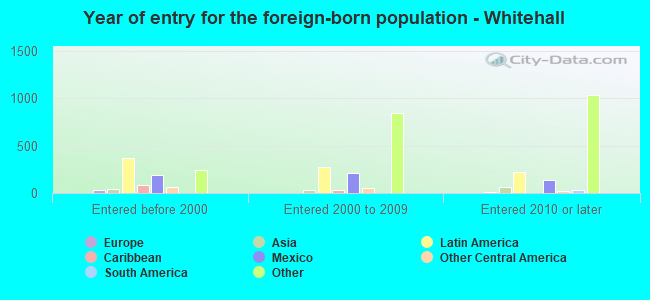
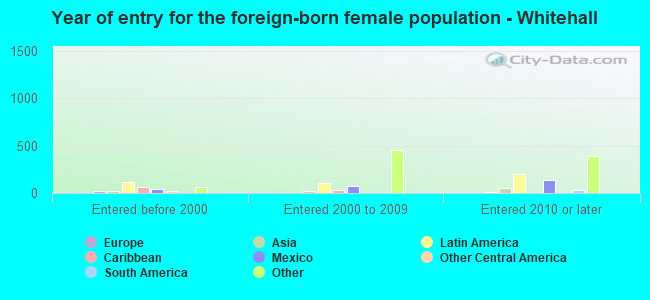
Foreign-born residents in Whitehall 3,103 residents are foreign born (10.0% Africa , 4.1% Latin America ).
Marital status for residents in Whitehall Marital status - White (Caucasian) population 15 years and over
Males 44.4% Never married40.4% Now married1.7% Separated5.0% Widowed8.6% DivorcedFemales 30.8% Never married38.0% Now married1.8% Separated9.7% Widowed19.7% DivorcedWomen who gave birth in the past 12 months Now married:
2.4% (3)Unmarried:
97.6% (117)
Women who did not give birth in the past 12 months Now married:
42.3% (702)Unmarried:
57.7% (958)
Marital status - Black or African American population 15 years and over
Males 46.6% Never married33.6% Now married5.0% Separated2.7% Widowed12.0% DivorcedFemales 40.6% Never married31.1% Now married6.3% Separated5.7% Widowed16.2% DivorcedWomen who gave birth in the past 12 months Now married:
20.3% (13)Unmarried:
79.7% (52)
Women who did not give birth in the past 12 months Now married:
40.7% (894)Unmarried:
59.3% (1,301)
Marital status - American Indian / Alaska Native population 15 years and over
Males 76.1% Never married23.9% Now married0.0% Separated0.0% Widowed0.0% DivorcedFemales 46.9% Never married34.4% Now married0.0% Separated0.0% Widowed18.8% DivorcedWomen who gave birth in the past 12 months Now married:
100.0% (10)Unmarried:
0.0% (0)
Women who did not give birth in the past 12 months Now married:
0.0% (0)Unmarried:
100.0% (7)
Marital status - Asian population 15 years and over
Males 13.2% Never married66.2% Now married0.0% Separated20.6% Widowed0.0% DivorcedFemales 4.3% Never married82.8% Now married0.0% Separated12.9% Widowed0.0% DivorcedWomen who did not give birth in the past 12 months Now married:
94.0% (62)Unmarried:
6.0% (4)
Marital status - Other race population 15 years and over
Males 49.8% Never married32.6% Now married1.5% Separated0.0% Widowed16.1% DivorcedFemales 68.3% Never married27.6% Now married0.0% Separated0.0% Widowed4.1% DivorcedWomen who gave birth in the past 12 months Now married:
0.0% (0)Unmarried:
100.0% (27)
Women who did not give birth in the past 12 months Now married:
24.6% (121)Unmarried:
75.4% (369)
Marital status - Two or more races population 15 years and over
Males 59.1% Never married12.1% Now married0.3% Separated10.0% Widowed18.5% DivorcedFemales 54.4% Never married23.7% Now married0.0% Separated0.0% Widowed21.9% DivorcedWomen who did not give birth in the past 12 months Now married:
22.2% (55)Unmarried:
77.8% (194)
Marital status - White alone, not Hispanic / Latino population 15 years and over
Males 45.0% Never married39.7% Now married1.7% Separated5.2% Widowed8.4% DivorcedFemales 31.0% Never married37.2% Now married1.9% Separated9.9% Widowed20.1% DivorcedWomen who gave birth in the past 12 months Now married:
2.4% (3)Unmarried:
97.6% (119)
Women who did not give birth in the past 12 months Now married:
40.6% (655)Unmarried:
59.4% (957)
Marital status - Hispanic or Latino population 15 years and over
Males 46.2% Never married30.7% Now married1.1% Separated0.0% Widowed22.0% DivorcedFemales 61.3% Never married31.0% Now married0.0% Separated0.0% Widowed7.8% DivorcedWomen who gave birth in the past 12 months Now married:
26.7% (9)Unmarried:
73.3% (24)
Women who did not give birth in the past 12 months Now married:
32.9% (182)Unmarried:
67.1% (371)
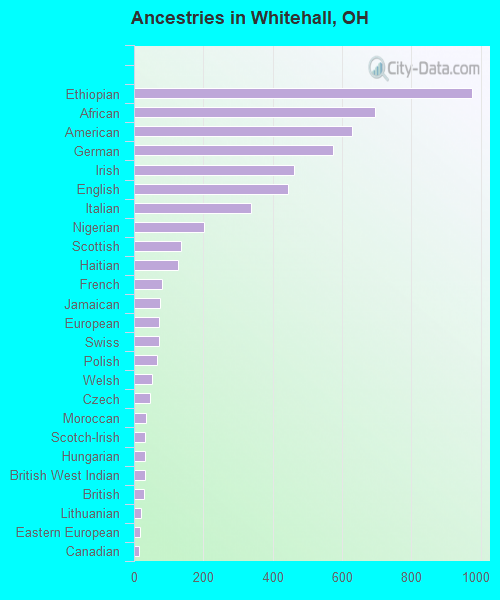
Ancestries in Whitehall
975 7.7% Ethiopian694 5.5% African630 5.0% American575 4.5% German462 3.6% Irish443 3.5% English336 2.6% Italian201 1.6% Nigerian136 1.1% Scottish128 1.0% Haitian81 0.6% French76 0.6% Jamaican71 0.6% European71 0.6% Swiss67 0.5% Polish53 0.4% Welsh45 0.4% Czech35 0.3% Moroccan33 0.3% Scotch-Irish31 0.2% Hungarian31 0.2% British West Indian28 0.2% British20 0.2% Lithuanian17 0.1% Eastern European14 0.1% Canadian14 0.1% Estonian14 0.1% Greek13 0.1% Macedonian10 0.08% Austrian9 0.07% Slovak8 0.06% Belgian7 0.06% Pennsylvania German7 0.06% Portuguese5 0.04% Senegalese5 0.04% Ukrainian4 0.03% French Canadian3 0.02% Finnish3 0.02% Norwegian2 0.02% Guyanese
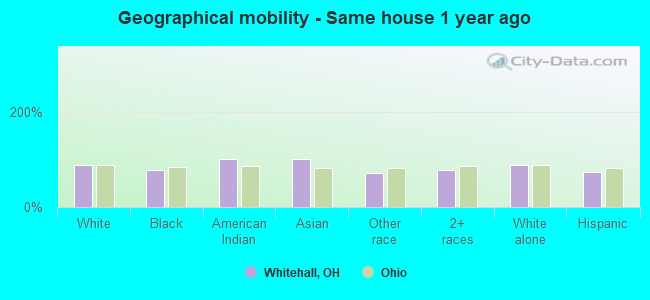
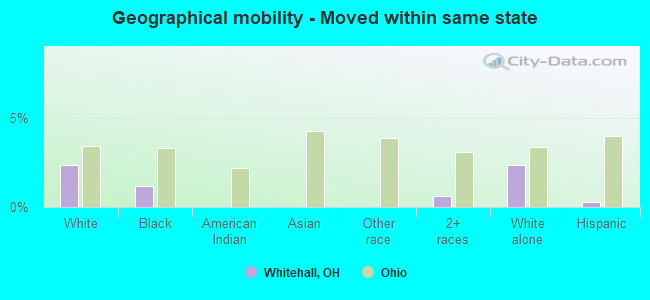
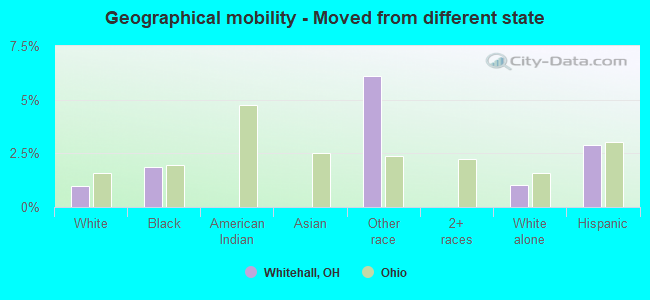
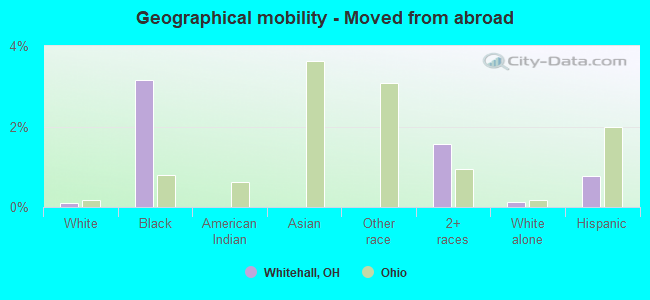
Geographical mobility in Whitehall Same house 1 year ago 7,263 87.0% White (Caucasian)6,118 77.1% Black or African American148 100.0% American Indian / Alaska Native193 100.0% Asian1,346 71.7% Other race1,083 77.3% Two or more races7,182 87.2% White alone, not Hispanic / Latino1,575 73.3% Hispanic or LatinoMoved within same county 782 9.4% White / Caucasian1,394 17.6% Black or African American7 3.7% Asian364 19.4% Other race261 18.7% Two or more races756 9.2% White alone, not Hispanic / Latino412 19.2% Hispanic or LatinoMoved within same state 198 2.4% White / Caucasian95 1.2% Black or African American9 0.6% Two or more races193 2.3% White alone, not Hispanic / Latino6 0.3% Hispanic or LatinoMoved from different state 81 1.0% White / Caucasian147 1.9% Black or African American114 6.1% Other race83 1.0% White alone, not Hispanic / Latino62 2.9% Hispanic or LatinoMoved from abroad 8 0.1% White251 3.2% Black or African American22 1.6% Two or more races9 0.1% White alone, not Hispanic / Latino17 0.8% Hispanic or Latino
Children Nativity (place of birth) in Whitehall
Children under 6 years - Living with two parents Both parents native 171 100.0% NativeBoth parents foreign-born 105 77.3% Native31 22.7% Foreign-bornOne native, one foreign-born parent 45 100.0% NativeChildren under 6 years - Living with one parent Native parent 786 100.0% NativeForeign-born parent 227 81.1% Native53 18.9% Foreign-bornChildren 6 to 17 years - Living with two parents Both parents native 420 100.0% NativeBoth parents foreign-born 510 77.4% Native149 22.6% Foreign-bornOne native, one foreign-born parent 52 90.8% Native5 9.2% Foreign-bornChildren 6 to 17 years - Living with one parent Native parent 1,613 100.0% NativeForeign-born parent 481 54.7% Native398 45.3% Foreign-born
Grandparents responsible for own grandchildren in Whitehall
Grandparents (30 to 59 years) White / Caucasian 49 22.2% Responsible for grandchildren172 77.8% Not responsible for grandchildrenBlack or African American 51 100.0% Not responsible for grandchildrenOther race 11 100.0% Not responsible for grandchildrenTwo or more races 13 100.0% Responsible for grandchildrenWhite alone, not Hispanic / Latino 50 21.7% Responsible for grandchildren180 78.3% Not responsible for grandchildrenHispanic or Latino 10 56.8% Responsible for grandchildren7 43.2% Not responsible for grandchildrenGrandparents (60 years and over) White / Caucasian 56 45.0% Responsible for grandchildren69 55.0% Not responsible for grandchildrenBlack or African American 3 2.4% Responsible for grandchildren125 97.6% Not responsible for grandchildrenTwo or more races 8 100.0% Responsible for grandchildrenWhite alone, not Hispanic / Latino 57 44.6% Responsible for grandchildren71 55.4% Not responsible for grandchildren