Races in White Meadow Lake, New Jersey (NJ) Detailed Stats
Data:
Races - White alone (%)
Races - White alone (% change since 2000)
Races - Black alone (%)
Races - Black alone (% change since 2000)
Races - American Indian alone (%)
Races - American Indian alone (% change since 2000)
Races - Asian alone (%)
Races - Asian alone (% change since 2000)
Races - Hispanic (%)
Races - Hispanic (% change since 2000)
Races - Native Hawaiian and Other Pacific Islander alone (%)
Races - Native Hawaiian and Other Pacific Islander alone (% change since 2000)
Races - Two or more races(%)
Races - Two or more races(% change since 2000)
Races - Other race alone (%)
Races - Other race alone (% change since 2000)
Racial diversity
Place of birth - Born in state of residence (%)
Place of birth - Born in state of residence (%) - White
Place of birth - Born in state of residence (%) - Black or African American
Place of birth - Born in state of residence (%) - Asian
Place of birth - Born in state of residence (%) - Hispanic or Latino
Place of birth - Born in state of residence (%) - American Indian and Alaska Native
Place of birth - Born in state of residence (%) - Multirace
Place of birth - Born in state of residence (%) - Other Race
Place of birth - Born in other state (%)
Place of birth - Born in other state (%) - White
Place of birth - Born in other state (%) - Black or African American
Place of birth - Born in other state (%) - Asian
Place of birth - Born in other state (%) - Hispanic or Latino
Place of birth - Born in other state (%) - American Indian and Alaska Native
Place of birth - Born in other state (%) - Multirace
Place of birth - Born in other state (%) - Other Race
Place of birth - Native, outside of US (%)
Place of birth - Native, outside of US (%) - White
Place of birth - Native, outside of US (%) - Black or African American
Place of birth - Native, outside of US (%) - Asian
Place of birth - Native, outside of US (%) - Hispanic or Latino
Place of birth - Native, outside of US (%) - American Indian and Alaska Native
Place of birth - Native, outside of US (%) - Multirace
Place of birth - Native, outside of US (%) - Other Race
Place of birth - Foreign born (%)
Place of birth - Foreign born (%) - White
Place of birth - Foreign born (%) - Black or African American
Place of birth - Foreign born (%) - Asian
Place of birth - Foreign born (%) - Hispanic or Latino
Place of birth - Foreign born (%) - American Indian and Alaska Native
Place of birth - Foreign born (%) - Multirace
Place of birth - Foreign born (%) - Other Race
Residents speaking English at home (%)
Residents speaking English at home - Born in the United States (%)
Residents speaking English at home - Native, born elsewhere (%)
Residents speaking English at home - Foreign born (%)
Residents speaking Spanish at home (%)
Residents speaking Spanish at home - Born in the United States (%)
Residents speaking Spanish at home - Native, born elsewhere (%)
Residents speaking Spanish at home - Foreign born (%)
Residents speaking other language at home (%)
Residents speaking other language at home - Born in the United States (%)
Residents speaking other language at home - Native, born elsewhere (%)
Residents speaking other language at home - Foreign born (%)
Marital status - Never married (%)
Marital status - Now married (%)
Marital status - Separated (%)
Marital status - Widowed (%)
Marital status - Divorced (%)
Ancestries Reported - Arab (%)
Ancestries Reported - Czech (%)
Ancestries Reported - Danish (%)
Ancestries Reported - Dutch (%)
Ancestries Reported - English (%)
Ancestries Reported - French (%)
Ancestries Reported - French Canadian (%)
Ancestries Reported - German (%)
Ancestries Reported - Greek (%)
Ancestries Reported - Hungarian (%)
Ancestries Reported - Irish (%)
Ancestries Reported - Italian (%)
Ancestries Reported - Lithuanian (%)
Ancestries Reported - Norwegian (%)
Ancestries Reported - Polish (%)
Ancestries Reported - Portuguese (%)
Ancestries Reported - Russian (%)
Ancestries Reported - Scotch-Irish (%)
Ancestries Reported - Scottish (%)
Ancestries Reported - Slovak (%)
Ancestries Reported - Subsaharan African (%)
Ancestries Reported - Swedish (%)
Ancestries Reported - Swiss (%)
Ancestries Reported - Ukrainian (%)
Ancestries Reported - United States (%)
Ancestries Reported - Welsh (%)
Ancestries Reported - West Indian (%)
Ancestries Reported - Other (%)
Geographical mobility - Same house 1 year ago (%)
Geographical mobility - Same house 1 year ago (%) - White
Geographical mobility - Same house 1 year ago (%) - Black or African American
Geographical mobility - Same house 1 year ago (%) - Asian
Geographical mobility - Same house 1 year ago (%) - Hispanic or Latino
Geographical mobility - Same house 1 year ago (%) - American Indian and Alaska Native
Geographical mobility - Same house 1 year ago (%) - Multirace
Geographical mobility - Same house 1 year ago (%) - Other Race
Geographical mobility - Moved within same county (%)
Geographical mobility - Moved within same county (%) - White
Geographical mobility - Moved within same county (%) - Black or African American
Geographical mobility - Moved within same county (%) - Asian
Geographical mobility - Moved within same county (%) - Hispanic or Latino
Geographical mobility - Moved within same county (%) - American Indian and Alaska Native
Geographical mobility - Moved within same county (%) - Multirace
Geographical mobility - Moved within same county (%) - Other Race
Geographical mobility - Moved from different county within same state (%)
Geographical mobility - Moved from different county within same state (%) - White
Geographical mobility - Moved from different county within same state (%) - Black or African American
Geographical mobility - Moved from different county within same state (%) - Asian
Geographical mobility - Moved from different county within same state (%) - Hispanic or Latino
Geographical mobility - Moved from different county within same state (%) - American Indian and Alaska Native
Geographical mobility - Moved from different county within same state (%) - Multirace
Geographical mobility - Moved from different county within same state (%) - Other Race
Geographical mobility - Moved from different state (%)
Geographical mobility - Moved from different state (%) - White
Geographical mobility - Moved from different state (%) - Black or African American
Geographical mobility - Moved from different state (%) - Asian
Geographical mobility - Moved from different state (%) - Hispanic or Latino
Geographical mobility - Moved from different state (%) - American Indian and Alaska Native
Geographical mobility - Moved from different state (%) - Multirace
Geographical mobility - Moved from different state (%) - Other Race
Geographical mobility - Moved from abroad (%)
Geographical mobility - Moved from abroad (%) - White
Geographical mobility - Moved from abroad (%) - Black or African American
Geographical mobility - Moved from abroad (%) - Asian
Geographical mobility - Moved from abroad (%) - Hispanic or Latino
Geographical mobility - Moved from abroad (%) - American Indian and Alaska Native
Geographical mobility - Moved from abroad (%) - Multirace
Geographical mobility - Moved from abroad (%) - Other Race
Place of birth for the foreign-born population - Ireland (%)
Place of birth for the foreign-born population - Denmark (%)
Place of birth for the foreign-born population - Norway (%)
Place of birth for the foreign-born population - Sweden (%)
Place of birth for the foreign-born population - United Kingdom (%)
Place of birth for the foreign-born population - England (%)
Place of birth for the foreign-born population - Scotland (%)
Place of birth for the foreign-born population - Other Northern Europe (%)
Place of birth for the foreign-born population - Austria (%)
Place of birth for the foreign-born population - Belgium (%)
Place of birth for the foreign-born population - France (%)
Place of birth for the foreign-born population - Germany (%)
Place of birth for the foreign-born population - Netherlands (%)
Place of birth for the foreign-born population - Switzerland (%)
Place of birth for the foreign-born population - Other Western Europe (%)
Place of birth for the foreign-born population - Greece (%)
Place of birth for the foreign-born population - Italy (%)
Place of birth for the foreign-born population - Portugal (%)
Place of birth for the foreign-born population - Spain (%)
Place of birth for the foreign-born population - Other Southern Europe (%)
Place of birth for the foreign-born population - Albania (%)
Place of birth for the foreign-born population - Belarus (%)
Place of birth for the foreign-born population - Bosnia and Herzegovina (%)
Place of birth for the foreign-born population - Bulgaria (%)
Place of birth for the foreign-born population - Croatia (%)
Place of birth for the foreign-born population - Czechoslovakia (%)
Place of birth for the foreign-born population - Hungary (%)
Place of birth for the foreign-born population - Latvia (%)
Place of birth for the foreign-born population - Lithuania (%)
Place of birth for the foreign-born population - North Macedonia (Macedonia) (%)
Place of birth for the foreign-born population - Moldova (%)
Place of birth for the foreign-born population - Poland (%)
Place of birth for the foreign-born population - Romania (%)
Place of birth for the foreign-born population - Russia (%)
Place of birth for the foreign-born population - Serbia (%)
Place of birth for the foreign-born population - Ukraine (%)
Place of birth for the foreign-born population - Other Eastern Europe (%)
Place of birth for the foreign-born population - China (%)
Place of birth for the foreign-born population - Hong Kong (%)
Place of birth for the foreign-born population - Taiwan (%)
Place of birth for the foreign-born population - Japan (%)
Place of birth for the foreign-born population - Korea (%)
Place of birth for the foreign-born population - Other Eastern Asia (%)
Place of birth for the foreign-born population - Afghanistan (%)
Place of birth for the foreign-born population - Bangladesh (%)
Place of birth for the foreign-born population - India (%)
Place of birth for the foreign-born population - Iran (%)
Place of birth for the foreign-born population - Kazakhstan (%)
Place of birth for the foreign-born population - Nepal (%)
Place of birth for the foreign-born population - Pakistan (%)
Place of birth for the foreign-born population - Sri Lanka (%)
Place of birth for the foreign-born population - Uzbekistan (%)
Place of birth for the foreign-born population - Other South Central Asia (%)
Place of birth for the foreign-born population - Burma (%)
Place of birth for the foreign-born population - Cambodia (%)
Place of birth for the foreign-born population - Indonesia (%)
Place of birth for the foreign-born population - Laos (%)
Place of birth for the foreign-born population - Malaysia (%)
Place of birth for the foreign-born population - Philippines (%)
Place of birth for the foreign-born population - Singapore (%)
Place of birth for the foreign-born population - Thailand (%)
Place of birth for the foreign-born population - Vietnam (%)
Place of birth for the foreign-born population - Other South Eastern Asia (%)
Place of birth for the foreign-born population - Armenia (%)
Place of birth for the foreign-born population - Iraq (%)
Place of birth for the foreign-born population - Israel (%)
Place of birth for the foreign-born population - Jordan (%)
Place of birth for the foreign-born population - Kuwait (%)
Place of birth for the foreign-born population - Lebanon (%)
Place of birth for the foreign-born population - Saudi Arabia (%)
Place of birth for the foreign-born population - Syria (%)
Place of birth for the foreign-born population - Turkey (%)
Place of birth for the foreign-born population - Yemen (%)
Place of birth for the foreign-born population - Other Western Asia (%)
Place of birth for the foreign-born population - Eritrea (%)
Place of birth for the foreign-born population - Ethiopia (%)
Place of birth for the foreign-born population - Kenya (%)
Place of birth for the foreign-born population - Somalia (%)
Place of birth for the foreign-born population - Uganda (%)
Place of birth for the foreign-born population - Zimbabwe (%)
Place of birth for the foreign-born population - Other Eastern Africa (%)
Place of birth for the foreign-born population - Cameroon (%)
Place of birth for the foreign-born population - Congo (%)
Place of birth for the foreign-born population - Democratic Republic of Congo (Zaire) (%)
Place of birth for the foreign-born population - Other Middle Africa (%)
Place of birth for the foreign-born population - Egypt (%)
Place of birth for the foreign-born population - Morocco (%)
Place of birth for the foreign-born population - Sudan (%)
Place of birth for the foreign-born population - Other Northern Africa (%)
Place of birth for the foreign-born population - South Africa (%)
Place of birth for the foreign-born population - Other Southern Africa (%)
Place of birth for the foreign-born population - Cabo Verde (%)
Place of birth for the foreign-born population - Ghana (%)
Place of birth for the foreign-born population - Liberia (%)
Place of birth for the foreign-born population - Nigeria (%)
Place of birth for the foreign-born population - Senegal (%)
Place of birth for the foreign-born population - Sierra Leone (%)
Place of birth for the foreign-born population - Other Western Africa (%)
Place of birth for the foreign-born population - Australia (%)
Place of birth for the foreign-born population - New Zealand (%)
Place of birth for the foreign-born population - Fiji (%)
Place of birth for the foreign-born population - Micronesia (%)
Place of birth for the foreign-born population - Bahamas (%)
Place of birth for the foreign-born population - Barbados (%)
Place of birth for the foreign-born population - Cuba (%)
Place of birth for the foreign-born population - Dominica (%)
Place of birth for the foreign-born population - Dominican Republic (%)
Place of birth for the foreign-born population - Grenada (%)
Place of birth for the foreign-born population - Haiti (%)
Place of birth for the foreign-born population - Jamaica (%)
Place of birth for the foreign-born population - St. Vincent and the Grenadines (%)
Place of birth for the foreign-born population - Trinidad and Tobago (%)
Place of birth for the foreign-born population - West Indies (%)
Place of birth for the foreign-born population - Other Caribbean (%)
Place of birth for the foreign-born population - Belize (%)
Place of birth for the foreign-born population - Costa Rica (%)
Place of birth for the foreign-born population - El Salvador (%)
Place of birth for the foreign-born population - Guatemala (%)
Place of birth for the foreign-born population - Honduras (%)
Place of birth for the foreign-born population - Mexico (%)
Place of birth for the foreign-born population - Nicaragua (%)
Place of birth for the foreign-born population - Panama (%)
Place of birth for the foreign-born population - Other Central America (%)
Place of birth for the foreign-born population - Argentina (%)
Place of birth for the foreign-born population - Bolivia (%)
Place of birth for the foreign-born population - Brazil (%)
Place of birth for the foreign-born population - Chile (%)
Place of birth for the foreign-born population - Colombia (%)
Place of birth for the foreign-born population - Ecuador (%)
Place of birth for the foreign-born population - Guyana (%)
Place of birth for the foreign-born population - Peru (%)
Place of birth for the foreign-born population - Uruguay (%)
Place of birth for the foreign-born population - Venezuela (%)
Place of birth for the foreign-born population - Other South America (%)
Place of birth for the foreign-born population - Canada (%)
Place of birth for the foreign-born population - Other Northern America (%)
Place of birth for the foreign-born population - Other (%)
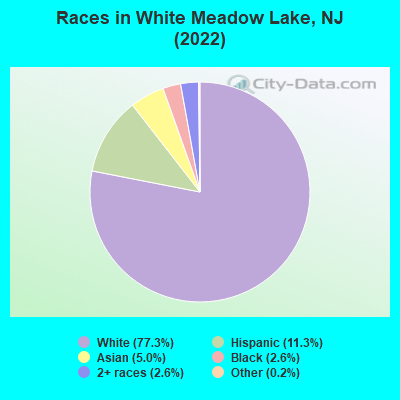
According to 2022 data, the most numerous races in White Meadow Lake, NJ are White alone (7,158 residents), Hispanic (1,047 residents), and Black alone (245 residents). 85.6% of White Meadow Lake residents speak English at home. 11.4% of White Meadow Lake, NJ residents are foreign-born (3.9% born in Europe, 3.7% born in Asia, 3.1% born in Latin America), which is 101.0% less than the foreign-born rate of 23.0% across the entire state of New Jersey.
Race distribution in White Meadow Lake
2000 2022
5,557,209 66.0% White alone 1,117,191 13.3% Hispanic 1,096,171 13.0% Black alone 477,012 5.7% Asian alone 133,689 1.6% Two or more races 19,565 0.2% Other race alone 11,338 0.1% American Indian alone 2,175 0.03% Native Hawaiian and Other
4,766,476 51.5% White alone 2,028,470 21.9% Hispanic 1,111,632 12.0% Black alone 923,546 10.0% Asian alone 332,237 3.6% Two or more races 89,847 1.0% Other race alone 8,557 0.09% American Indian alone 934 0.01% Native Hawaiian and Other
Income and house value in White Meadow Lake Median household income in 2022 $148,959 White non-Hispanic householders$167,077 Asian householders$172,808 Two or more races householders$137,633 Hispanic or Latino race householdersMedian 2022 house value $431,647 White Non-Hispanic householders$530,073 Black or African American householders $425,844 Asian householders$453,296 Two or more races householders$470,482 Hispanic or Latino householders
Median age by race in White Meadow Lake
41.4 Median age for White residents40.9 42.9 45.2 Median age for Black or African American residents45.8 55.7 -847,710,329.3 Median age for American Indian / Alaska Native residents-707,246,376.1 -671,264,367.1 34.2 Median age for Asian residents36.1 33.1 -804,177,544.9 Median age for Native Hawaiian / Pacific Islander residents-666,666,666.0 -713,070,378.3 51.5 Median age for Other race residents43.1 56.4 39.3 Median age for Two or more races residents35.0 75.7 42.8 Median age for White alone residents42.6 43.5 38.6 Median age for Hispanic or Latino residents31.7 41.8
Owner/renter occupied households by race in White Meadow Lake
House owners and renters - White residents 2,282 97.3% Owner occupied63 2.7% Renter occupiedHouse owners and renters - Black or African American residents 87 86.2% Owner occupied14 13.8% Renter occupiedHouse owners and renters - Asian residents 131 90.7% Owner occupied13 9.3% Renter occupiedHouse owners and renters - Other race residents 28 100.0% Owner occupiedHouse owners and renters - Two or more races residents 230 100.0% Owner occupiedHouse owners and renters - White alone residents 2,174 96.8% Owner occupied72 3.2% Renter occupiedHouse owners and renters - Hispanic or Latino residents 356 100.0% Owner occupied
Language usage in White Meadow Lake
English speakers - Total 85.6% of residents of White Meadow Lake speak English at home.
5.6% of residents speak Spanish at home 281 57.2% Speak English very well210 42.8% Speak English less than very well8.7% of residents speak other language at home 610 80.4% Speak English very well149 19.6% Speak English less than very well
English speakers - Born in the United States 90.0% of residents of White Meadow Lake speak English at home.
2.1% of residents speak Spanish at home 35 100.0% Speak English very well7.9% of residents speak other language at home 134 100.0% Speak English very well
English speakers - Native, born elsewhere 7.3% of residents of White Meadow Lake speak English at home.
87.5% of residents speak Spanish at home 40 47.6% Speak English very well44 52.4% Speak English less than very well8.3% of residents speak other language at home 8 100.0% Speak English very well
English speakers - Foreign-born 29.9% of residents of White Meadow Lake speak English at home.
22.6% of residents speak Spanish at home 121 52.2% Speak English very well111 47.8% Speak English less than very well46.4% of residents speak other language at home 352 73.9% Speak English very well124 26.1% Speak English less than very well
White (Caucasian) - Speak only English Native:
96.5% (6,431)Foreign-born:
52.2% (195)
White (Caucasian) - Speak another language Native:
3.8% (251)Foreign-born:
52.9% (197)
Black or African American - Speak only English Native:
100.0% (205)Foreign-born:
100.0% (38)
Asian - Speak only English Native:
31.5% (36)Foreign-born:
3.6% (11)
Asian - Speak another language Native:
66.9% (75)Foreign-born:
97.8% (291)
Other race - Speak only English Native:
43.6% (16)Foreign-born:
24.2% (11)
Other race - Speak another language Native:
54.4% (21)Foreign-born:
76.8% (36)
Two or more races - Speak only English Native:
74.1% (325)Foreign-born:
15.9% (24)
Two or more races - Speak another language Native:
25.7% (113)Foreign-born:
84.4% (128)
White alone - Speak only English Native:
96.0% (6,148)Foreign-born:
47.3% (198)
White alone - Speak another language Native:
4.0% (258)Foreign-born:
50.7% (212)
Hispanic or Latino - Speak only English Native:
74.1% (540)Foreign-born:
11.8% (28)
Hispanic or Latino - Speak another language Native:
27.8% (202)Foreign-born:
88.9% (211)
Foreign-born residents in White Meadow Lake 1,060 residents are foreign born (3.9% Europe , 3.7% Asia , 3.1% Latin America ).
This city:
11.4%New Jersey:
23.2%
Marital status for residents in White Meadow Lake Marital status - White (Caucasian) population 15 years and over
Males 31.2% Never married60.4% Now married0.9% Separated1.5% Widowed5.9% DivorcedFemales 24.9% Never married64.7% Now married0.9% Separated5.0% Widowed4.5% DivorcedWomen who gave birth in the past 12 months Now married:
100.0% (146)Unmarried:
0.0% (0)
Women who did not give birth in the past 12 months Now married:
50.8% (706)Unmarried:
49.2% (685)
Marital status - Black or African American population 15 years and over
Males 60.9% Never married38.5% Now married0.0% Separated0.0% Widowed0.6% DivorcedFemales 0.0% Never married100.0% Now married0.0% Separated0.0% Widowed0.0% DivorcedWomen who did not give birth in the past 12 months Now married:
100.0% (22)Unmarried:
0.0% (0)
Marital status - Asian population 15 years and over
Males 39.5% Never married52.5% Now married0.0% Separated0.0% Widowed8.0% DivorcedFemales 0.0% Never married100.0% Now married0.0% Separated0.0% Widowed0.0% DivorcedWomen who gave birth in the past 12 months Now married:
100.0% (14)Unmarried:
0.0% (0)
Women who did not give birth in the past 12 months Now married:
100.0% (78)Unmarried:
0.0% (0)
Marital status - Other race population 15 years and over
Males 42.9% Never married57.1% Now married0.0% Separated0.0% Widowed0.0% DivorcedFemales 31.0% Never married51.7% Now married0.0% Separated17.2% Widowed0.0% DivorcedWomen who did not give birth in the past 12 months Now married:
25.0% (4)Unmarried:
75.0% (12)
Marital status - Two or more races population 15 years and over
Males 26.1% Never married72.6% Now married0.0% Separated0.0% Widowed1.3% DivorcedFemales 15.1% Never married67.6% Now married0.0% Separated12.9% Widowed4.3% DivorcedWomen who gave birth in the past 12 months Now married:
0.0% (0)Unmarried:
100.0% (10)
Women who did not give birth in the past 12 months Now married:
61.1% (30)Unmarried:
38.9% (19)
Marital status - White alone, not Hispanic / Latino population 15 years and over
Males 30.2% Never married61.9% Now married0.9% Separated1.6% Widowed5.4% DivorcedFemales 25.7% Never married64.4% Now married1.0% Separated4.7% Widowed4.1% DivorcedWomen who gave birth in the past 12 months Now married:
100.0% (155)Unmarried:
0.0% (0)
Women who did not give birth in the past 12 months Now married:
48.2% (642)Unmarried:
51.8% (689)
Marital status - Hispanic or Latino population 15 years and over
Males 30.0% Never married63.9% Now married0.0% Separated0.0% Widowed6.1% DivorcedFemales 10.1% Never married71.7% Now married0.0% Separated11.8% Widowed6.4% DivorcedWomen who did not give birth in the past 12 months Now married:
69.8% (118)Unmarried:
30.2% (51)
Ancestries in White Meadow Lake
855 23.4% Italian395 10.8% English215 5.9% Irish173 4.7% Polish159 4.4% European144 3.9% Russian131 3.6% Swedish123 3.4% German109 3.0% American98 2.7% Scottish59 1.6% Eastern European56 1.5% Jamaican49 1.3% Portuguese34 0.9% Iranian33 0.9% Israeli33 0.9% Ukrainian32 0.9% West Indian28 0.8% Slovak22 0.6% Romanian19 0.5% Norwegian18 0.5% Czech13 0.4% Slavic12 0.3% Armenian10 0.3% Hungarian9 0.2% Pennsylvania German7 0.2% Austrian7 0.2% British7 0.2% Dutch7 0.2% Lithuanian6 0.2% French Canadian6 0.2% Northern European5 0.1% Greek5 0.1% Latvian
Children Nativity (place of birth) in White Meadow Lake
Children under 6 years - Living with two parents Both parents native 527 100.0% NativeBoth parents foreign-born 16 100.0% NativeOne native, one foreign-born parent 63 100.0% NativeChildren under 6 years - Living with one parent Native parent 33 100.0% NativeForeign-born parent 19 48.0% Native20 52.0% Foreign-bornChildren 6 to 17 years - Living with two parents Both parents native 1,248 99.6% Native5 0.4% Foreign-bornBoth parents foreign-born 99 100.0% NativeOne native, one foreign-born parent 207 96.7% Native7 3.3% Foreign-bornChildren 6 to 17 years - Living with one parent Native parent 61 100.0% NativeForeign-born parent 28 50.3% Native28 49.7% Foreign-born
Grandparents responsible for own grandchildren in White Meadow Lake
Grandparents (30 to 59 years) White / Caucasian 28 35.9% Responsible for grandchildren51 64.1% Not responsible for grandchildrenWhite alone, not Hispanic / Latino 28 33.2% Responsible for grandchildren57 66.8% Not responsible for grandchildren
Grandparents (60 years and over) White / Caucasian 136 100.0% Not responsible for grandchildrenWhite alone, not Hispanic / Latino 151 100.0% Not responsible for grandchildren