Races in Weymouth, Massachusetts (MA) Detailed Stats
Ancestries, Foreign-born residents, place of birth

Recent posts about races in Weymouth, Massachusetts on our local forum with over 2,400,000 registered users:

Latest news about races in Weymouth, MA collected exclusively by city-data.com from local newspapers, TV, and radio stations
5.4% of Weymouth, MA residents are foreign-born (2.1% born in Europe, 1.2% born in Latin America, 0.9% born in Asia, 0.6% born in North America, 0.6% born in Africa), which is 233.6% less than the foreign-born rate of 18.0% across the entire state of Massachusetts.
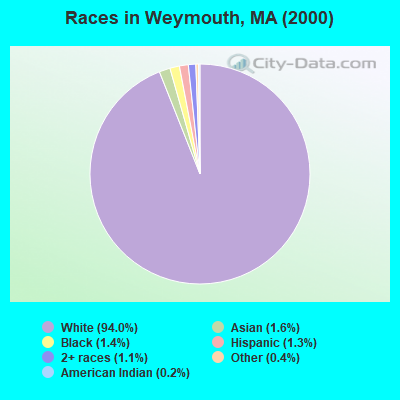
Race distribution in Weymouth

- 50,75894.0%White alone
- 8371.6%Asian alone
- 7591.4%Black alone
- 7211.3%Hispanic
- 5881.1%Two or more races
- 2060.4%Other race alone
- 960.2%American Indian alone
- 230.04%Native Hawaiian and Other
Pacific Islander alone
2000
2022
-
- 5,198,35981.9%White alone
- 428,7296.8%Hispanic
- 318,3295.0%Black alone
- 236,7863.7%Asian alone
- 110,3381.7%Two or more races
- 43,5860.7%Other race alone
- 11,2640.2%American Indian alone
- 1,7060.03%Native Hawaiian and Other
Pacific Islander alone

-
- 4,676,62767.0%White alone
- 911,03813.0%Hispanic
- 501,4637.2%Asian alone
- 459,7406.6%Black alone
- 341,8894.9%Two or more races
- 84,4031.2%Other race alone
- 5,8380.08%American Indian alone
- 9760.01%Native Hawaiian and Other
Pacific Islander alone

Income and house value in Weymouth
- Median household income in 2022
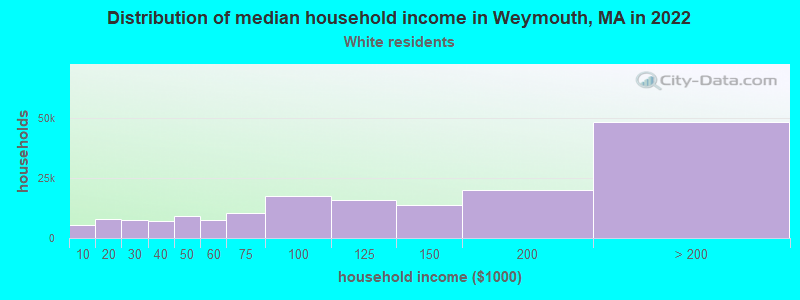
- $96,193White non-Hispanic householders
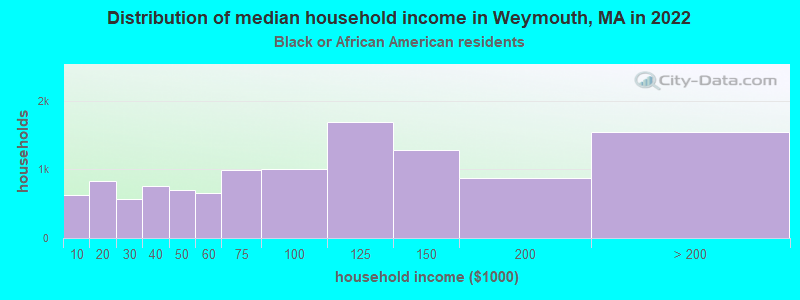
- $63,112Black householders
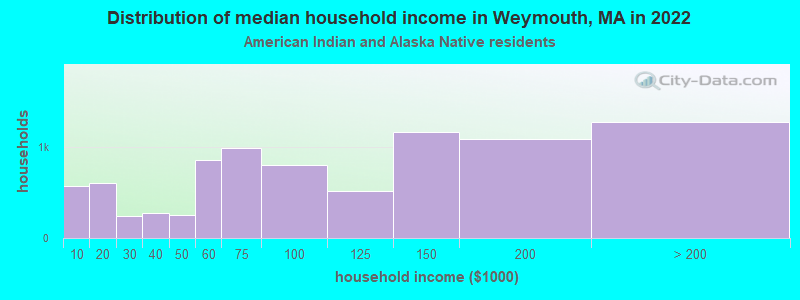
- $104,877American Indian and Alaska Native householders
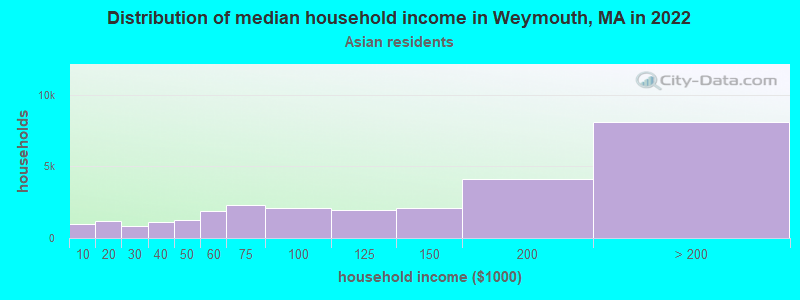
- $116,415Asian householders
- $77,126Some other race householders
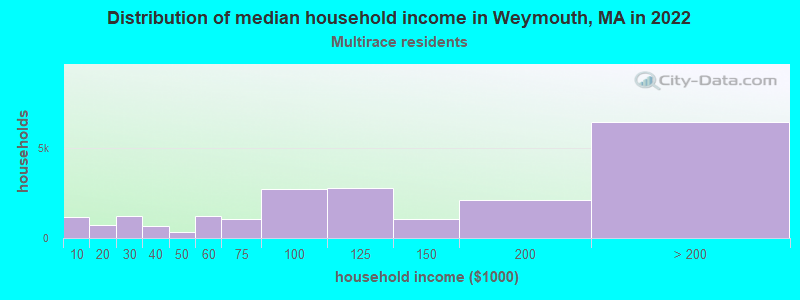
- $173,810Two or more races householders
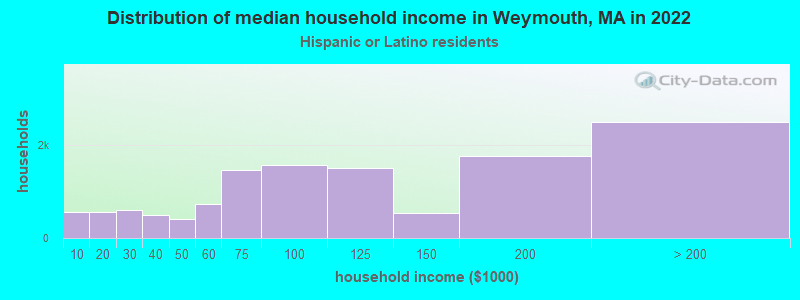
- $100,846Hispanic or Latino race householders
- Median 2022 house value
- $524,360White Non-Hispanic householders
- $484,732Black or African American householders
- $495,931American Indian or Alaska Native householders
- $528,955Asian householders
- $978,079Some other race householders
- $498,228Two or more races householders
- $651,861Hispanic or Latino householders
Household income for White non-Hispanic householders
Household income for Black householders
Household income for American Indian and Alaska Native householders
Household income for Asian householders
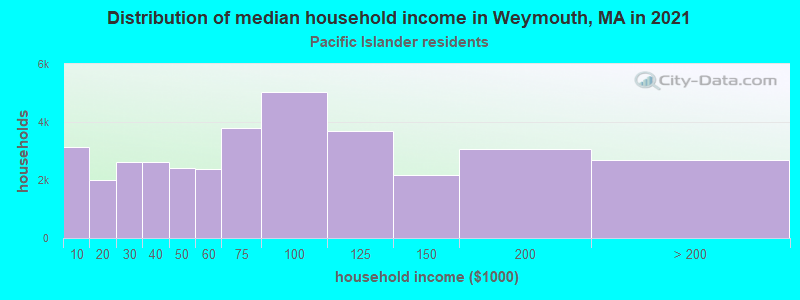
Household income for Native Hawaiian and other Pacific Islander householders
Household income for Two or more races householders
Household income for Hispanic or Latino race householders
Foreign-born residents in Weymouth
2,913 residents are foreign born (2.1% Europe, 1.2% Latin America, 0.9% Asia, 0.6% North America, 0.6% Africa).
| This city: | 5.4% |
| Massachusetts: | 12.2% |
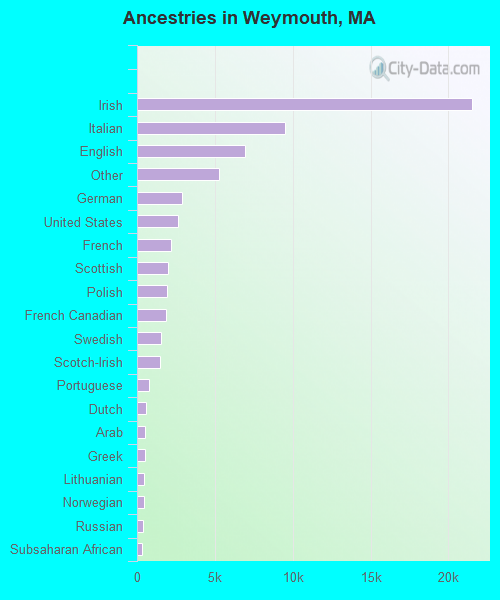
Ancestries in Weymouth

- 21,53133.3%Irish
- 9,53714.7%Italian
- 6,95710.8%English
- 5,2358.1%Other
- 2,8674.4%German
- 2,6364.1%United States
- 2,2033.4%French
- 2,0143.1%Scottish
- 1,9193.0%Polish
- 1,8662.9%French Canadian
- 1,5722.4%Swedish
- 1,4862.3%Scotch-Irish
- 7671.2%Portuguese
- 5560.9%Dutch
- 5430.8%Arab
- 5320.8%Greek
- 4650.7%Lithuanian
- 4600.7%Norwegian
- 3720.6%Russian
- 3100.5%Subsaharan African
- 1800.3%Welsh
- 1800.3%West Indian
- 1440.2%Danish
- 1320.2%Czech
- 770.1%Hungarian
- 660.1%Swiss
- 530.08%Ukrainian
- 230.04%Slovak
Zip codes: 02188.