Races in Westport, Wisconsin (WI) Detailed Stats
Ancestries, Foreign-born residents, place of birth

Recent posts about races in Westport, Wisconsin on our local forum with over 2,400,000 registered users:
 | Would I like the Milwaukee area? (17 replies) |
1.4% of Westport, WI residents are foreign-born , which is 258.6% less than the foreign-born rate of 5.0% across the entire state of Wisconsin.
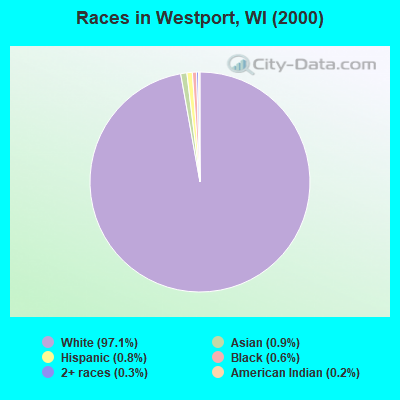
Race distribution in Westport

- 3,48397.1%White alone
- 310.9%Asian alone
- 280.8%Hispanic
- 220.6%Black alone
- 110.3%Two or more races
- 60.2%American Indian alone
- 30.08%Native Hawaiian and Other
Pacific Islander alone - 20.06%Other race alone
2000
2022
-
- 4,681,63087.3%White alone
- 300,2455.6%Black alone
- 192,9213.6%Hispanic
- 87,9951.6%Asian alone
- 51,9211.0%Two or more races
- 43,9800.8%American Indian alone
- 3,6370.07%Other race alone
- 1,3460.03%Native Hawaiian and Other
Pacific Islander alone

-
- 4,654,03179.0%White alone
- 447,0227.6%Hispanic
- 345,6785.9%Black alone
- 217,5323.7%Two or more races
- 172,2422.9%Asian alone
- 33,7620.6%American Indian alone
- 19,6800.3%Other race alone
- 2,5920.04%Native Hawaiian and Other
Pacific Islander alone

Income and house value in Westport
- Median household income in 2022
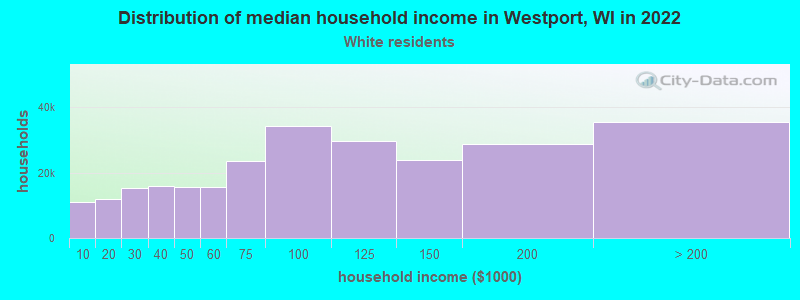
- $108,945White non-Hispanic householders
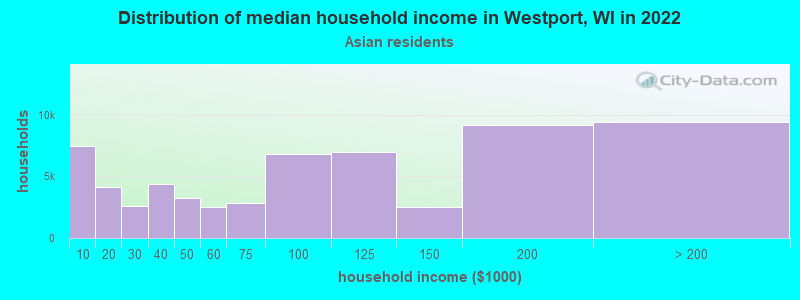
- over $200,000Asian householders
- over $200,000Some other race householders
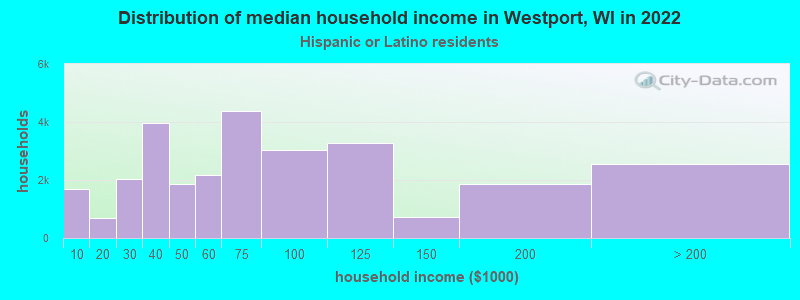
- $149,181Hispanic or Latino race householders
- Median 2022 house value
- $501,396White Non-Hispanic householders
- $477,702Asian householders
- $350,315Some other race householders
- $350,315Hispanic or Latino householders
Household income for White non-Hispanic householders
Household income for Asian householders
Household income for Hispanic or Latino race householders
Foreign-born residents in Westport
50 residents are foreign born
| This city: | 1.4% |
| Wisconsin: | 3.6% |
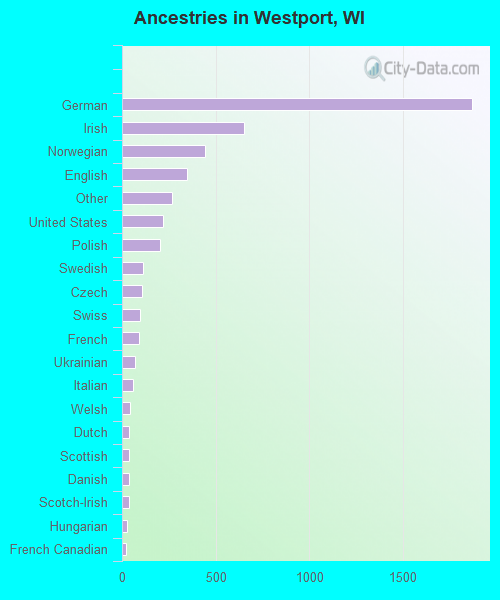
Ancestries in Westport

- 1,86938.9%German
- 65113.6%Irish
- 4439.2%Norwegian
- 3487.2%English
- 2685.6%Other
- 2184.5%United States
- 2014.2%Polish
- 1132.4%Swedish
- 1072.2%Czech
- 942.0%Swiss
- 891.9%French
- 671.4%Ukrainian
- 601.2%Italian
- 450.9%Welsh
- 390.8%Dutch
- 390.8%Scottish
- 380.8%Danish
- 350.7%Scotch-Irish
- 260.5%Hungarian
- 230.5%French Canadian
- 160.3%Russian
- 110.2%Subsaharan African
Zip codes: 53597.