Races in Westport, Connecticut (CT) Detailed Stats
Data:
Races - White alone (%)
Races - White alone (% change since 2000)
Races - Black alone (%)
Races - Black alone (% change since 2000)
Races - American Indian alone (%)
Races - American Indian alone (% change since 2000)
Races - Asian alone (%)
Races - Asian alone (% change since 2000)
Races - Hispanic (%)
Races - Hispanic (% change since 2000)
Races - Native Hawaiian and Other Pacific Islander alone (%)
Races - Native Hawaiian and Other Pacific Islander alone (% change since 2000)
Races - Two or more races(%)
Races - Two or more races(% change since 2000)
Races - Other race alone (%)
Races - Other race alone (% change since 2000)
Racial diversity
Place of birth - Born in state of residence (%)
Place of birth - Born in state of residence (%) - White
Place of birth - Born in state of residence (%) - Black or African American
Place of birth - Born in state of residence (%) - Asian
Place of birth - Born in state of residence (%) - Hispanic or Latino
Place of birth - Born in state of residence (%) - American Indian and Alaska Native
Place of birth - Born in state of residence (%) - Multirace
Place of birth - Born in state of residence (%) - Other Race
Place of birth - Born in other state (%)
Place of birth - Born in other state (%) - White
Place of birth - Born in other state (%) - Black or African American
Place of birth - Born in other state (%) - Asian
Place of birth - Born in other state (%) - Hispanic or Latino
Place of birth - Born in other state (%) - American Indian and Alaska Native
Place of birth - Born in other state (%) - Multirace
Place of birth - Born in other state (%) - Other Race
Place of birth - Native, outside of US (%)
Place of birth - Native, outside of US (%) - White
Place of birth - Native, outside of US (%) - Black or African American
Place of birth - Native, outside of US (%) - Asian
Place of birth - Native, outside of US (%) - Hispanic or Latino
Place of birth - Native, outside of US (%) - American Indian and Alaska Native
Place of birth - Native, outside of US (%) - Multirace
Place of birth - Native, outside of US (%) - Other Race
Place of birth - Foreign born (%)
Place of birth - Foreign born (%) - White
Place of birth - Foreign born (%) - Black or African American
Place of birth - Foreign born (%) - Asian
Place of birth - Foreign born (%) - Hispanic or Latino
Place of birth - Foreign born (%) - American Indian and Alaska Native
Place of birth - Foreign born (%) - Multirace
Place of birth - Foreign born (%) - Other Race
Residents speaking English at home (%)
Residents speaking English at home - Born in the United States (%)
Residents speaking English at home - Native, born elsewhere (%)
Residents speaking English at home - Foreign born (%)
Residents speaking Spanish at home (%)
Residents speaking Spanish at home - Born in the United States (%)
Residents speaking Spanish at home - Native, born elsewhere (%)
Residents speaking Spanish at home - Foreign born (%)
Residents speaking other language at home (%)
Residents speaking other language at home - Born in the United States (%)
Residents speaking other language at home - Native, born elsewhere (%)
Residents speaking other language at home - Foreign born (%)
Marital status - Never married (%)
Marital status - Now married (%)
Marital status - Separated (%)
Marital status - Widowed (%)
Marital status - Divorced (%)
Ancestries Reported - Arab (%)
Ancestries Reported - Czech (%)
Ancestries Reported - Danish (%)
Ancestries Reported - Dutch (%)
Ancestries Reported - English (%)
Ancestries Reported - French (%)
Ancestries Reported - French Canadian (%)
Ancestries Reported - German (%)
Ancestries Reported - Greek (%)
Ancestries Reported - Hungarian (%)
Ancestries Reported - Irish (%)
Ancestries Reported - Italian (%)
Ancestries Reported - Lithuanian (%)
Ancestries Reported - Norwegian (%)
Ancestries Reported - Polish (%)
Ancestries Reported - Portuguese (%)
Ancestries Reported - Russian (%)
Ancestries Reported - Scotch-Irish (%)
Ancestries Reported - Scottish (%)
Ancestries Reported - Slovak (%)
Ancestries Reported - Subsaharan African (%)
Ancestries Reported - Swedish (%)
Ancestries Reported - Swiss (%)
Ancestries Reported - Ukrainian (%)
Ancestries Reported - United States (%)
Ancestries Reported - Welsh (%)
Ancestries Reported - West Indian (%)
Ancestries Reported - Other (%)
Geographical mobility - Same house 1 year ago (%)
Geographical mobility - Same house 1 year ago (%) - White
Geographical mobility - Same house 1 year ago (%) - Black or African American
Geographical mobility - Same house 1 year ago (%) - Asian
Geographical mobility - Same house 1 year ago (%) - Hispanic or Latino
Geographical mobility - Same house 1 year ago (%) - American Indian and Alaska Native
Geographical mobility - Same house 1 year ago (%) - Multirace
Geographical mobility - Same house 1 year ago (%) - Other Race
Geographical mobility - Moved within same county (%)
Geographical mobility - Moved within same county (%) - White
Geographical mobility - Moved within same county (%) - Black or African American
Geographical mobility - Moved within same county (%) - Asian
Geographical mobility - Moved within same county (%) - Hispanic or Latino
Geographical mobility - Moved within same county (%) - American Indian and Alaska Native
Geographical mobility - Moved within same county (%) - Multirace
Geographical mobility - Moved within same county (%) - Other Race
Geographical mobility - Moved from different county within same state (%)
Geographical mobility - Moved from different county within same state (%) - White
Geographical mobility - Moved from different county within same state (%) - Black or African American
Geographical mobility - Moved from different county within same state (%) - Asian
Geographical mobility - Moved from different county within same state (%) - Hispanic or Latino
Geographical mobility - Moved from different county within same state (%) - American Indian and Alaska Native
Geographical mobility - Moved from different county within same state (%) - Multirace
Geographical mobility - Moved from different county within same state (%) - Other Race
Geographical mobility - Moved from different state (%)
Geographical mobility - Moved from different state (%) - White
Geographical mobility - Moved from different state (%) - Black or African American
Geographical mobility - Moved from different state (%) - Asian
Geographical mobility - Moved from different state (%) - Hispanic or Latino
Geographical mobility - Moved from different state (%) - American Indian and Alaska Native
Geographical mobility - Moved from different state (%) - Multirace
Geographical mobility - Moved from different state (%) - Other Race
Geographical mobility - Moved from abroad (%)
Geographical mobility - Moved from abroad (%) - White
Geographical mobility - Moved from abroad (%) - Black or African American
Geographical mobility - Moved from abroad (%) - Asian
Geographical mobility - Moved from abroad (%) - Hispanic or Latino
Geographical mobility - Moved from abroad (%) - American Indian and Alaska Native
Geographical mobility - Moved from abroad (%) - Multirace
Geographical mobility - Moved from abroad (%) - Other Race
Place of birth for the foreign-born population - Ireland (%)
Place of birth for the foreign-born population - Denmark (%)
Place of birth for the foreign-born population - Norway (%)
Place of birth for the foreign-born population - Sweden (%)
Place of birth for the foreign-born population - United Kingdom (%)
Place of birth for the foreign-born population - England (%)
Place of birth for the foreign-born population - Scotland (%)
Place of birth for the foreign-born population - Other Northern Europe (%)
Place of birth for the foreign-born population - Austria (%)
Place of birth for the foreign-born population - Belgium (%)
Place of birth for the foreign-born population - France (%)
Place of birth for the foreign-born population - Germany (%)
Place of birth for the foreign-born population - Netherlands (%)
Place of birth for the foreign-born population - Switzerland (%)
Place of birth for the foreign-born population - Other Western Europe (%)
Place of birth for the foreign-born population - Greece (%)
Place of birth for the foreign-born population - Italy (%)
Place of birth for the foreign-born population - Portugal (%)
Place of birth for the foreign-born population - Spain (%)
Place of birth for the foreign-born population - Other Southern Europe (%)
Place of birth for the foreign-born population - Albania (%)
Place of birth for the foreign-born population - Belarus (%)
Place of birth for the foreign-born population - Bosnia and Herzegovina (%)
Place of birth for the foreign-born population - Bulgaria (%)
Place of birth for the foreign-born population - Croatia (%)
Place of birth for the foreign-born population - Czechoslovakia (%)
Place of birth for the foreign-born population - Hungary (%)
Place of birth for the foreign-born population - Latvia (%)
Place of birth for the foreign-born population - Lithuania (%)
Place of birth for the foreign-born population - North Macedonia (Macedonia) (%)
Place of birth for the foreign-born population - Moldova (%)
Place of birth for the foreign-born population - Poland (%)
Place of birth for the foreign-born population - Romania (%)
Place of birth for the foreign-born population - Russia (%)
Place of birth for the foreign-born population - Serbia (%)
Place of birth for the foreign-born population - Ukraine (%)
Place of birth for the foreign-born population - Other Eastern Europe (%)
Place of birth for the foreign-born population - China (%)
Place of birth for the foreign-born population - Hong Kong (%)
Place of birth for the foreign-born population - Taiwan (%)
Place of birth for the foreign-born population - Japan (%)
Place of birth for the foreign-born population - Korea (%)
Place of birth for the foreign-born population - Other Eastern Asia (%)
Place of birth for the foreign-born population - Afghanistan (%)
Place of birth for the foreign-born population - Bangladesh (%)
Place of birth for the foreign-born population - India (%)
Place of birth for the foreign-born population - Iran (%)
Place of birth for the foreign-born population - Kazakhstan (%)
Place of birth for the foreign-born population - Nepal (%)
Place of birth for the foreign-born population - Pakistan (%)
Place of birth for the foreign-born population - Sri Lanka (%)
Place of birth for the foreign-born population - Uzbekistan (%)
Place of birth for the foreign-born population - Other South Central Asia (%)
Place of birth for the foreign-born population - Burma (%)
Place of birth for the foreign-born population - Cambodia (%)
Place of birth for the foreign-born population - Indonesia (%)
Place of birth for the foreign-born population - Laos (%)
Place of birth for the foreign-born population - Malaysia (%)
Place of birth for the foreign-born population - Philippines (%)
Place of birth for the foreign-born population - Singapore (%)
Place of birth for the foreign-born population - Thailand (%)
Place of birth for the foreign-born population - Vietnam (%)
Place of birth for the foreign-born population - Other South Eastern Asia (%)
Place of birth for the foreign-born population - Armenia (%)
Place of birth for the foreign-born population - Iraq (%)
Place of birth for the foreign-born population - Israel (%)
Place of birth for the foreign-born population - Jordan (%)
Place of birth for the foreign-born population - Kuwait (%)
Place of birth for the foreign-born population - Lebanon (%)
Place of birth for the foreign-born population - Saudi Arabia (%)
Place of birth for the foreign-born population - Syria (%)
Place of birth for the foreign-born population - Turkey (%)
Place of birth for the foreign-born population - Yemen (%)
Place of birth for the foreign-born population - Other Western Asia (%)
Place of birth for the foreign-born population - Eritrea (%)
Place of birth for the foreign-born population - Ethiopia (%)
Place of birth for the foreign-born population - Kenya (%)
Place of birth for the foreign-born population - Somalia (%)
Place of birth for the foreign-born population - Uganda (%)
Place of birth for the foreign-born population - Zimbabwe (%)
Place of birth for the foreign-born population - Other Eastern Africa (%)
Place of birth for the foreign-born population - Cameroon (%)
Place of birth for the foreign-born population - Congo (%)
Place of birth for the foreign-born population - Democratic Republic of Congo (Zaire) (%)
Place of birth for the foreign-born population - Other Middle Africa (%)
Place of birth for the foreign-born population - Egypt (%)
Place of birth for the foreign-born population - Morocco (%)
Place of birth for the foreign-born population - Sudan (%)
Place of birth for the foreign-born population - Other Northern Africa (%)
Place of birth for the foreign-born population - South Africa (%)
Place of birth for the foreign-born population - Other Southern Africa (%)
Place of birth for the foreign-born population - Cabo Verde (%)
Place of birth for the foreign-born population - Ghana (%)
Place of birth for the foreign-born population - Liberia (%)
Place of birth for the foreign-born population - Nigeria (%)
Place of birth for the foreign-born population - Senegal (%)
Place of birth for the foreign-born population - Sierra Leone (%)
Place of birth for the foreign-born population - Other Western Africa (%)
Place of birth for the foreign-born population - Australia (%)
Place of birth for the foreign-born population - New Zealand (%)
Place of birth for the foreign-born population - Fiji (%)
Place of birth for the foreign-born population - Micronesia (%)
Place of birth for the foreign-born population - Bahamas (%)
Place of birth for the foreign-born population - Barbados (%)
Place of birth for the foreign-born population - Cuba (%)
Place of birth for the foreign-born population - Dominica (%)
Place of birth for the foreign-born population - Dominican Republic (%)
Place of birth for the foreign-born population - Grenada (%)
Place of birth for the foreign-born population - Haiti (%)
Place of birth for the foreign-born population - Jamaica (%)
Place of birth for the foreign-born population - St. Vincent and the Grenadines (%)
Place of birth for the foreign-born population - Trinidad and Tobago (%)
Place of birth for the foreign-born population - West Indies (%)
Place of birth for the foreign-born population - Other Caribbean (%)
Place of birth for the foreign-born population - Belize (%)
Place of birth for the foreign-born population - Costa Rica (%)
Place of birth for the foreign-born population - El Salvador (%)
Place of birth for the foreign-born population - Guatemala (%)
Place of birth for the foreign-born population - Honduras (%)
Place of birth for the foreign-born population - Mexico (%)
Place of birth for the foreign-born population - Nicaragua (%)
Place of birth for the foreign-born population - Panama (%)
Place of birth for the foreign-born population - Other Central America (%)
Place of birth for the foreign-born population - Argentina (%)
Place of birth for the foreign-born population - Bolivia (%)
Place of birth for the foreign-born population - Brazil (%)
Place of birth for the foreign-born population - Chile (%)
Place of birth for the foreign-born population - Colombia (%)
Place of birth for the foreign-born population - Ecuador (%)
Place of birth for the foreign-born population - Guyana (%)
Place of birth for the foreign-born population - Peru (%)
Place of birth for the foreign-born population - Uruguay (%)
Place of birth for the foreign-born population - Venezuela (%)
Place of birth for the foreign-born population - Other South America (%)
Place of birth for the foreign-born population - Canada (%)
Place of birth for the foreign-born population - Other Northern America (%)
Place of birth for the foreign-born population - Other (%)
Latest news about races in Westport, CT collected exclusively by city-data.com from local newspapers, TV, and radio stations
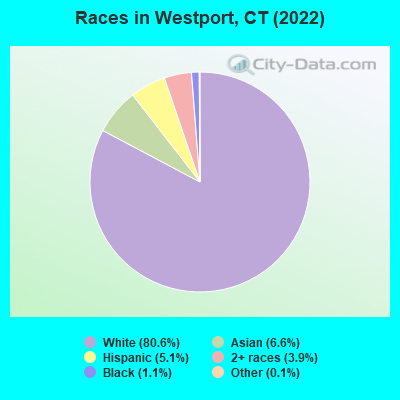
According to 2022 data, the most numerous races in Westport, CT are White alone (22,742 residents), Hispanic (1,433 residents), and Black alone (297 residents). 86.0% of Westport residents speak English at home. 13.9% of Westport, CT residents are foreign-born (6.6% born in Europe, 4.0% born in Asia, 1.7% born in Latin America), which is 7.8% less than the foreign-born rate of 15.0% across the entire state of Connecticut.
Race distribution in Westport
2000 2022
2,638,845 77.5% White alone 320,323 9.4% Hispanic 295,571 8.7% Black alone 81,564 2.4% Asian alone 52,896 1.6% Two or more races 8,141 0.2% Other race alone 7,267 0.2% American Indian alone 958 0.03% Native Hawaiian and Other
2,246,913 62.0% White alone 658,978 18.2% Hispanic 353,973 9.8% Black alone 172,929 4.8% Asian alone 159,631 4.4% Two or more races 29,761 0.8% Other race alone 3,428 0.09% American Indian alone 592 0.02% Native Hawaiian and Other
Income and house value in Westport Median household income in 2022 over $200,000 White non-Hispanic householders$76,088 Black householders$63,015 American Indian and Alaska Native householdersover $200,000 Asian householders$80,133 Some other race householdersover $200,000 Two or more races householdersover $200,000 Hispanic or Latino race householdersMedian 2022 house value over $1,000,000 White Non-Hispanic householdersover $1,000,000 Black or African American householders$405,354 American Indian or Alaska Native householders over $1,000,000 Asian householders$756,662 Some other race householders$774,606 Two or more races householdersover $1,000,000 Hispanic or Latino householders
Median age by race in Westport
48.4 Median age for White residents48.0 48.7 34.9 Median age for Black or African American residents18.4 41.3 16.4 Median age for American Indian / Alaska Native residents43.8 Median age for Asian residents38.9 45.5 51.7 Median age for Other race residents16.3 Median age for Two or more races residents12.6 21.7 48.7 Median age for White alone residents48.5 48.8 26.4 Median age for Hispanic or Latino residents24.7 27.0
Owner/renter occupied households by race in Westport
House owners and renters - White residents 7,559 86.1% Owner occupied1,215 13.9% Renter occupiedHouse owners and renters - Black or African American residents 25 27.6% Owner occupied65 72.4% Renter occupiedHouse owners and renters - Asian residents 484 85.1% Owner occupied85 14.9% Renter occupiedHouse owners and renters - Other race residents 18 63.9% Owner occupied10 36.1% Renter occupiedHouse owners and renters - Two or more races residents 277 69.9% Owner occupied120 30.1% Renter occupiedHouse owners and renters - White alone residents 7,505 86.1% Owner occupied1,216 13.9% Renter occupiedHouse owners and renters - Hispanic or Latino residents 198 56.0% Owner occupied155 44.0% Renter occupied
Language usage in Westport
English speakers - Total 86.0% of residents of Westport speak English at home.
3.4% of residents speak Spanish at home 821 89.3% Speak English very well98 10.7% Speak English less than very well10.4% of residents speak other language at home 2,164 77.3% Speak English very well637 22.7% Speak English less than very well
English speakers - Born in the United States 93.1% of residents of Westport speak English at home.
2.9% of residents speak Spanish at home 433 99.5% Speak English very well2 0.5% Speak English less than very well3.6% of residents speak other language at home 497 91.4% Speak English very well47 8.6% Speak English less than very well
English speakers - Native, born elsewhere 61.9% of residents of Westport speak English at home.
21.1% of residents speak Spanish at home 136 90.1% Speak English very well15 9.9% Speak English less than very well23.9% of residents speak other language at home 117 68.4% Speak English very well54 31.6% Speak English less than very well
English speakers - Foreign-born 52.9% of residents of Westport speak English at home.
6.5% of residents speak Spanish at home 178 68.5% Speak English very well82 31.5% Speak English less than very well41.4% of residents speak other language at home 1,188 71.7% Speak English very well470 28.3% Speak English less than very well
White (Caucasian) - Speak only English Native:
95.0% (18,766)Foreign-born:
71.2% (1,607)
White (Caucasian) - Speak another language Native:
5.5% (1,076)Foreign-born:
37.6% (848)
Black or African American - Speak only English Native:
94.5% (166)Foreign-born:
50.8% (59)
Black or African American - Speak another language Native:
6.2% (11)Foreign-born:
47.8% (55)
Asian - Speak only English Native:
74.6% (485)Foreign-born:
34.9% (349)
Asian - Speak another language Native:
29.1% (189)Foreign-born:
69.2% (693)
Other race - Speak only English Native:
90.4% (35)Foreign-born:
6.5% (2)
Other race - Speak another language Native:
29.7% (11)Foreign-born:
91.7% (33)
Two or more races - Speak only English Native:
75.6% (1,210)Foreign-born:
33.4% (127)
Two or more races - Speak another language Native:
18.0% (289)Foreign-born:
55.1% (210)
White alone - Speak only English Native:
95.3% (18,541)Foreign-born:
62.5% (1,510)
White alone - Speak another language Native:
4.7% (913)Foreign-born:
36.1% (872)
Hispanic or Latino - Speak only English Native:
54.2% (533)Foreign-born:
37.2% (145)
Hispanic or Latino - Speak another language Native:
49.2% (483)Foreign-born:
68.6% (268)
Foreign-born residents in Westport 3,936 residents are foreign born (6.6% Europe , 4.0% Asia , 1.7% Latin America ).
This city:
13.9%Connecticut:
100.0%
Marital status for residents in Westport Marital status - White (Caucasian) population 15 years and over
Males 23.8% Never married67.3% Now married0.4% Separated1.7% Widowed6.8% DivorcedFemales 22.1% Never married60.4% Now married0.3% Separated10.0% Widowed7.1% DivorcedWomen who gave birth in the past 12 months Now married:
87.7% (148)Unmarried:
12.3% (21)
Women who did not give birth in the past 12 months Now married:
53.4% (2,082)Unmarried:
46.6% (1,819)
Marital status - Black or African American population 15 years and over
Males 63.4% Never married31.2% Now married0.0% Separated0.0% Widowed5.4% DivorcedFemales 54.2% Never married16.1% Now married16.8% Separated0.0% Widowed12.9% DivorcedWomen who did not give birth in the past 12 months Now married:
38.6% (41)Unmarried:
61.4% (65)
Marital status - American Indian / Alaska Native population 15 years and over
Males 100.0% Never married0.0% Now married0.0% Separated0.0% Widowed0.0% DivorcedFemales 52.6% Never married47.4% Now married0.0% Separated0.0% Widowed0.0% DivorcedWomen who did not give birth in the past 12 months Now married:
47.4% (10)Unmarried:
52.6% (11)
Marital status - Asian population 15 years and over
Males 19.7% Never married73.0% Now married0.0% Separated0.0% Widowed7.3% DivorcedFemales 13.8% Never married77.4% Now married5.1% Separated0.9% Widowed2.8% DivorcedWomen who gave birth in the past 12 months Now married:
100.0% (45)Unmarried:
0.0% (0)
Women who did not give birth in the past 12 months Now married:
81.6% (380)Unmarried:
18.4% (86)
Marital status - Other race population 15 years and over
Males 45.8% Never married45.8% Now married0.0% Separated0.0% Widowed8.3% DivorcedFemales 40.9% Never married59.1% Now married0.0% Separated0.0% Widowed0.0% DivorcedWomen who did not give birth in the past 12 months Now married:
0.0% (0)Unmarried:
100.0% (13)
Marital status - Two or more races population 15 years and over
Males 14.5% Never married67.9% Now married0.0% Separated0.0% Widowed17.6% DivorcedFemales 27.0% Never married64.4% Now married0.0% Separated0.0% Widowed8.6% DivorcedWomen who did not give birth in the past 12 months Now married:
60.9% (188)Unmarried:
39.1% (120)
Marital status - White alone, not Hispanic / Latino population 15 years and over
Males 22.8% Never married68.0% Now married0.4% Separated1.8% Widowed7.0% DivorcedFemales 20.3% Never married61.7% Now married0.4% Separated10.3% Widowed7.4% DivorcedWomen who gave birth in the past 12 months Now married:
87.7% (157)Unmarried:
12.3% (22)
Women who did not give birth in the past 12 months Now married:
55.4% (2,112)Unmarried:
44.6% (1,701)
Marital status - Hispanic or Latino population 15 years and over
Males 49.7% Never married43.7% Now married0.0% Separated0.0% Widowed6.5% DivorcedFemales 57.3% Never married36.8% Now married0.0% Separated4.1% Widowed1.7% DivorcedWomen who did not give birth in the past 12 months Now married:
29.1% (128)Unmarried:
70.9% (310)
Ancestries in Westport
1,230 10.0% Italian1,187 9.6% Eastern European926 7.5% English924 7.5% Irish910 7.4% American566 4.6% European442 3.6% British415 3.4% German398 3.2% Russian285 2.3% Polish207 1.7% Greek162 1.3% Scottish115 0.9% Dutch114 0.9% Haitian105 0.9% Hungarian80 0.6% Scotch-Irish73 0.6% French62 0.5% Romanian61 0.5% Swedish59 0.5% Lebanese59 0.5% Armenian54 0.4% Canadian50 0.4% French Canadian49 0.4% Ukrainian48 0.4% Norwegian44 0.4% Danish37 0.3% Arab35 0.3% Lithuanian34 0.3% Austrian32 0.3% Portuguese29 0.2% Czech28 0.2% Australian28 0.2% Egyptian26 0.2% Macedonian26 0.2% Cajun24 0.2% Latvian23 0.2% Belgian23 0.2% Jamaican21 0.2% Israeli21 0.2% Welsh20 0.2% Slovak20 0.2% Brazilian19 0.2% Palestinian17 0.1% Northern European14 0.1% Serbian13 0.1% Moroccan13 0.1% Iranian13 0.1% Croatian13 0.1% Turkish11 0.09% Celtic11 0.09% South African7 0.06% West Indian6 0.05% Finnish
Geographical mobility in Westport Same house 1 year ago 20,758 90.7% White (Caucasian)286 90.2% Black or African American22 89.8% American Indian / Alaska Native1,461 82.9% Asian48 65.1% Other race1,855 91.9% Two or more races20,973 90.6% White alone, not Hispanic / Latino1,332 97.4% Hispanic or LatinoMoved within same county 1,115 4.9% White / Caucasian15 4.8% Black or African American91 5.2% Asian77 3.8% Two or more races1,125 4.9% White alone, not Hispanic / Latino30 2.2% Hispanic or LatinoMoved within same state 19 0.1% White / Caucasian11 3.4% Black or African American17 0.1% White alone, not Hispanic / Latino1 0.1% Hispanic or LatinoMoved from different state 874 3.8% White / Caucasian146 8.3% Asian28 38.7% Other race137 6.8% Two or more races966 4.2% White alone, not Hispanic / Latino11 0.8% Hispanic or LatinoMoved from abroad 147 0.6% White46 2.6% Asian151 0.7% White alone, not Hispanic / Latino16 1.2% Hispanic or Latino
Children Nativity (place of birth) in Westport
Children under 6 years - Living with two parents Both parents native 1,245 100.0% NativeBoth parents foreign-born 192 96.3% Native7 3.7% Foreign-bornOne native, one foreign-born parent 102 100.0% NativeChildren under 6 years - Living with one parent Native parent 51 100.0% NativeForeign-born parent 32 100.0% NativeChildren 6 to 17 years - Living with two parents Both parents native 3,068 98.4% Native49 1.6% Foreign-bornBoth parents foreign-born 398 57.1% Native299 42.9% Foreign-bornOne native, one foreign-born parent 1,085 98.7% Native15 1.3% Foreign-bornChildren 6 to 17 years - Living with one parent Native parent 505 100.0% NativeForeign-born parent 145 55.0% Native118 45.0% Foreign-born
Grandparents responsible for own grandchildren in Westport
Grandparents (30 to 59 years) White / Caucasian 10 70.7% Responsible for grandchildren4 29.3% Not responsible for grandchildrenAsian 11 100.0% Not responsible for grandchildrenWhite alone, not Hispanic / Latino 6 65.4% Responsible for grandchildren3 34.6% Not responsible for grandchildrenGrandparents (60 years and over) White / Caucasian 23 16.6% Responsible for grandchildren115 83.4% Not responsible for grandchildrenAsian 22 100.0% Not responsible for grandchildrenWhite alone, not Hispanic / Latino 28 21.9% Responsible for grandchildren100 78.1% Not responsible for grandchildren