Races in Weston, Florida (FL) Detailed Stats
Data:
Races - White alone (%)
Races - White alone (% change since 2000)
Races - Black alone (%)
Races - Black alone (% change since 2000)
Races - American Indian alone (%)
Races - American Indian alone (% change since 2000)
Races - Asian alone (%)
Races - Asian alone (% change since 2000)
Races - Hispanic (%)
Races - Hispanic (% change since 2000)
Races - Native Hawaiian and Other Pacific Islander alone (%)
Races - Native Hawaiian and Other Pacific Islander alone (% change since 2000)
Races - Two or more races(%)
Races - Two or more races(% change since 2000)
Races - Other race alone (%)
Races - Other race alone (% change since 2000)
Racial diversity
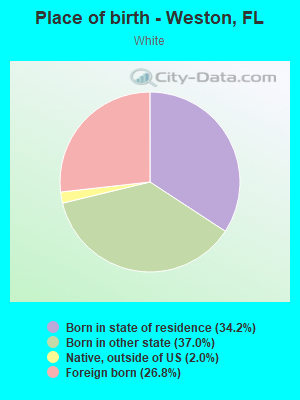
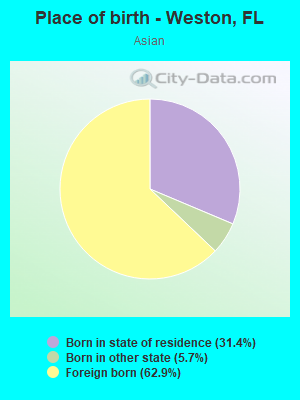
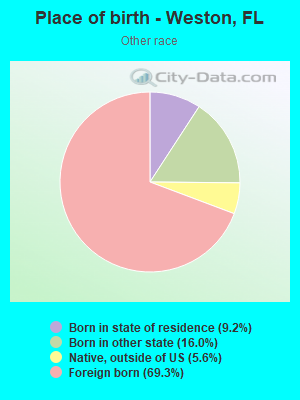
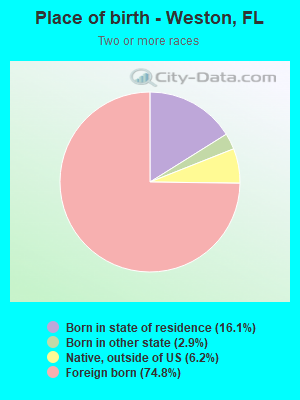
Place of birth - Born in state of residence (%)
Place of birth - Born in state of residence (%) - White
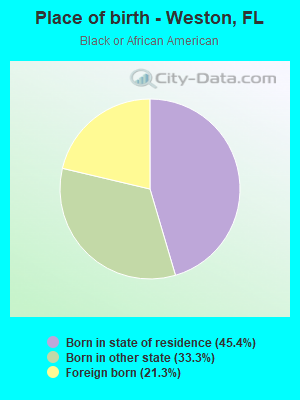
Place of birth - Born in state of residence (%) - Black or African American
Place of birth - Born in state of residence (%) - Asian
Place of birth - Born in state of residence (%) - Hispanic or Latino
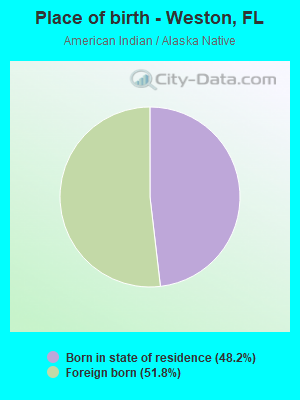
Place of birth - Born in state of residence (%) - American Indian and Alaska Native
Place of birth - Born in state of residence (%) - Multirace
Place of birth - Born in state of residence (%) - Other Race
Place of birth - Born in other state (%)
Place of birth - Born in other state (%) - White
Place of birth - Born in other state (%) - Black or African American
Place of birth - Born in other state (%) - Asian
Place of birth - Born in other state (%) - Hispanic or Latino
Place of birth - Born in other state (%) - American Indian and Alaska Native
Place of birth - Born in other state (%) - Multirace
Place of birth - Born in other state (%) - Other Race
Place of birth - Native, outside of US (%)
Place of birth - Native, outside of US (%) - White
Place of birth - Native, outside of US (%) - Black or African American
Place of birth - Native, outside of US (%) - Asian
Place of birth - Native, outside of US (%) - Hispanic or Latino
Place of birth - Native, outside of US (%) - American Indian and Alaska Native
Place of birth - Native, outside of US (%) - Multirace
Place of birth - Native, outside of US (%) - Other Race
Place of birth - Foreign born (%)
Place of birth - Foreign born (%) - White
Place of birth - Foreign born (%) - Black or African American
Place of birth - Foreign born (%) - Asian
Place of birth - Foreign born (%) - Hispanic or Latino
Place of birth - Foreign born (%) - American Indian and Alaska Native
Place of birth - Foreign born (%) - Multirace
Place of birth - Foreign born (%) - Other Race
Residents speaking English at home (%)
Residents speaking English at home - Born in the United States (%)
Residents speaking English at home - Native, born elsewhere (%)
Residents speaking English at home - Foreign born (%)
Residents speaking Spanish at home (%)
Residents speaking Spanish at home - Born in the United States (%)
Residents speaking Spanish at home - Native, born elsewhere (%)
Residents speaking Spanish at home - Foreign born (%)
Residents speaking other language at home (%)
Residents speaking other language at home - Born in the United States (%)
Residents speaking other language at home - Native, born elsewhere (%)
Residents speaking other language at home - Foreign born (%)
Marital status - Never married (%)
Marital status - Now married (%)
Marital status - Separated (%)
Marital status - Widowed (%)
Marital status - Divorced (%)
Ancestries Reported - Arab (%)
Ancestries Reported - Czech (%)
Ancestries Reported - Danish (%)
Ancestries Reported - Dutch (%)
Ancestries Reported - English (%)
Ancestries Reported - French (%)
Ancestries Reported - French Canadian (%)
Ancestries Reported - German (%)
Ancestries Reported - Greek (%)
Ancestries Reported - Hungarian (%)
Ancestries Reported - Irish (%)
Ancestries Reported - Italian (%)
Ancestries Reported - Lithuanian (%)
Ancestries Reported - Norwegian (%)
Ancestries Reported - Polish (%)
Ancestries Reported - Portuguese (%)
Ancestries Reported - Russian (%)
Ancestries Reported - Scotch-Irish (%)
Ancestries Reported - Scottish (%)
Ancestries Reported - Slovak (%)
Ancestries Reported - Subsaharan African (%)
Ancestries Reported - Swedish (%)
Ancestries Reported - Swiss (%)
Ancestries Reported - Ukrainian (%)
Ancestries Reported - United States (%)
Ancestries Reported - Welsh (%)
Ancestries Reported - West Indian (%)
Ancestries Reported - Other (%)
Geographical mobility - Same house 1 year ago (%)
Geographical mobility - Same house 1 year ago (%) - White
Geographical mobility - Same house 1 year ago (%) - Black or African American
Geographical mobility - Same house 1 year ago (%) - Asian
Geographical mobility - Same house 1 year ago (%) - Hispanic or Latino
Geographical mobility - Same house 1 year ago (%) - American Indian and Alaska Native
Geographical mobility - Same house 1 year ago (%) - Multirace
Geographical mobility - Same house 1 year ago (%) - Other Race
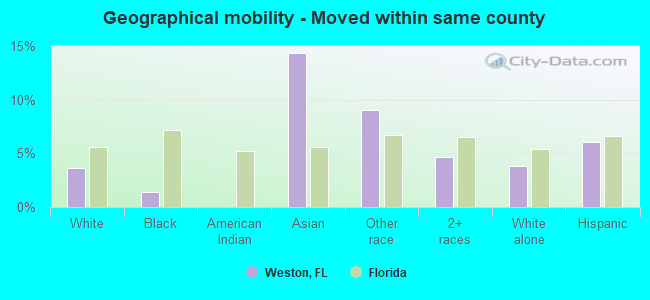
Geographical mobility - Moved within same county (%)
Geographical mobility - Moved within same county (%) - White
Geographical mobility - Moved within same county (%) - Black or African American
Geographical mobility - Moved within same county (%) - Asian
Geographical mobility - Moved within same county (%) - Hispanic or Latino
Geographical mobility - Moved within same county (%) - American Indian and Alaska Native
Geographical mobility - Moved within same county (%) - Multirace
Geographical mobility - Moved within same county (%) - Other Race
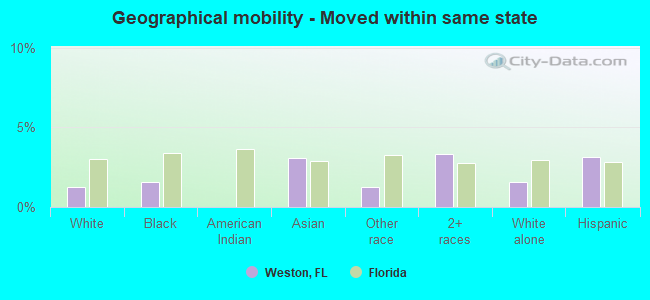
Geographical mobility - Moved from different county within same state (%)
Geographical mobility - Moved from different county within same state (%) - White
Geographical mobility - Moved from different county within same state (%) - Black or African American
Geographical mobility - Moved from different county within same state (%) - Asian
Geographical mobility - Moved from different county within same state (%) - Hispanic or Latino
Geographical mobility - Moved from different county within same state (%) - American Indian and Alaska Native
Geographical mobility - Moved from different county within same state (%) - Multirace
Geographical mobility - Moved from different county within same state (%) - Other Race
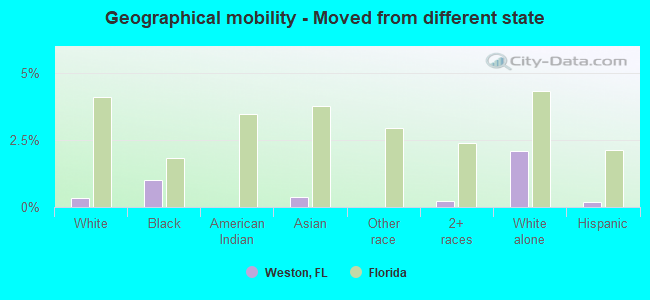
Geographical mobility - Moved from different state (%)
Geographical mobility - Moved from different state (%) - White
Geographical mobility - Moved from different state (%) - Black or African American
Geographical mobility - Moved from different state (%) - Asian
Geographical mobility - Moved from different state (%) - Hispanic or Latino
Geographical mobility - Moved from different state (%) - American Indian and Alaska Native
Geographical mobility - Moved from different state (%) - Multirace
Geographical mobility - Moved from different state (%) - Other Race
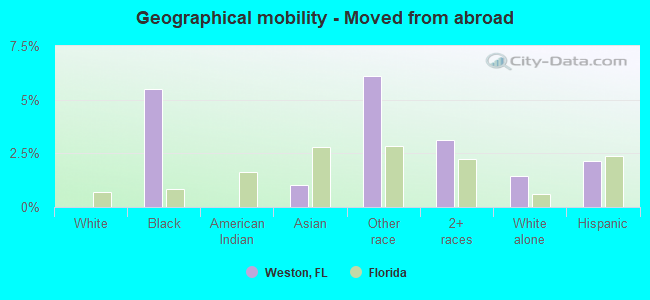
Geographical mobility - Moved from abroad (%)
Geographical mobility - Moved from abroad (%) - White
Geographical mobility - Moved from abroad (%) - Black or African American
Geographical mobility - Moved from abroad (%) - Asian
Geographical mobility - Moved from abroad (%) - Hispanic or Latino
Geographical mobility - Moved from abroad (%) - American Indian and Alaska Native
Geographical mobility - Moved from abroad (%) - Multirace
Geographical mobility - Moved from abroad (%) - Other Race
Place of birth for the foreign-born population - Ireland (%)
Place of birth for the foreign-born population - Denmark (%)
Place of birth for the foreign-born population - Norway (%)
Place of birth for the foreign-born population - Sweden (%)
Place of birth for the foreign-born population - United Kingdom (%)
Place of birth for the foreign-born population - England (%)
Place of birth for the foreign-born population - Scotland (%)
Place of birth for the foreign-born population - Other Northern Europe (%)
Place of birth for the foreign-born population - Austria (%)
Place of birth for the foreign-born population - Belgium (%)
Place of birth for the foreign-born population - France (%)
Place of birth for the foreign-born population - Germany (%)
Place of birth for the foreign-born population - Netherlands (%)
Place of birth for the foreign-born population - Switzerland (%)
Place of birth for the foreign-born population - Other Western Europe (%)
Place of birth for the foreign-born population - Greece (%)
Place of birth for the foreign-born population - Italy (%)
Place of birth for the foreign-born population - Portugal (%)
Place of birth for the foreign-born population - Spain (%)
Place of birth for the foreign-born population - Other Southern Europe (%)
Place of birth for the foreign-born population - Albania (%)
Place of birth for the foreign-born population - Belarus (%)
Place of birth for the foreign-born population - Bosnia and Herzegovina (%)
Place of birth for the foreign-born population - Bulgaria (%)
Place of birth for the foreign-born population - Croatia (%)
Place of birth for the foreign-born population - Czechoslovakia (%)
Place of birth for the foreign-born population - Hungary (%)
Place of birth for the foreign-born population - Latvia (%)
Place of birth for the foreign-born population - Lithuania (%)
Place of birth for the foreign-born population - North Macedonia (Macedonia) (%)
Place of birth for the foreign-born population - Moldova (%)
Place of birth for the foreign-born population - Poland (%)
Place of birth for the foreign-born population - Romania (%)
Place of birth for the foreign-born population - Russia (%)
Place of birth for the foreign-born population - Serbia (%)
Place of birth for the foreign-born population - Ukraine (%)
Place of birth for the foreign-born population - Other Eastern Europe (%)
Place of birth for the foreign-born population - China (%)
Place of birth for the foreign-born population - Hong Kong (%)
Place of birth for the foreign-born population - Taiwan (%)
Place of birth for the foreign-born population - Japan (%)
Place of birth for the foreign-born population - Korea (%)
Place of birth for the foreign-born population - Other Eastern Asia (%)
Place of birth for the foreign-born population - Afghanistan (%)
Place of birth for the foreign-born population - Bangladesh (%)
Place of birth for the foreign-born population - India (%)
Place of birth for the foreign-born population - Iran (%)
Place of birth for the foreign-born population - Kazakhstan (%)
Place of birth for the foreign-born population - Nepal (%)
Place of birth for the foreign-born population - Pakistan (%)
Place of birth for the foreign-born population - Sri Lanka (%)
Place of birth for the foreign-born population - Uzbekistan (%)
Place of birth for the foreign-born population - Other South Central Asia (%)
Place of birth for the foreign-born population - Burma (%)
Place of birth for the foreign-born population - Cambodia (%)
Place of birth for the foreign-born population - Indonesia (%)
Place of birth for the foreign-born population - Laos (%)
Place of birth for the foreign-born population - Malaysia (%)
Place of birth for the foreign-born population - Philippines (%)
Place of birth for the foreign-born population - Singapore (%)
Place of birth for the foreign-born population - Thailand (%)
Place of birth for the foreign-born population - Vietnam (%)
Place of birth for the foreign-born population - Other South Eastern Asia (%)
Place of birth for the foreign-born population - Armenia (%)
Place of birth for the foreign-born population - Iraq (%)
Place of birth for the foreign-born population - Israel (%)
Place of birth for the foreign-born population - Jordan (%)
Place of birth for the foreign-born population - Kuwait (%)
Place of birth for the foreign-born population - Lebanon (%)
Place of birth for the foreign-born population - Saudi Arabia (%)
Place of birth for the foreign-born population - Syria (%)
Place of birth for the foreign-born population - Turkey (%)
Place of birth for the foreign-born population - Yemen (%)
Place of birth for the foreign-born population - Other Western Asia (%)
Place of birth for the foreign-born population - Eritrea (%)
Place of birth for the foreign-born population - Ethiopia (%)
Place of birth for the foreign-born population - Kenya (%)
Place of birth for the foreign-born population - Somalia (%)
Place of birth for the foreign-born population - Uganda (%)
Place of birth for the foreign-born population - Zimbabwe (%)
Place of birth for the foreign-born population - Other Eastern Africa (%)
Place of birth for the foreign-born population - Cameroon (%)
Place of birth for the foreign-born population - Congo (%)
Place of birth for the foreign-born population - Democratic Republic of Congo (Zaire) (%)
Place of birth for the foreign-born population - Other Middle Africa (%)
Place of birth for the foreign-born population - Egypt (%)
Place of birth for the foreign-born population - Morocco (%)
Place of birth for the foreign-born population - Sudan (%)
Place of birth for the foreign-born population - Other Northern Africa (%)
Place of birth for the foreign-born population - South Africa (%)
Place of birth for the foreign-born population - Other Southern Africa (%)
Place of birth for the foreign-born population - Cabo Verde (%)
Place of birth for the foreign-born population - Ghana (%)
Place of birth for the foreign-born population - Liberia (%)
Place of birth for the foreign-born population - Nigeria (%)
Place of birth for the foreign-born population - Senegal (%)
Place of birth for the foreign-born population - Sierra Leone (%)
Place of birth for the foreign-born population - Other Western Africa (%)
Place of birth for the foreign-born population - Australia (%)
Place of birth for the foreign-born population - New Zealand (%)
Place of birth for the foreign-born population - Fiji (%)
Place of birth for the foreign-born population - Micronesia (%)
Place of birth for the foreign-born population - Bahamas (%)
Place of birth for the foreign-born population - Barbados (%)
Place of birth for the foreign-born population - Cuba (%)
Place of birth for the foreign-born population - Dominica (%)
Place of birth for the foreign-born population - Dominican Republic (%)
Place of birth for the foreign-born population - Grenada (%)
Place of birth for the foreign-born population - Haiti (%)
Place of birth for the foreign-born population - Jamaica (%)
Place of birth for the foreign-born population - St. Vincent and the Grenadines (%)
Place of birth for the foreign-born population - Trinidad and Tobago (%)
Place of birth for the foreign-born population - West Indies (%)
Place of birth for the foreign-born population - Other Caribbean (%)
Place of birth for the foreign-born population - Belize (%)
Place of birth for the foreign-born population - Costa Rica (%)
Place of birth for the foreign-born population - El Salvador (%)
Place of birth for the foreign-born population - Guatemala (%)
Place of birth for the foreign-born population - Honduras (%)
Place of birth for the foreign-born population - Mexico (%)
Place of birth for the foreign-born population - Nicaragua (%)
Place of birth for the foreign-born population - Panama (%)
Place of birth for the foreign-born population - Other Central America (%)
Place of birth for the foreign-born population - Argentina (%)
Place of birth for the foreign-born population - Bolivia (%)
Place of birth for the foreign-born population - Brazil (%)
Place of birth for the foreign-born population - Chile (%)
Place of birth for the foreign-born population - Colombia (%)
Place of birth for the foreign-born population - Ecuador (%)
Place of birth for the foreign-born population - Guyana (%)
Place of birth for the foreign-born population - Peru (%)
Place of birth for the foreign-born population - Uruguay (%)
Place of birth for the foreign-born population - Venezuela (%)
Place of birth for the foreign-born population - Other South America (%)
Place of birth for the foreign-born population - Canada (%)
Place of birth for the foreign-born population - Other Northern America (%)
Place of birth for the foreign-born population - Other (%)
Latest news about races in Weston, FL collected exclusively by city-data.com from local newspapers, TV, and radio stations
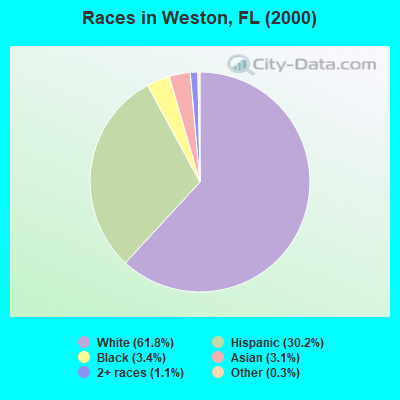
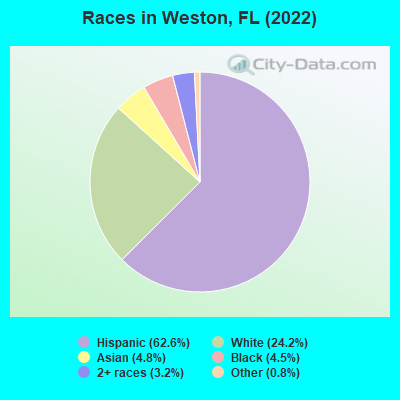
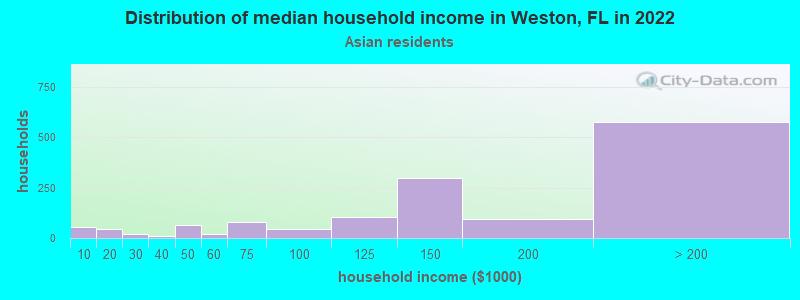
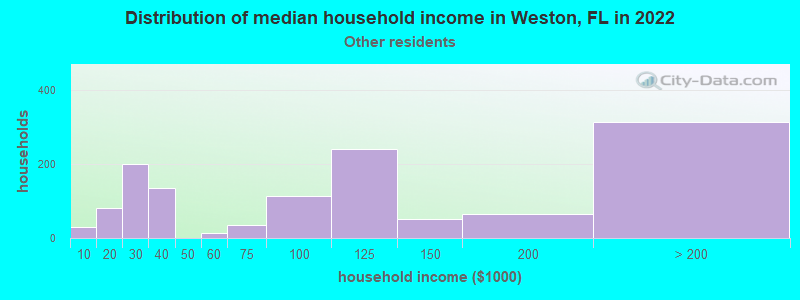
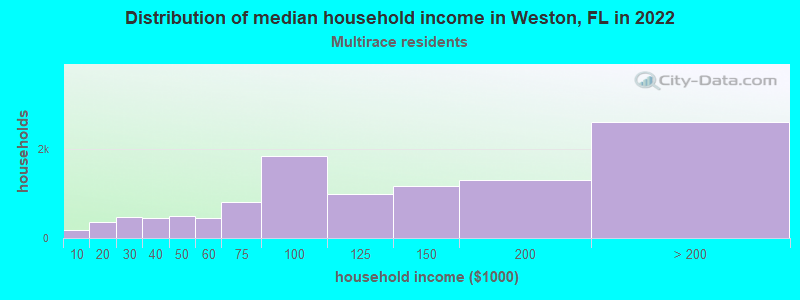
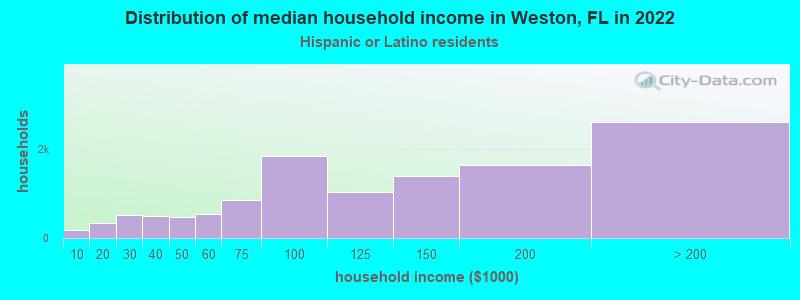
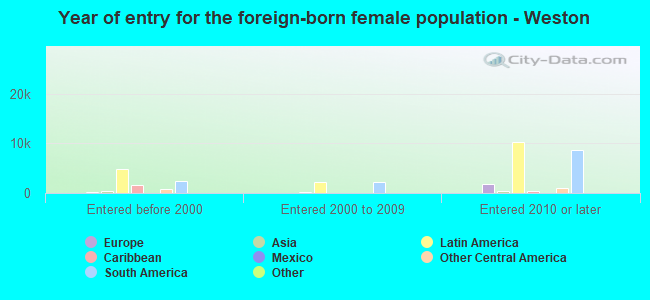
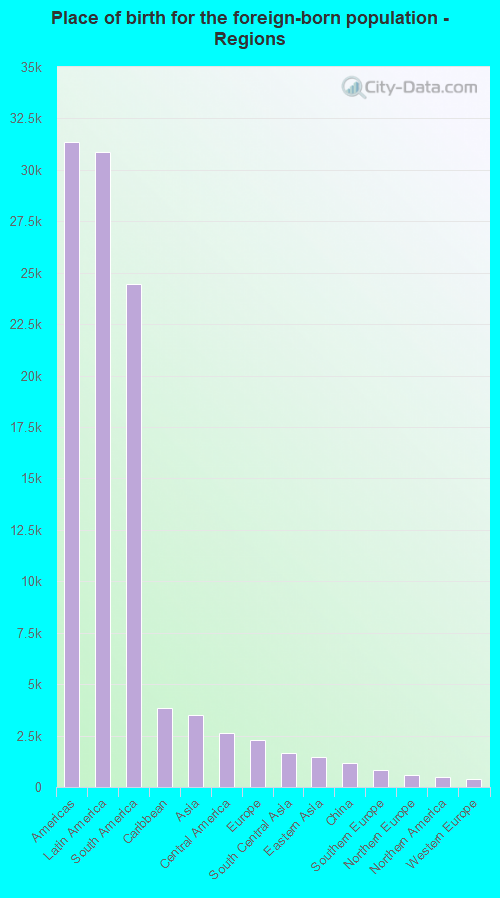
According to 2022 data, the most numerous races in Weston, FL are White alone (16,379 residents), Hispanic (42,357 residents), and Black alone (3,030 residents). 28.8% of Weston residents speak English at home. 54.6% of Weston, FL residents are foreign-born (42.7% born in Latin America), which is 61.5% greater than the foreign-born rate of 21.0% across the entire state of Florida.
Race distribution in Weston
2000 2022
10,458,509 65.4% White alone 2,682,715 16.8% Hispanic 2,264,268 14.2% Black alone 261,693 1.6% Asian alone 236,954 1.5% Two or more races 42,358 0.3% American Indian alone 28,994 0.2% Other race alone 6,887 0.04% Native Hawaiian and Other
11,309,403 50.8% White alone 6,025,039 27.1% Hispanic 3,241,015 14.6% Black alone 861,630 3.9% Two or more races 623,692 2.8% Asian alone 152,054 0.7% Other race alone 22,504 0.1% American Indian alone 9,486 0.04% Native Hawaiian and Other
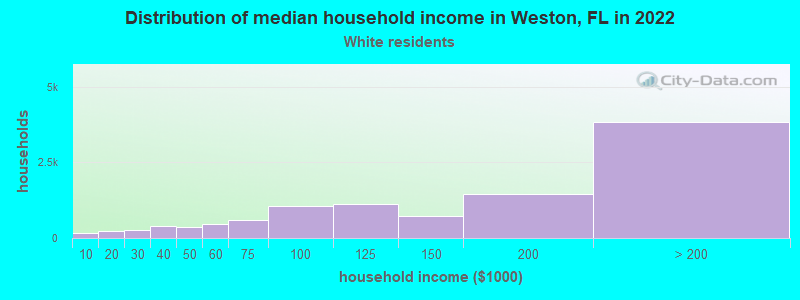
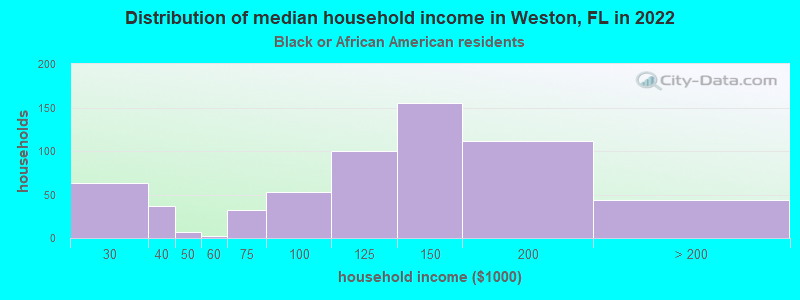
Income and house value in Weston Median household income in 2022 $160,966 White non-Hispanic householders$138,956 Black householders$135,016 Asian householders$95,625 Some other race householders$117,033 Two or more races householders$119,761 Hispanic or Latino race householdersMedian 2022 house value $758,750 White Non-Hispanic householders$759,821 Black or African American householders$580,493 American Indian or Alaska Native householders $770,181 Asian householders$567,990 Some other race householders$581,208 Two or more races householders$650,867 Hispanic or Latino householders
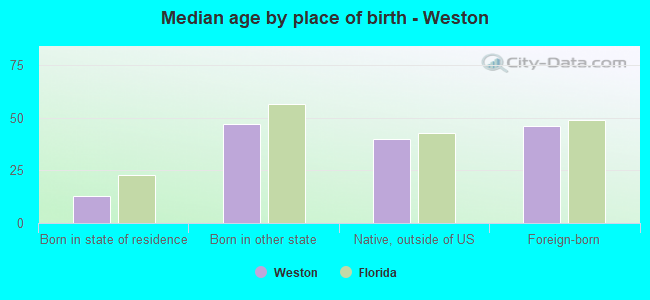
Median age by race in Weston
42.8 Median age for White residents46.4 36.8 36.0 Median age for Black or African American residents17.8 39.9 -666,666,666.0 Median age for American Indian / Alaska Native residents-666,666,666.0 -666,666,666.0 36.0 Median age for Asian residents34.4 39.4 -666,666,666.0 Median age for Native Hawaiian / Pacific Islander residents-666,666,666.0 -666,666,666.0 41.9 Median age for Other race residents39.6 47.5 40.6 Median age for Two or more races residents39.6 42.3 44.3 Median age for White alone residents46.4 42.3 40.6 Median age for Hispanic or Latino residents39.9 42.0
Owner/renter occupied households by race in Weston
House owners and renters - White residents 5,787 82.6% Owner occupied1,222 17.4% Renter occupiedHouse owners and renters - Black or African American residents 537 60.7% Owner occupied348 39.3% Renter occupiedHouse owners and renters - Asian residents 1,244 91.2% Owner occupied120 8.8% Renter occupiedHouse owners and renters - Other race residents 553 75.8% Owner occupied177 24.2% Renter occupiedHouse owners and renters - Two or more races residents 6,542 59.3% Owner occupied4,488 40.7% Renter occupiedHouse owners and renters - White alone residents 4,950 82.2% Owner occupied1,069 17.8% Renter occupiedHouse owners and renters - Hispanic or Latino residents 7,378 61.4% Owner occupied4,647 38.6% Renter occupied
Language usage in Weston
English speakers - Total 28.8% of residents of Weston speak English at home.
61.9% of residents speak Spanish at home 23,462 59.0% Speak English very well16,325 41.0% Speak English less than very well9.3% of residents speak other language at home 4,758 80.0% Speak English very well1,189 20.0% Speak English less than very well
English speakers - Born in the United States 74.2% of residents of Weston speak English at home.
20.6% of residents speak Spanish at home 1,782 87.3% Speak English very well259 12.7% Speak English less than very well5.2% of residents speak other language at home 461 88.7% Speak English very well59 11.3% Speak English less than very well
English speakers - Native, born elsewhere 3.9% of residents of Weston speak English at home.
91.1% of residents speak Spanish at home 2,024 77.0% Speak English very well604 23.0% Speak English less than very well5.0% of residents speak other language at home 145 100.0% Speak English very well
English speakers - Foreign-born 9.8% of residents of Weston speak English at home.
78.7% of residents speak Spanish at home 15,837 52.6% Speak English very well14,292 47.4% Speak English less than very well11.5% of residents speak other language at home 3,289 75.0% Speak English very well1,094 25.0% Speak English less than very well
White (Caucasian) - Speak only English Native:
80.7% (11,248)Foreign-born:
43.7% (2,354)
White (Caucasian) - Speak another language Native:
19.3% (2,688)Foreign-born:
56.3% (3,035)
Black or African American - Speak only English Native:
89.2% (1,080)Foreign-born:
38.4% (525)
Black or African American - Speak another language Native:
10.9% (132)Foreign-born:
62.6% (855)
Asian - Speak only English Native:
51.9% (512)Foreign-born:
23.5% (478)
Asian - Speak another language Native:
48.1% (474)Foreign-born:
76.5% (1,560)
Other race - Speak only English Native:
22.5% (189)Foreign-born:
16.9% (316)
Other race - Speak another language Native:
77.5% (650)Foreign-born:
83.1% (1,549)
Two or more races - Speak only English Native:
14.7% (1,159)Foreign-born:
1.3% (381)
Two or more races - Speak another language Native:
85.3% (6,703)Foreign-born:
98.7% (27,935)
White alone - Speak only English Native:
84.3% (10,319)Foreign-born:
63.9% (2,180)
White alone - Speak another language Native:
15.7% (1,924)Foreign-born:
36.1% (1,233)
Hispanic or Latino - Speak only English Native:
21.4% (2,089)Foreign-born:
2.4% (735)
Hispanic or Latino - Speak another language Native:
78.6% (7,684)Foreign-born:
97.6% (29,930)
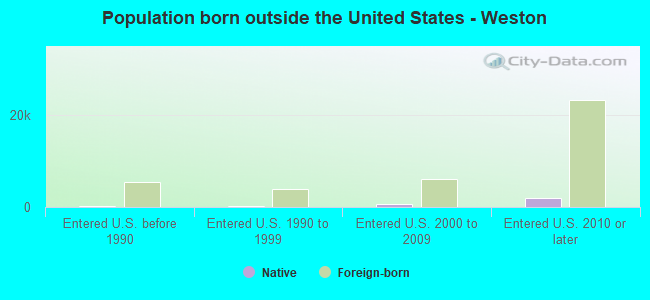
Foreign-born residents in Weston 37,248 residents are foreign born (42.7% Latin America ).
This city:
54.6%Florida:
21.1%
Marital status for residents in Weston Marital status - White (Caucasian) population 15 years and over
Males 18.3% Never married75.5% Now married0.0% Separated0.6% Widowed5.6% DivorcedFemales 30.8% Never married58.9% Now married0.0% Separated4.4% Widowed5.9% DivorcedWomen who gave birth in the past 12 months Now married:
96.4% (217)Unmarried:
3.6% (8)
Women who did not give birth in the past 12 months Now married:
48.6% (2,881)Unmarried:
51.4% (3,042)
Marital status - Black or African American population 15 years and over
Males 15.4% Never married70.1% Now married0.0% Separated0.0% Widowed14.5% DivorcedFemales 37.0% Never married41.7% Now married2.8% Separated4.6% Widowed13.9% DivorcedWomen who gave birth in the past 12 months Now married:
100.0% (13)Unmarried:
0.0% (0)
Women who did not give birth in the past 12 months Now married:
30.0% (229)Unmarried:
70.0% (534)
Marital status - American Indian / Alaska Native population 15 years and over
Males 100.0% Never married0.0% Now married0.0% Separated0.0% Widowed0.0% DivorcedFemales 0.0% Never married100.0% Now married0.0% Separated0.0% Widowed0.0% DivorcedWomen who did not give birth in the past 12 months Now married:
100.0% (2)Unmarried:
0.0% (0)
Marital status - Asian population 15 years and over
Males 24.7% Never married75.1% Now married0.0% Separated0.0% Widowed0.1% DivorcedFemales 19.5% Never married68.0% Now married0.5% Separated10.7% Widowed1.3% DivorcedWomen who gave birth in the past 12 months Now married:
100.0% (40)Unmarried:
0.0% (0)
Women who did not give birth in the past 12 months Now married:
69.5% (865)Unmarried:
30.5% (380)
Marital status - Other race population 15 years and over
Males 20.9% Never married73.1% Now married0.0% Separated0.0% Widowed6.0% DivorcedFemales 37.2% Never married47.7% Now married4.1% Separated1.9% Widowed9.0% DivorcedWomen who gave birth in the past 12 months Now married:
100.0% (92)Unmarried:
0.0% (0)
Women who did not give birth in the past 12 months Now married:
45.3% (696)Unmarried:
54.7% (841)
Marital status - Two or more races population 15 years and over
Males 25.1% Never married67.1% Now married4.0% Separated1.1% Widowed2.6% DivorcedFemales 22.1% Never married63.4% Now married0.2% Separated3.3% Widowed11.1% DivorcedWomen who gave birth in the past 12 months Now married:
100.0% (72)Unmarried:
0.0% (0)
Women who did not give birth in the past 12 months Now married:
63.3% (6,441)Unmarried:
36.7% (3,730)
Marital status - White alone, not Hispanic / Latino population 15 years and over
Males 15.3% Never married78.8% Now married0.0% Separated0.0% Widowed5.9% DivorcedFemales 26.7% Never married61.0% Now married0.0% Separated5.0% Widowed7.3% DivorcedWomen who gave birth in the past 12 months Now married:
100.0% (46)Unmarried:
0.0% (0)
Women who did not give birth in the past 12 months Now married:
43.6% (1,564)Unmarried:
56.4% (2,020)
Marital status - Hispanic or Latino population 15 years and over
Males 26.2% Never married67.2% Now married3.6% Separated1.3% Widowed1.8% DivorcedFemales 23.1% Never married62.8% Now married0.3% Separated3.0% Widowed10.8% DivorcedWomen who gave birth in the past 12 months Now married:
100.0% (72)Unmarried:
0.0% (0)
Women who did not give birth in the past 12 months Now married:
62.2% (7,126)Unmarried:
37.8% (4,330)
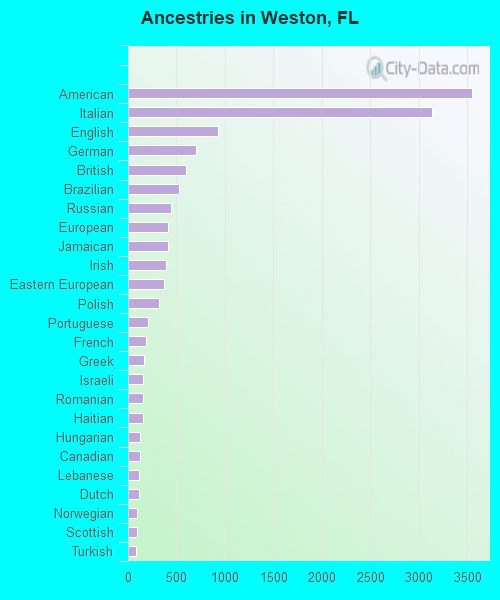
Ancestries in Weston
3,546 7.7% American3,134 6.8% Italian930 2.0% English697 1.5% German601 1.3% British525 1.1% Brazilian447 1.0% Russian416 0.9% European412 0.9% Jamaican395 0.9% Irish376 0.8% Eastern European319 0.7% Polish210 0.5% Portuguese181 0.4% French163 0.4% Greek156 0.3% Israeli156 0.3% Romanian154 0.3% Haitian124 0.3% Hungarian124 0.3% Canadian116 0.3% Lebanese109 0.2% Dutch89 0.2% Norwegian89 0.2% Scottish78 0.2% Turkish73 0.2% Austrian60 0.1% Czech48 0.1% Belgian46 0.10% Scandinavian44 0.10% Iranian39 0.08% Guyanese39 0.08% Scotch-Irish37 0.08% Slovak37 0.08% West Indian30 0.06% Armenian30 0.06% Lithuanian29 0.06% Swedish27 0.06% Nigerian27 0.06% Ukrainian26 0.06% Egyptian25 0.05% African24 0.05% Bulgarian15 0.03% Trinidadian and Tobagonian14 0.03% Basque9 0.02% Macedonian9 0.02% Yugoslavian5 0.01% Danish
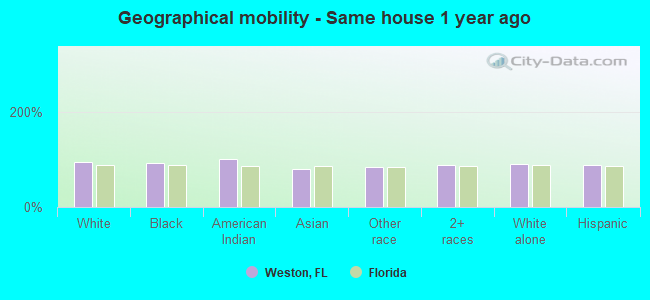
Geographical mobility in Weston Same house 1 year ago 18,940 94.8% White (Caucasian)2,429 93.3% Black or African American101 100.0% American Indian / Alaska Native3,825 80.4% Asian3,641 82.9% Other race33,970 88.6% Two or more races17,829 91.4% White alone, not Hispanic / Latino37,418 88.5% Hispanic or LatinoMoved within same county 726 3.6% White / Caucasian35 1.4% Black or African American684 14.4% Asian397 9.0% Other race1,801 4.7% Two or more races742 3.8% White alone, not Hispanic / Latino2,554 6.0% Hispanic or LatinoMoved within same state 253 1.3% White / Caucasian41 1.6% Black or African American145 3.0% Asian56 1.3% Other race1,278 3.3% Two or more races311 1.6% White alone, not Hispanic / Latino1,336 3.2% Hispanic or LatinoMoved from different state 68 0.3% White / Caucasian26 1.0% Black or African American18 0.4% Asian83 0.2% Two or more races405 2.1% White alone, not Hispanic / Latino83 0.2% Hispanic or LatinoMoved from abroad 144 5.5% Black or African American48 1.0% Asian268 6.1% Other race1,200 3.1% Two or more races285 1.5% White alone, not Hispanic / Latino911 2.2% Hispanic or Latino
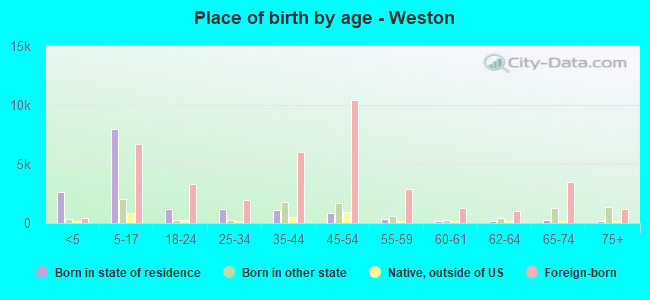
Children Nativity (place of birth) in Weston
Children under 6 years - Living with two parents Both parents native 1,191 100.0% NativeBoth parents foreign-born 1,454 82.6% Native306 17.4% Foreign-bornOne native, one foreign-born parent 668 100.0% NativeChildren under 6 years - Living with one parent Native parent 276 100.0% NativeForeign-born parent 51 29.3% Native123 70.7% Foreign-bornChildren 6 to 17 years - Living with two parents Both parents native 3,131 100.0% NativeBoth parents foreign-born 3,845 37.0% Native6,555 63.0% Foreign-bornOne native, one foreign-born parent 678 90.9% Native68 9.1% Foreign-bornChildren 6 to 17 years - Living with one parent Native parent 936 100.0% NativeForeign-born parent 1,611 50.9% Native1,555 49.1% Foreign-born
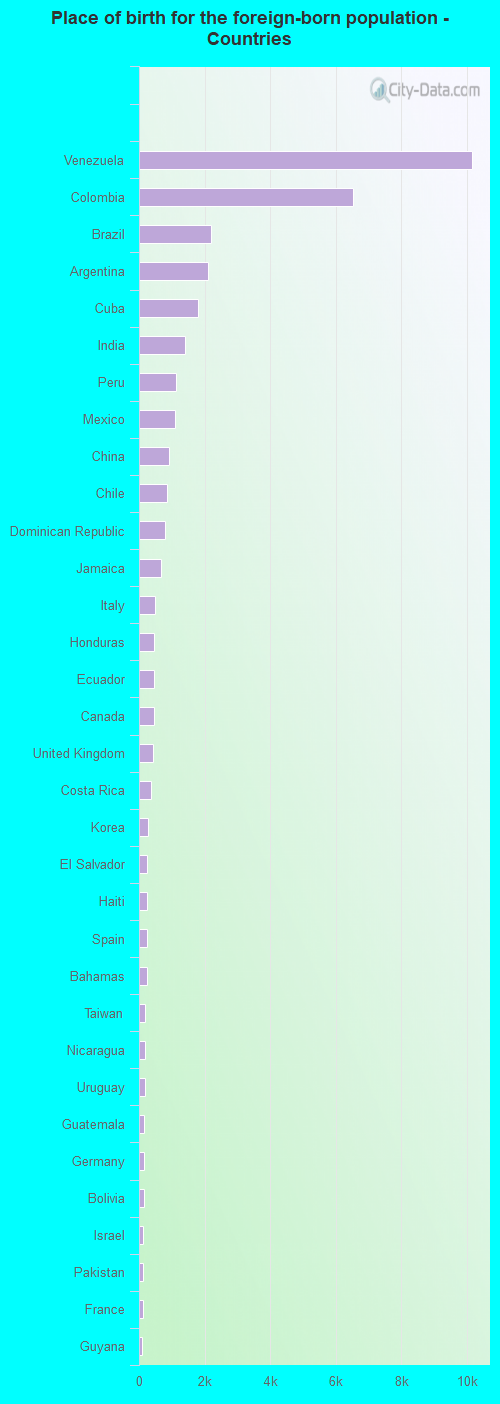
Place of birth for residents in Weston 31,336 Americas30,871 Latin America24,428 South America3,830 Caribbean3,510 Asia2,612 Central America2,266 Europe1,634 South Central Asia1,458 Eastern Asia1,171 China808 Southern Europe566 Northern Europe464 Northern America412 Western Europe259 Eastern Europe259 Western Asia158 South Eastern Asia68 Oceania68 Australia and New Zealand Subregion66 Africa36 Northern Africa30 Middle Africa10,168 Venezuela6,525 Colombia2,200 Brazil2,100 Argentina1,788 Cuba1,404 India1,114 Peru1,113 Mexico918 China867 Chile779 Dominican Republic666 Jamaica500 Italy472 Honduras469 Ecuador464 Canada417 United Kingdom361 Costa Rica287 Korea251 El Salvador245 Haiti234 Spain230 Bahamas198 Taiwan189 Nicaragua171 Uruguay167 Guatemala163 Germany159 Bolivia120 Israel112 Pakistan111 France97 Guyana80 Poland77 Trinidad and Tobago77 Netherlands75 England68 Australia57 Thailand56 Panama55 Lebanon55 Iran55 Bulgaria54 Hong Kong49 Portugal48 Ireland48 United Arab Emirates43 Austria42 West Indies40 Philippines35 Vietnam29 Hungary26 Turkey25 Malaysia25 Ukraine22 Morocco22 Greece20 Romania20 Cameroon15 Switzerland15 Norway13 Egypt10 Congo8 Russia8 Sweden8 Saudi Arabia7 North Macedonia (Macedonia)
Grandparents responsible for own grandchildren in Weston
Grandparents (30 to 59 years) White / Caucasian 51 34.5% Responsible for grandchildren98 65.5% Not responsible for grandchildrenBlack or African American 3 100.0% Not responsible for grandchildrenAsian 10 77.0% Responsible for grandchildren3 23.0% Not responsible for grandchildrenTwo or more races 13 12.8% Responsible for grandchildren91 87.2% Not responsible for grandchildrenWhite alone, not Hispanic / Latino 27 50.6% Responsible for grandchildren26 49.4% Not responsible for grandchildrenHispanic or Latino 81 29.0% Responsible for grandchildren198 71.0% Not responsible for grandchildrenGrandparents (60 years and over) White / Caucasian 14 3.8% Responsible for grandchildren346 96.2% Not responsible for grandchildrenBlack or African American 60 100.0% Not responsible for grandchildrenAsian 6 2.5% Responsible for grandchildren237 97.5% Not responsible for grandchildrenTwo or more races 49 6.0% Responsible for grandchildren770 94.0% Not responsible for grandchildrenWhite alone, not Hispanic / Latino 8 3.2% Responsible for grandchildren236 96.8% Not responsible for grandchildrenHispanic or Latino 31 4.0% Responsible for grandchildren725 96.0% Not responsible for grandchildren