Races in Westfield, New Jersey (NJ) Detailed Stats
Data:
Races - White alone (%)
Races - White alone (% change since 2000)
Races - Black alone (%)
Races - Black alone (% change since 2000)
Races - American Indian alone (%)
Races - American Indian alone (% change since 2000)
Races - Asian alone (%)
Races - Asian alone (% change since 2000)
Races - Hispanic (%)
Races - Hispanic (% change since 2000)
Races - Native Hawaiian and Other Pacific Islander alone (%)
Races - Native Hawaiian and Other Pacific Islander alone (% change since 2000)
Races - Two or more races(%)
Races - Two or more races(% change since 2000)
Races - Other race alone (%)
Races - Other race alone (% change since 2000)
Racial diversity
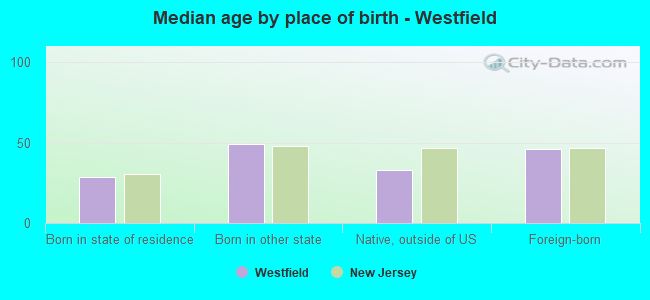
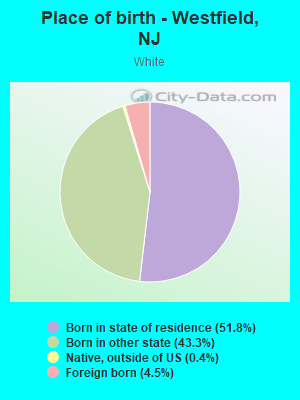
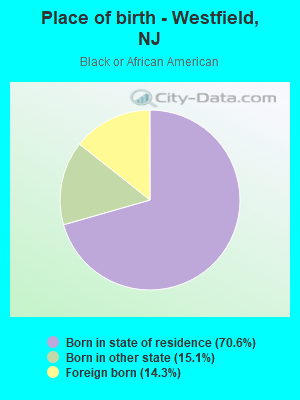
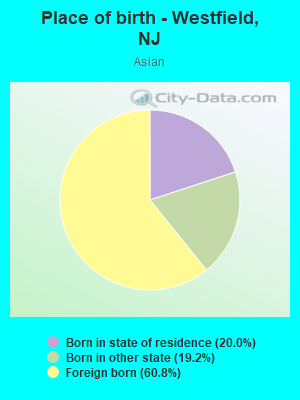
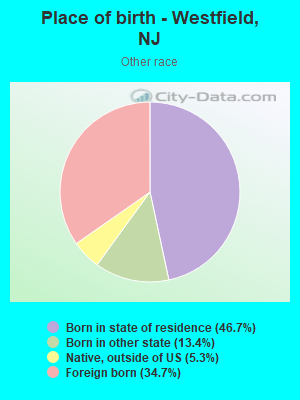
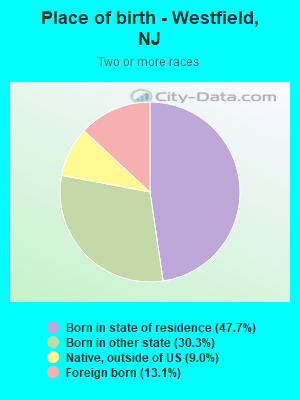
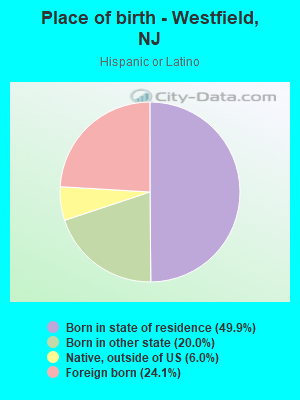
Place of birth - Born in state of residence (%)
Place of birth - Born in state of residence (%) - White
Place of birth - Born in state of residence (%) - Black or African American
Place of birth - Born in state of residence (%) - Asian
Place of birth - Born in state of residence (%) - Hispanic or Latino
Place of birth - Born in state of residence (%) - American Indian and Alaska Native
Place of birth - Born in state of residence (%) - Multirace
Place of birth - Born in state of residence (%) - Other Race
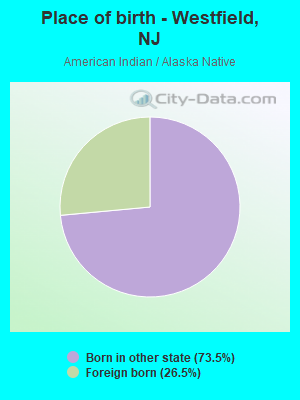
Place of birth - Born in other state (%)
Place of birth - Born in other state (%) - White
Place of birth - Born in other state (%) - Black or African American
Place of birth - Born in other state (%) - Asian
Place of birth - Born in other state (%) - Hispanic or Latino
Place of birth - Born in other state (%) - American Indian and Alaska Native
Place of birth - Born in other state (%) - Multirace
Place of birth - Born in other state (%) - Other Race
Place of birth - Native, outside of US (%)
Place of birth - Native, outside of US (%) - White
Place of birth - Native, outside of US (%) - Black or African American
Place of birth - Native, outside of US (%) - Asian
Place of birth - Native, outside of US (%) - Hispanic or Latino
Place of birth - Native, outside of US (%) - American Indian and Alaska Native
Place of birth - Native, outside of US (%) - Multirace
Place of birth - Native, outside of US (%) - Other Race
Place of birth - Foreign born (%)
Place of birth - Foreign born (%) - White
Place of birth - Foreign born (%) - Black or African American
Place of birth - Foreign born (%) - Asian
Place of birth - Foreign born (%) - Hispanic or Latino
Place of birth - Foreign born (%) - American Indian and Alaska Native
Place of birth - Foreign born (%) - Multirace
Place of birth - Foreign born (%) - Other Race
Residents speaking English at home (%)
Residents speaking English at home - Born in the United States (%)
Residents speaking English at home - Native, born elsewhere (%)
Residents speaking English at home - Foreign born (%)
Residents speaking Spanish at home (%)
Residents speaking Spanish at home - Born in the United States (%)
Residents speaking Spanish at home - Native, born elsewhere (%)
Residents speaking Spanish at home - Foreign born (%)
Residents speaking other language at home (%)
Residents speaking other language at home - Born in the United States (%)
Residents speaking other language at home - Native, born elsewhere (%)
Residents speaking other language at home - Foreign born (%)
Marital status - Never married (%)
Marital status - Now married (%)
Marital status - Separated (%)
Marital status - Widowed (%)
Marital status - Divorced (%)
Ancestries Reported - Arab (%)
Ancestries Reported - Czech (%)
Ancestries Reported - Danish (%)
Ancestries Reported - Dutch (%)
Ancestries Reported - English (%)
Ancestries Reported - French (%)
Ancestries Reported - French Canadian (%)
Ancestries Reported - German (%)
Ancestries Reported - Greek (%)
Ancestries Reported - Hungarian (%)
Ancestries Reported - Irish (%)
Ancestries Reported - Italian (%)
Ancestries Reported - Lithuanian (%)
Ancestries Reported - Norwegian (%)
Ancestries Reported - Polish (%)
Ancestries Reported - Portuguese (%)
Ancestries Reported - Russian (%)
Ancestries Reported - Scotch-Irish (%)
Ancestries Reported - Scottish (%)
Ancestries Reported - Slovak (%)
Ancestries Reported - Subsaharan African (%)
Ancestries Reported - Swedish (%)
Ancestries Reported - Swiss (%)
Ancestries Reported - Ukrainian (%)
Ancestries Reported - United States (%)
Ancestries Reported - Welsh (%)
Ancestries Reported - West Indian (%)
Ancestries Reported - Other (%)
Geographical mobility - Same house 1 year ago (%)
Geographical mobility - Same house 1 year ago (%) - White
Geographical mobility - Same house 1 year ago (%) - Black or African American
Geographical mobility - Same house 1 year ago (%) - Asian
Geographical mobility - Same house 1 year ago (%) - Hispanic or Latino
Geographical mobility - Same house 1 year ago (%) - American Indian and Alaska Native
Geographical mobility - Same house 1 year ago (%) - Multirace
Geographical mobility - Same house 1 year ago (%) - Other Race
Geographical mobility - Moved within same county (%)
Geographical mobility - Moved within same county (%) - White
Geographical mobility - Moved within same county (%) - Black or African American
Geographical mobility - Moved within same county (%) - Asian
Geographical mobility - Moved within same county (%) - Hispanic or Latino
Geographical mobility - Moved within same county (%) - American Indian and Alaska Native
Geographical mobility - Moved within same county (%) - Multirace
Geographical mobility - Moved within same county (%) - Other Race
Geographical mobility - Moved from different county within same state (%)
Geographical mobility - Moved from different county within same state (%) - White
Geographical mobility - Moved from different county within same state (%) - Black or African American
Geographical mobility - Moved from different county within same state (%) - Asian
Geographical mobility - Moved from different county within same state (%) - Hispanic or Latino
Geographical mobility - Moved from different county within same state (%) - American Indian and Alaska Native
Geographical mobility - Moved from different county within same state (%) - Multirace
Geographical mobility - Moved from different county within same state (%) - Other Race
Geographical mobility - Moved from different state (%)
Geographical mobility - Moved from different state (%) - White
Geographical mobility - Moved from different state (%) - Black or African American
Geographical mobility - Moved from different state (%) - Asian
Geographical mobility - Moved from different state (%) - Hispanic or Latino
Geographical mobility - Moved from different state (%) - American Indian and Alaska Native
Geographical mobility - Moved from different state (%) - Multirace
Geographical mobility - Moved from different state (%) - Other Race
Geographical mobility - Moved from abroad (%)
Geographical mobility - Moved from abroad (%) - White
Geographical mobility - Moved from abroad (%) - Black or African American
Geographical mobility - Moved from abroad (%) - Asian
Geographical mobility - Moved from abroad (%) - Hispanic or Latino
Geographical mobility - Moved from abroad (%) - American Indian and Alaska Native
Geographical mobility - Moved from abroad (%) - Multirace
Geographical mobility - Moved from abroad (%) - Other Race
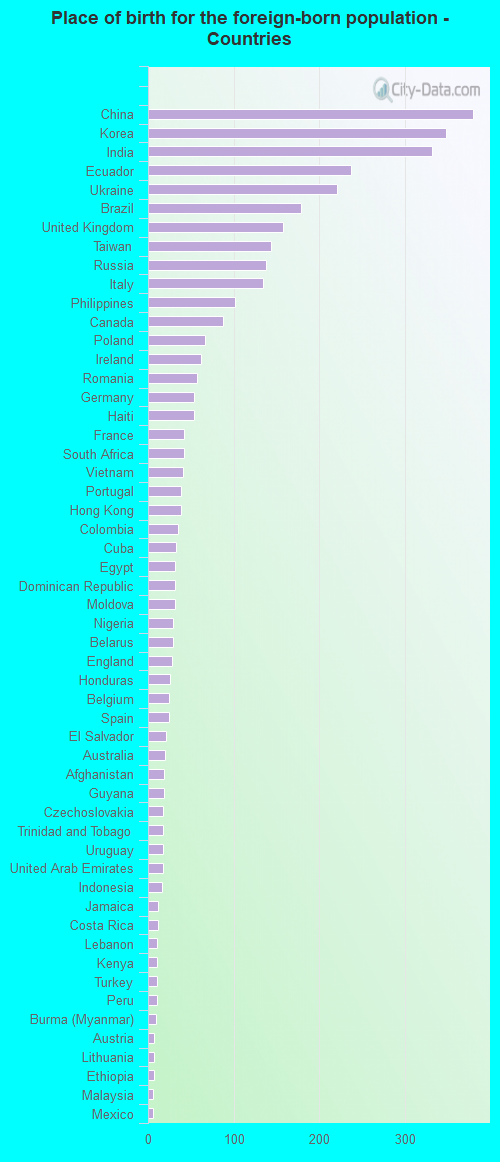
Place of birth for the foreign-born population - Ireland (%)
Place of birth for the foreign-born population - Denmark (%)
Place of birth for the foreign-born population - Norway (%)
Place of birth for the foreign-born population - Sweden (%)
Place of birth for the foreign-born population - United Kingdom (%)
Place of birth for the foreign-born population - England (%)
Place of birth for the foreign-born population - Scotland (%)
Place of birth for the foreign-born population - Other Northern Europe (%)
Place of birth for the foreign-born population - Austria (%)
Place of birth for the foreign-born population - Belgium (%)
Place of birth for the foreign-born population - France (%)
Place of birth for the foreign-born population - Germany (%)
Place of birth for the foreign-born population - Netherlands (%)
Place of birth for the foreign-born population - Switzerland (%)
Place of birth for the foreign-born population - Other Western Europe (%)
Place of birth for the foreign-born population - Greece (%)
Place of birth for the foreign-born population - Italy (%)
Place of birth for the foreign-born population - Portugal (%)
Place of birth for the foreign-born population - Spain (%)
Place of birth for the foreign-born population - Other Southern Europe (%)
Place of birth for the foreign-born population - Albania (%)
Place of birth for the foreign-born population - Belarus (%)
Place of birth for the foreign-born population - Bosnia and Herzegovina (%)
Place of birth for the foreign-born population - Bulgaria (%)
Place of birth for the foreign-born population - Croatia (%)
Place of birth for the foreign-born population - Czechoslovakia (%)
Place of birth for the foreign-born population - Hungary (%)
Place of birth for the foreign-born population - Latvia (%)
Place of birth for the foreign-born population - Lithuania (%)
Place of birth for the foreign-born population - North Macedonia (Macedonia) (%)
Place of birth for the foreign-born population - Moldova (%)
Place of birth for the foreign-born population - Poland (%)
Place of birth for the foreign-born population - Romania (%)
Place of birth for the foreign-born population - Russia (%)
Place of birth for the foreign-born population - Serbia (%)
Place of birth for the foreign-born population - Ukraine (%)
Place of birth for the foreign-born population - Other Eastern Europe (%)
Place of birth for the foreign-born population - China (%)
Place of birth for the foreign-born population - Hong Kong (%)
Place of birth for the foreign-born population - Taiwan (%)
Place of birth for the foreign-born population - Japan (%)
Place of birth for the foreign-born population - Korea (%)
Place of birth for the foreign-born population - Other Eastern Asia (%)
Place of birth for the foreign-born population - Afghanistan (%)
Place of birth for the foreign-born population - Bangladesh (%)
Place of birth for the foreign-born population - India (%)
Place of birth for the foreign-born population - Iran (%)
Place of birth for the foreign-born population - Kazakhstan (%)
Place of birth for the foreign-born population - Nepal (%)
Place of birth for the foreign-born population - Pakistan (%)
Place of birth for the foreign-born population - Sri Lanka (%)
Place of birth for the foreign-born population - Uzbekistan (%)
Place of birth for the foreign-born population - Other South Central Asia (%)
Place of birth for the foreign-born population - Burma (%)
Place of birth for the foreign-born population - Cambodia (%)
Place of birth for the foreign-born population - Indonesia (%)
Place of birth for the foreign-born population - Laos (%)
Place of birth for the foreign-born population - Malaysia (%)
Place of birth for the foreign-born population - Philippines (%)
Place of birth for the foreign-born population - Singapore (%)
Place of birth for the foreign-born population - Thailand (%)
Place of birth for the foreign-born population - Vietnam (%)
Place of birth for the foreign-born population - Other South Eastern Asia (%)
Place of birth for the foreign-born population - Armenia (%)
Place of birth for the foreign-born population - Iraq (%)
Place of birth for the foreign-born population - Israel (%)
Place of birth for the foreign-born population - Jordan (%)
Place of birth for the foreign-born population - Kuwait (%)
Place of birth for the foreign-born population - Lebanon (%)
Place of birth for the foreign-born population - Saudi Arabia (%)
Place of birth for the foreign-born population - Syria (%)
Place of birth for the foreign-born population - Turkey (%)
Place of birth for the foreign-born population - Yemen (%)
Place of birth for the foreign-born population - Other Western Asia (%)
Place of birth for the foreign-born population - Eritrea (%)
Place of birth for the foreign-born population - Ethiopia (%)
Place of birth for the foreign-born population - Kenya (%)
Place of birth for the foreign-born population - Somalia (%)
Place of birth for the foreign-born population - Uganda (%)
Place of birth for the foreign-born population - Zimbabwe (%)
Place of birth for the foreign-born population - Other Eastern Africa (%)
Place of birth for the foreign-born population - Cameroon (%)
Place of birth for the foreign-born population - Congo (%)
Place of birth for the foreign-born population - Democratic Republic of Congo (Zaire) (%)
Place of birth for the foreign-born population - Other Middle Africa (%)
Place of birth for the foreign-born population - Egypt (%)
Place of birth for the foreign-born population - Morocco (%)
Place of birth for the foreign-born population - Sudan (%)
Place of birth for the foreign-born population - Other Northern Africa (%)
Place of birth for the foreign-born population - South Africa (%)
Place of birth for the foreign-born population - Other Southern Africa (%)
Place of birth for the foreign-born population - Cabo Verde (%)
Place of birth for the foreign-born population - Ghana (%)
Place of birth for the foreign-born population - Liberia (%)
Place of birth for the foreign-born population - Nigeria (%)
Place of birth for the foreign-born population - Senegal (%)
Place of birth for the foreign-born population - Sierra Leone (%)
Place of birth for the foreign-born population - Other Western Africa (%)
Place of birth for the foreign-born population - Australia (%)
Place of birth for the foreign-born population - New Zealand (%)
Place of birth for the foreign-born population - Fiji (%)
Place of birth for the foreign-born population - Micronesia (%)
Place of birth for the foreign-born population - Bahamas (%)
Place of birth for the foreign-born population - Barbados (%)
Place of birth for the foreign-born population - Cuba (%)
Place of birth for the foreign-born population - Dominica (%)
Place of birth for the foreign-born population - Dominican Republic (%)
Place of birth for the foreign-born population - Grenada (%)
Place of birth for the foreign-born population - Haiti (%)
Place of birth for the foreign-born population - Jamaica (%)
Place of birth for the foreign-born population - St. Vincent and the Grenadines (%)
Place of birth for the foreign-born population - Trinidad and Tobago (%)
Place of birth for the foreign-born population - West Indies (%)
Place of birth for the foreign-born population - Other Caribbean (%)
Place of birth for the foreign-born population - Belize (%)
Place of birth for the foreign-born population - Costa Rica (%)
Place of birth for the foreign-born population - El Salvador (%)
Place of birth for the foreign-born population - Guatemala (%)
Place of birth for the foreign-born population - Honduras (%)
Place of birth for the foreign-born population - Mexico (%)
Place of birth for the foreign-born population - Nicaragua (%)
Place of birth for the foreign-born population - Panama (%)
Place of birth for the foreign-born population - Other Central America (%)
Place of birth for the foreign-born population - Argentina (%)
Place of birth for the foreign-born population - Bolivia (%)
Place of birth for the foreign-born population - Brazil (%)
Place of birth for the foreign-born population - Chile (%)
Place of birth for the foreign-born population - Colombia (%)
Place of birth for the foreign-born population - Ecuador (%)
Place of birth for the foreign-born population - Guyana (%)
Place of birth for the foreign-born population - Peru (%)
Place of birth for the foreign-born population - Uruguay (%)
Place of birth for the foreign-born population - Venezuela (%)
Place of birth for the foreign-born population - Other South America (%)
Place of birth for the foreign-born population - Canada (%)
Place of birth for the foreign-born population - Other Northern America (%)
Place of birth for the foreign-born population - Other (%)
Latest news about races in Westfield, NJ collected exclusively by city-data.com from local newspapers, TV, and radio stations
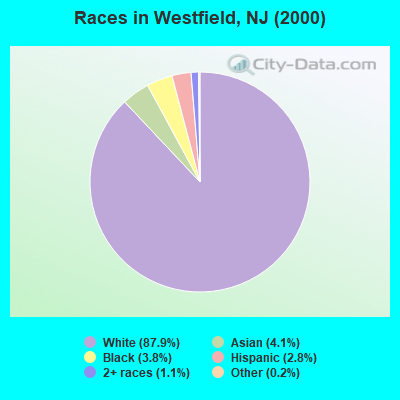
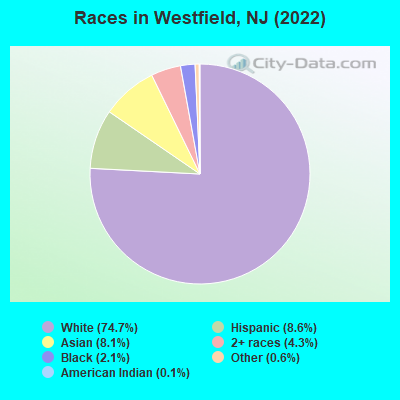
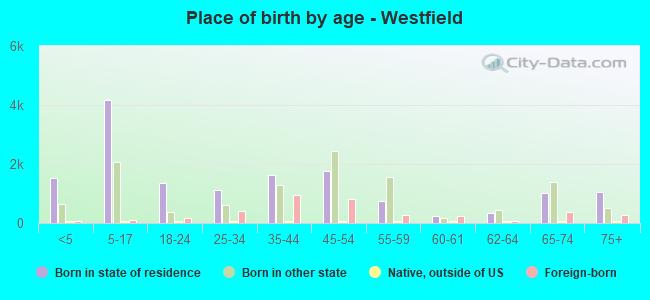
According to 2022 data, the most numerous races in Westfield, NJ are White alone (22,952 residents), Hispanic (2,644 residents), and Black alone (632 residents). 82.4% of Westfield residents speak English at home. 11.8% of Westfield, NJ residents are foreign-born (4.7% born in Asia, 3.8% born in Europe, 2.3% born in Latin America), which is 94.7% less than the foreign-born rate of 23.0% across the entire state of New Jersey.
Race distribution in Westfield
2000 2022
5,557,209 66.0% White alone 1,117,191 13.3% Hispanic 1,096,171 13.0% Black alone 477,012 5.7% Asian alone 133,689 1.6% Two or more races 19,565 0.2% Other race alone 11,338 0.1% American Indian alone 2,175 0.03% Native Hawaiian and Other
4,766,476 51.5% White alone 2,028,470 21.9% Hispanic 1,111,632 12.0% Black alone 923,546 10.0% Asian alone 332,237 3.6% Two or more races 89,847 1.0% Other race alone 8,557 0.09% American Indian alone 934 0.01% Native Hawaiian and Other
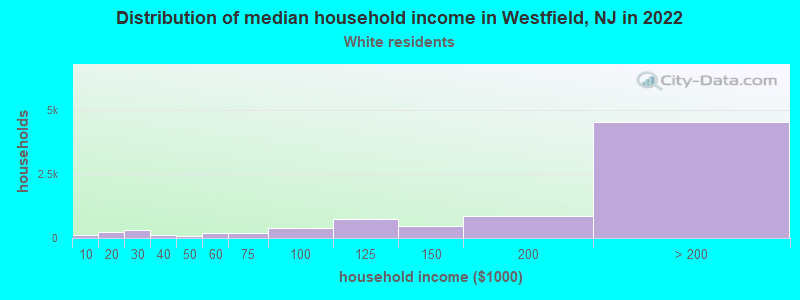
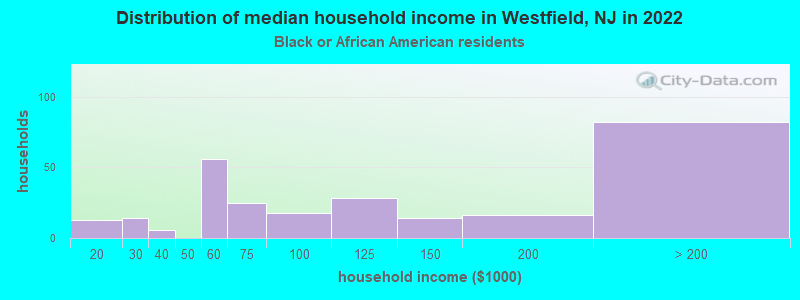
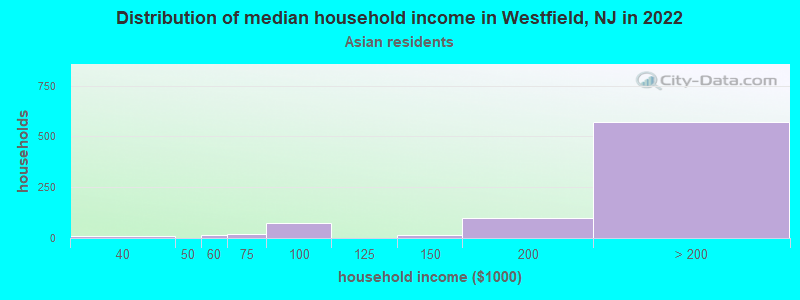
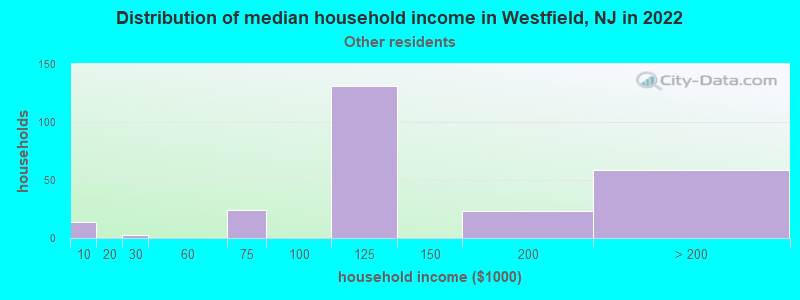
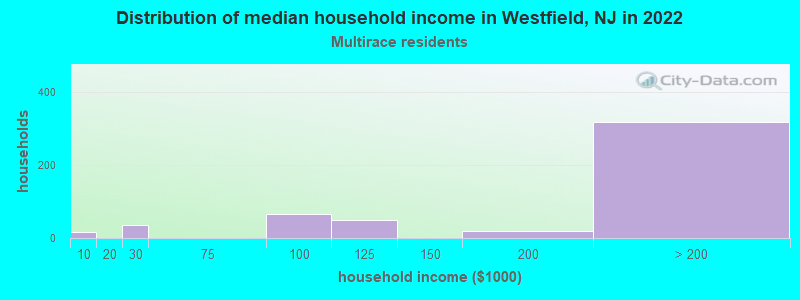
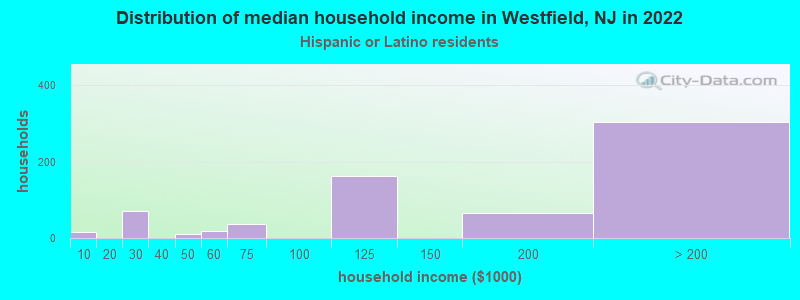
Income and house value in Westfield Median household income in 2022 over $200,000 White non-Hispanic householders$97,238 Black householdersover $200,000 Asian householders$111,489 Some other race householdersover $200,000 Two or more races householders$180,394 Hispanic or Latino race householdersMedian 2022 house value over $1,000,000 White Non-Hispanic householders$559,427 Black or African American householders$753,461 American Indian or Alaska Native householders $794,220 Asian householders$586,121 Some other race householders$618,269 Two or more races householders$874,589 Hispanic or Latino householders
Median age by race in Westfield
42.7 Median age for White residents42.1 42.5 54.1 Median age for Black or African American residents53.1 54.8 45.8 Median age for American Indian / Alaska Native residents-749,529,189.5 -612,668,742.9 41.9 Median age for Asian residents41.3 42.6 -1,010,045,661.1 Median age for Native Hawaiian / Pacific Islander residents-860,335,194.7 -713,070,378.3 25.1 Median age for Other race residents32.4 14.0 13.1 Median age for Two or more races residents13.8 11.4 42.7 Median age for White alone residents42.9 42.9 24.2 Median age for Hispanic or Latino residents31.1 16.2
Owner/renter occupied households by race in Westfield
House owners and renters - White residents 6,625 82.7% Owner occupied1,388 17.3% Renter occupiedHouse owners and renters - Black or African American residents 157 61.2% Owner occupied100 38.8% Renter occupiedHouse owners and renters - American Indian / Alaska Native residents 19 100.0% Owner occupiedHouse owners and renters - Asian residents 660 77.9% Owner occupied187 22.1% Renter occupiedHouse owners and renters - Other race residents 44 19.8% Owner occupied178 80.2% Renter occupiedHouse owners and renters - Two or more races residents 292 74.3% Owner occupied101 25.7% Renter occupiedHouse owners and renters - White alone residents 6,884 81.8% Owner occupied1,533 18.2% Renter occupiedHouse owners and renters - Hispanic or Latino residents 294 48.9% Owner occupied308 51.1% Renter occupied
Language usage in Westfield
English speakers - Total 82.4% of residents of Westfield speak English at home.
3.9% of residents speak Spanish at home 934 83.2% Speak English very well189 16.8% Speak English less than very well12.4% of residents speak other language at home 2,846 81.0% Speak English very well669 19.0% Speak English less than very well
English speakers - Born in the United States 93.6% of residents of Westfield speak English at home.
1.1% of residents speak Spanish at home 125 100.0% Speak English very well5.2% of residents speak other language at home 531 93.5% Speak English very well37 6.5% Speak English less than very well
English speakers - Native, born elsewhere 46.4% of residents of Westfield speak English at home.
44.4% of residents speak Spanish at home 101 75.4% Speak English very well33 24.6% Speak English less than very well4.0% of residents speak other language at home 12 100.0% Speak English very well
English speakers - Foreign-born 21.9% of residents of Westfield speak English at home.
10.2% of residents speak Spanish at home 268 71.1% Speak English very well109 28.9% Speak English less than very well64.7% of residents speak other language at home 1,847 77.5% Speak English very well535 22.5% Speak English less than very well
White (Caucasian) - Speak only English Native:
98.8% (19,852)Foreign-born:
32.2% (318)
White (Caucasian) - Speak another language Native:
3.8% (768)Foreign-born:
68.9% (681)
Black or African American - Speak only English Native:
81.2% (559)Foreign-born:
34.2% (40)
Black or African American - Speak another language Native:
19.6% (135)Foreign-born:
64.0% (75)
American Indian / Alaska Native - Speak only English Native:
74.7% (30)Foreign-born:
100.0% (21)
Asian - Speak only English Native:
69.7% (586)Foreign-born:
21.0% (317)
Asian - Speak another language Native:
31.7% (266)Foreign-born:
79.5% (1,199)
Other race - Speak only English Native:
76.9% (409)Foreign-born:
5.0% (18)
Other race - Speak another language Native:
28.4% (151)Foreign-born:
95.1% (333)
Two or more races - Speak only English Native:
77.4% (1,218)Foreign-born:
10.8% (38)
Two or more races - Speak another language Native:
15.8% (248)Foreign-born:
89.4% (315)
White alone - Speak only English Native:
95.9% (19,813)Foreign-born:
27.6% (342)
White alone - Speak another language Native:
4.2% (876)Foreign-born:
70.6% (874)
Hispanic or Latino - Speak only English Native:
64.6% (940)Foreign-born:
10.0% (62)
Hispanic or Latino - Speak another language Native:
36.0% (524)Foreign-born:
91.1% (570)
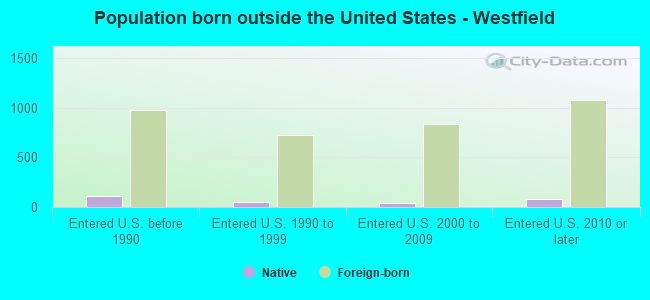
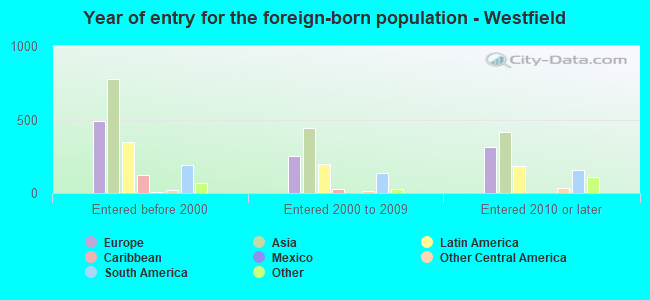
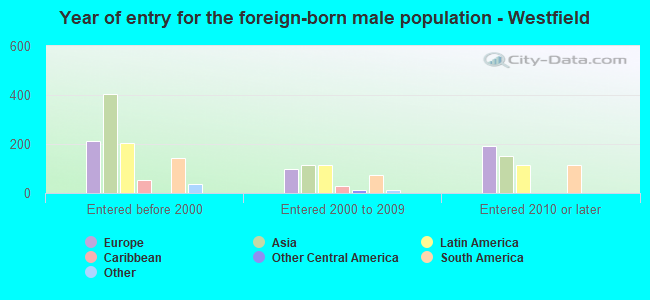
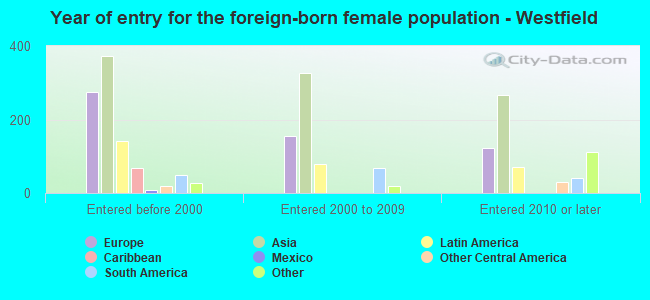
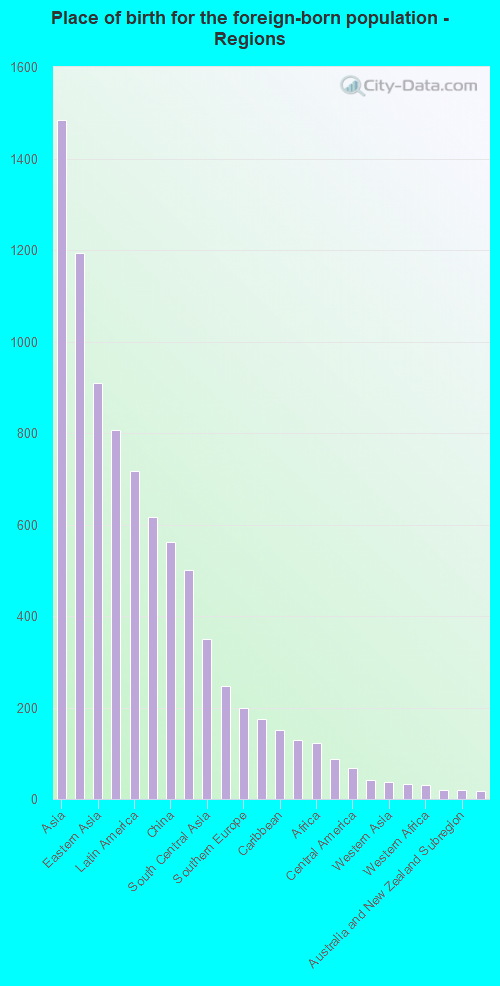
Foreign-born residents in Westfield 3,628 residents are foreign born (4.7% Asia , 3.8% Europe , 2.3% Latin America ).
This city:
11.8%New Jersey:
23.2%
Marital status for residents in Westfield Marital status - White (Caucasian) population 15 years and over
Males 25.4% Never married68.1% Now married0.1% Separated2.4% Widowed4.1% DivorcedFemales 21.8% Never married63.7% Now married0.7% Separated6.2% Widowed7.6% DivorcedWomen who gave birth in the past 12 months Now married:
100.0% (321)Unmarried:
0.0% (0)
Women who did not give birth in the past 12 months Now married:
56.3% (2,423)Unmarried:
43.7% (1,884)
Marital status - Black or African American population 15 years and over
Males 35.1% Never married46.4% Now married6.9% Separated10.0% Widowed1.7% DivorcedFemales 36.0% Never married35.4% Now married7.6% Separated0.0% Widowed21.1% DivorcedWomen who gave birth in the past 12 months Now married:
100.0% (17)Unmarried:
0.0% (0)
Women who did not give birth in the past 12 months Now married:
30.2% (36)Unmarried:
69.8% (83)
Marital status - American Indian / Alaska Native population 15 years and over
Males 0.0% Never married100.0% Now married0.0% Separated0.0% Widowed0.0% DivorcedFemales 0.0% Never married100.0% Now married0.0% Separated0.0% Widowed0.0% DivorcedWomen who did not give birth in the past 12 months Now married:
100.0% (23)Unmarried:
0.0% (0)
Marital status - Asian population 15 years and over
Males 9.4% Never married90.6% Now married0.0% Separated0.0% Widowed0.0% DivorcedFemales 15.1% Never married77.8% Now married0.7% Separated3.9% Widowed2.5% DivorcedWomen who did not give birth in the past 12 months Now married:
76.8% (499)Unmarried:
23.2% (151)
Marital status - Other race population 15 years and over
Males 17.5% Never married30.0% Now married0.0% Separated0.0% Widowed52.5% DivorcedFemales 15.9% Never married22.6% Now married0.0% Separated4.2% Widowed57.3% DivorcedWomen who gave birth in the past 12 months Now married:
100.0% (7)Unmarried:
0.0% (0)
Women who did not give birth in the past 12 months Now married:
13.5% (22)Unmarried:
86.5% (140)
Marital status - Two or more races population 15 years and over
Males 32.9% Never married62.9% Now married0.0% Separated0.0% Widowed4.3% DivorcedFemales 48.6% Never married31.8% Now married0.0% Separated3.7% Widowed15.8% DivorcedWomen who did not give birth in the past 12 months Now married:
33.4% (178)Unmarried:
66.6% (354)
Marital status - White alone, not Hispanic / Latino population 15 years and over
Males 24.4% Never married69.2% Now married0.1% Separated2.4% Widowed3.9% DivorcedFemales 21.4% Never married64.4% Now married0.8% Separated5.9% Widowed7.6% DivorcedWomen who gave birth in the past 12 months Now married:
100.0% (350)Unmarried:
0.0% (0)
Women who did not give birth in the past 12 months Now married:
57.0% (2,600)Unmarried:
43.0% (1,962)
Marital status - Hispanic or Latino population 15 years and over
Males 31.3% Never married47.0% Now married0.0% Separated0.0% Widowed21.7% DivorcedFemales 27.1% Never married32.9% Now married0.0% Separated10.8% Widowed29.1% DivorcedWomen who gave birth in the past 12 months Now married:
100.0% (7)Unmarried:
0.0% (0)
Women who did not give birth in the past 12 months Now married:
32.6% (143)Unmarried:
67.4% (295)
Ancestries in Westfield
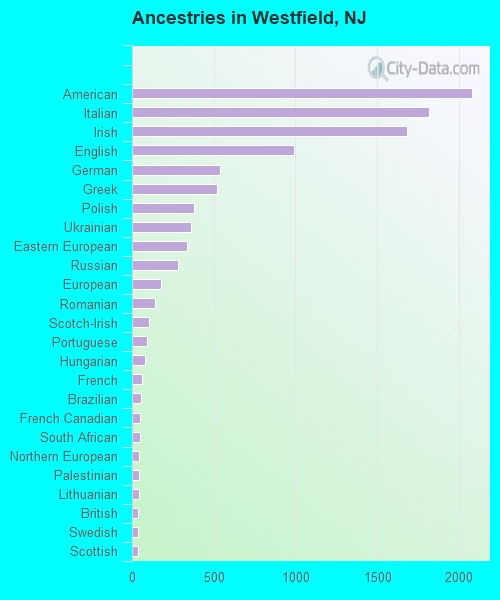
2,081 14.3% American1,816 12.5% Italian1,685 11.6% Irish992 6.8% English540 3.7% German523 3.6% Greek377 2.6% Polish363 2.5% Ukrainian337 2.3% Eastern European281 1.9% Russian179 1.2% European138 0.9% Romanian101 0.7% Scotch-Irish92 0.6% Portuguese80 0.5% Hungarian62 0.4% French54 0.4% Brazilian52 0.4% French Canadian48 0.3% South African45 0.3% Northern European44 0.3% Palestinian43 0.3% Lithuanian39 0.3% British39 0.3% Swedish34 0.2% Scottish33 0.2% Nigerian32 0.2% Egyptian30 0.2% Croatian29 0.2% Welsh25 0.2% Canadian23 0.2% Slovak22 0.2% Lebanese18 0.1% Afghan11 0.08% Pennsylvania German11 0.08% Jamaican10 0.07% Scandinavian10 0.07% Haitian9 0.06% Ethiopian9 0.06% Kenyan7 0.05% Macedonian7 0.05% Armenian7 0.05% Norwegian
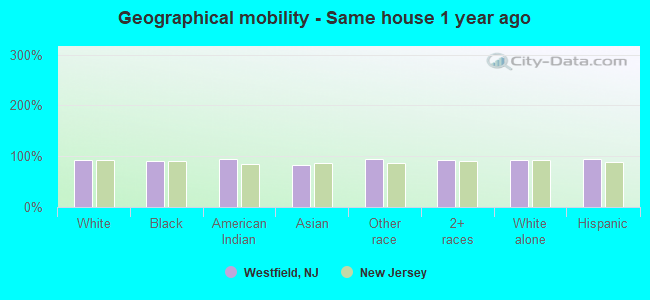
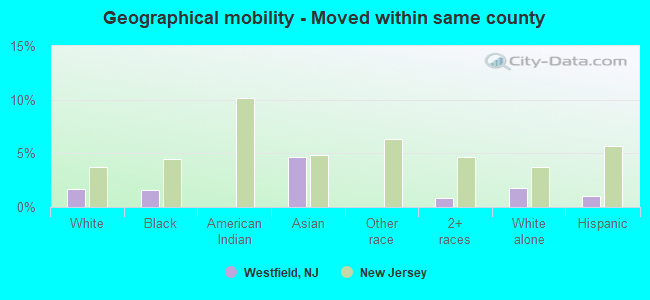
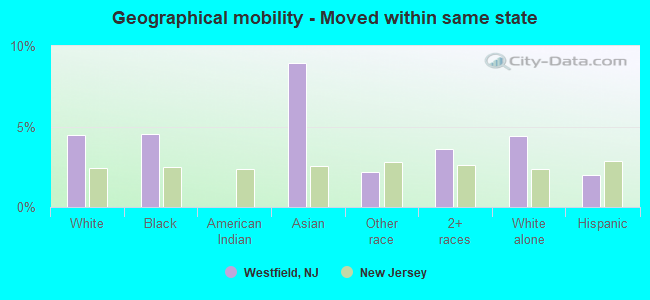
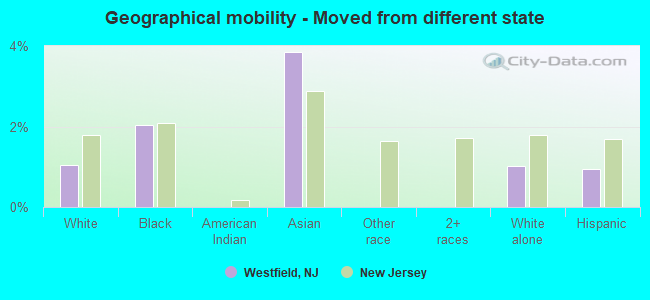
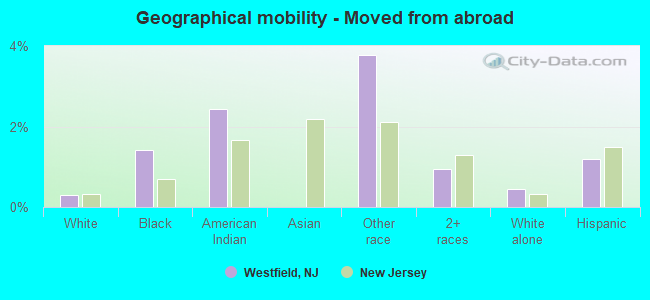
Geographical mobility in Westfield Same house 1 year ago 19,702 93.0% White (Caucasian)743 90.6% Black or African American57 94.3% American Indian / Alaska Native2,082 82.8% Asian974 93.9% Other race2,514 92.3% Two or more races21,008 92.7% White alone, not Hispanic / Latino2,427 93.8% Hispanic or LatinoMoved within same county 354 1.7% White / Caucasian13 1.6% Black or African American118 4.7% Asian23 0.8% Two or more races400 1.8% White alone, not Hispanic / Latino26 1.0% Hispanic or LatinoMoved within same state 943 4.4% White / Caucasian37 4.5% Black or African American225 8.9% Asian23 2.2% Other race98 3.6% Two or more races992 4.4% White alone, not Hispanic / Latino51 2.0% Hispanic or LatinoMoved from different state 222 1.0% White / Caucasian17 2.0% Black or African American97 3.9% Asian232 1.0% White alone, not Hispanic / Latino25 1.0% Hispanic or LatinoMoved from abroad 61 0.3% White12 1.4% Black or African American1 2.4% American Indian / Alaska Native39 3.8% Other race26 0.9% Two or more races99 0.4% White alone, not Hispanic / Latino31 1.2% Hispanic or Latino
Children Nativity (place of birth) in Westfield
Children under 6 years - Living with two parents Both parents native 1,294 100.0% NativeBoth parents foreign-born 186 72.1% Native72 27.9% Foreign-bornOne native, one foreign-born parent 407 100.0% NativeChildren under 6 years - Living with one parent Native parent 256 100.0% NativeForeign-born parent 101 100.0% NativeChildren 6 to 17 years - Living with two parents Both parents native 4,022 100.0% Native2 0.0% Foreign-bornBoth parents foreign-born 486 87.2% Native71 12.8% Foreign-bornOne native, one foreign-born parent 385 98.9% Native4 1.1% Foreign-bornChildren 6 to 17 years - Living with one parent Native parent 689 100.0% NativeForeign-born parent 226 50.2% Native224 49.8% Foreign-born
Grandparents responsible for own grandchildren in Westfield
Grandparents (30 to 59 years) Black or African American 22 100.0% Not responsible for grandchildren
Grandparents (60 years and over)