Races in Westbrook, Maine (ME) Detailed Stats
Data:
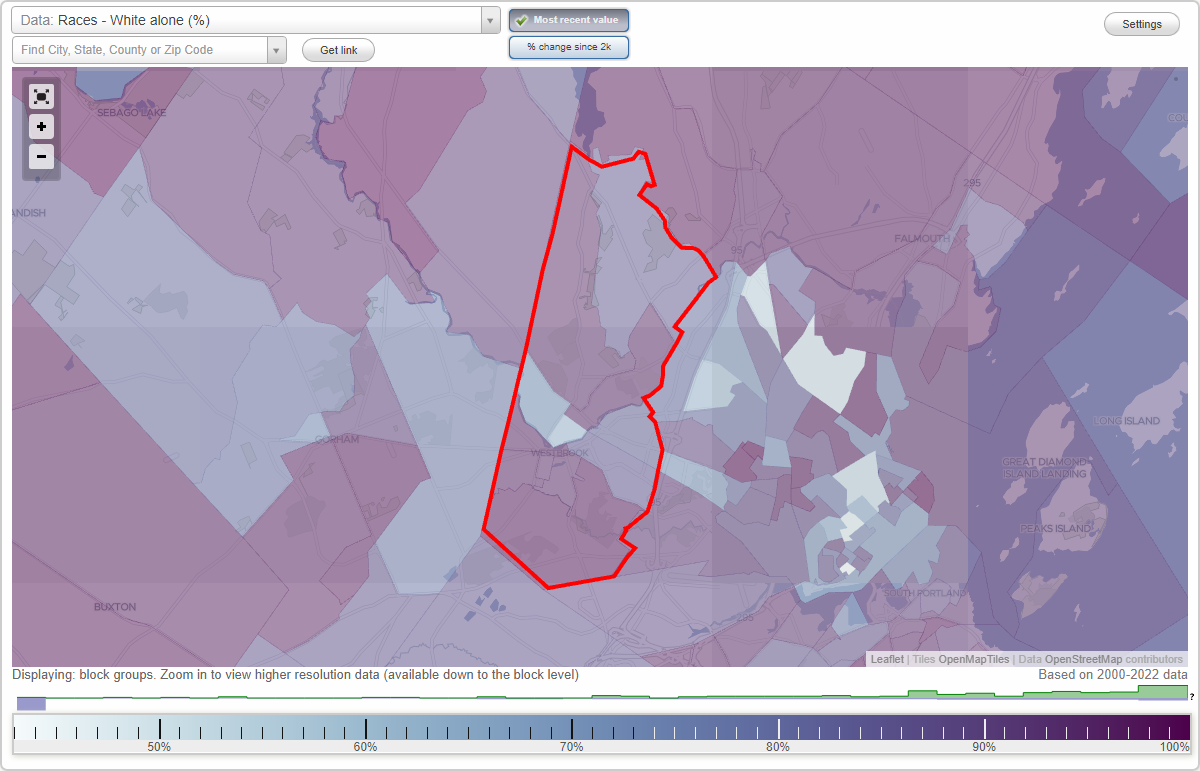
Races - White alone (%)
Races - White alone (% change since 2000)
Races - Black alone (%)
Races - Black alone (% change since 2000)
Races - American Indian alone (%)
Races - American Indian alone (% change since 2000)
Races - Asian alone (%)
Races - Asian alone (% change since 2000)
Races - Hispanic (%)
Races - Hispanic (% change since 2000)
Races - Native Hawaiian and Other Pacific Islander alone (%)
Races - Native Hawaiian and Other Pacific Islander alone (% change since 2000)
Races - Two or more races(%)
Races - Two or more races(% change since 2000)
Races - Other race alone (%)
Races - Other race alone (% change since 2000)
Racial diversity
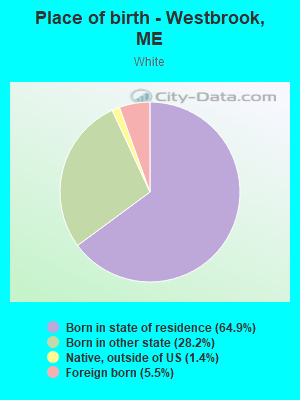
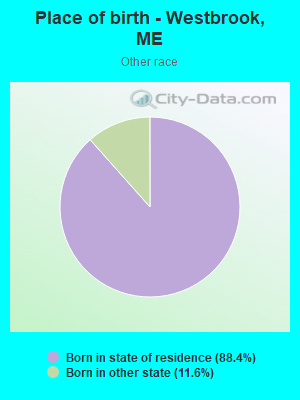
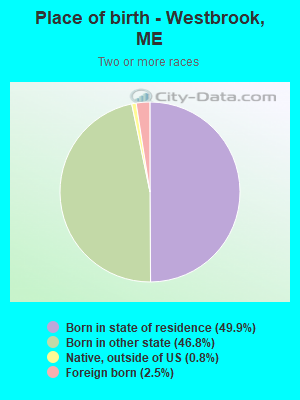
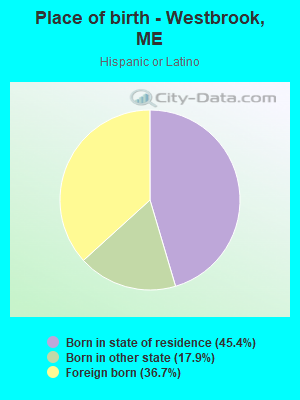
Place of birth - Born in state of residence (%)
Place of birth - Born in state of residence (%) - White
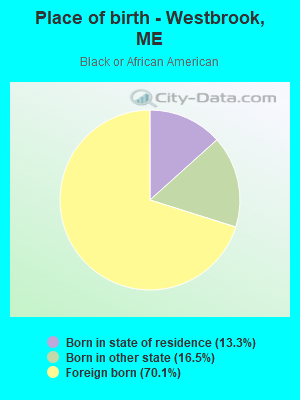
Place of birth - Born in state of residence (%) - Black or African American
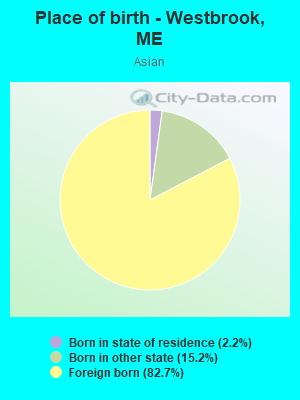
Place of birth - Born in state of residence (%) - Asian
Place of birth - Born in state of residence (%) - Hispanic or Latino
Place of birth - Born in state of residence (%) - American Indian and Alaska Native
Place of birth - Born in state of residence (%) - Multirace
Place of birth - Born in state of residence (%) - Other Race
Place of birth - Born in other state (%)
Place of birth - Born in other state (%) - White
Place of birth - Born in other state (%) - Black or African American
Place of birth - Born in other state (%) - Asian
Place of birth - Born in other state (%) - Hispanic or Latino
Place of birth - Born in other state (%) - American Indian and Alaska Native
Place of birth - Born in other state (%) - Multirace
Place of birth - Born in other state (%) - Other Race
Place of birth - Native, outside of US (%)
Place of birth - Native, outside of US (%) - White
Place of birth - Native, outside of US (%) - Black or African American
Place of birth - Native, outside of US (%) - Asian
Place of birth - Native, outside of US (%) - Hispanic or Latino
Place of birth - Native, outside of US (%) - American Indian and Alaska Native
Place of birth - Native, outside of US (%) - Multirace
Place of birth - Native, outside of US (%) - Other Race
Place of birth - Foreign born (%)
Place of birth - Foreign born (%) - White
Place of birth - Foreign born (%) - Black or African American
Place of birth - Foreign born (%) - Asian
Place of birth - Foreign born (%) - Hispanic or Latino
Place of birth - Foreign born (%) - American Indian and Alaska Native
Place of birth - Foreign born (%) - Multirace
Place of birth - Foreign born (%) - Other Race
Residents speaking English at home (%)
Residents speaking English at home - Born in the United States (%)
Residents speaking English at home - Native, born elsewhere (%)
Residents speaking English at home - Foreign born (%)
Residents speaking Spanish at home (%)
Residents speaking Spanish at home - Born in the United States (%)
Residents speaking Spanish at home - Native, born elsewhere (%)
Residents speaking Spanish at home - Foreign born (%)
Residents speaking other language at home (%)
Residents speaking other language at home - Born in the United States (%)
Residents speaking other language at home - Native, born elsewhere (%)
Residents speaking other language at home - Foreign born (%)
Marital status - Never married (%)
Marital status - Now married (%)
Marital status - Separated (%)
Marital status - Widowed (%)
Marital status - Divorced (%)
Ancestries Reported - Arab (%)
Ancestries Reported - Czech (%)
Ancestries Reported - Danish (%)
Ancestries Reported - Dutch (%)
Ancestries Reported - English (%)
Ancestries Reported - French (%)
Ancestries Reported - French Canadian (%)
Ancestries Reported - German (%)
Ancestries Reported - Greek (%)
Ancestries Reported - Hungarian (%)
Ancestries Reported - Irish (%)
Ancestries Reported - Italian (%)
Ancestries Reported - Lithuanian (%)
Ancestries Reported - Norwegian (%)
Ancestries Reported - Polish (%)
Ancestries Reported - Portuguese (%)
Ancestries Reported - Russian (%)
Ancestries Reported - Scotch-Irish (%)
Ancestries Reported - Scottish (%)
Ancestries Reported - Slovak (%)
Ancestries Reported - Subsaharan African (%)
Ancestries Reported - Swedish (%)
Ancestries Reported - Swiss (%)
Ancestries Reported - Ukrainian (%)
Ancestries Reported - United States (%)
Ancestries Reported - Welsh (%)
Ancestries Reported - West Indian (%)
Ancestries Reported - Other (%)
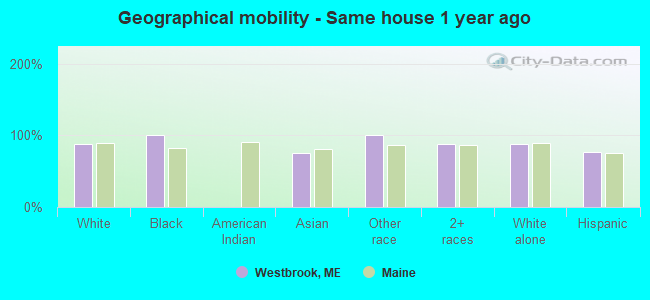
Geographical mobility - Same house 1 year ago (%)
Geographical mobility - Same house 1 year ago (%) - White
Geographical mobility - Same house 1 year ago (%) - Black or African American
Geographical mobility - Same house 1 year ago (%) - Asian
Geographical mobility - Same house 1 year ago (%) - Hispanic or Latino
Geographical mobility - Same house 1 year ago (%) - American Indian and Alaska Native
Geographical mobility - Same house 1 year ago (%) - Multirace
Geographical mobility - Same house 1 year ago (%) - Other Race
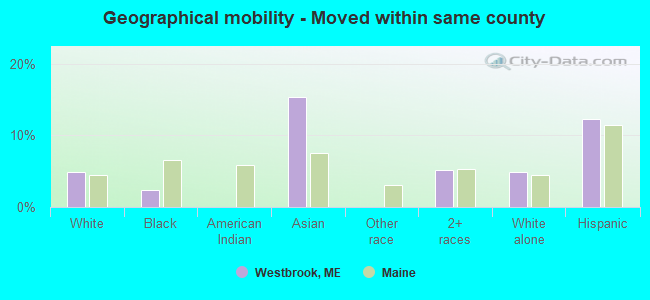
Geographical mobility - Moved within same county (%)
Geographical mobility - Moved within same county (%) - White
Geographical mobility - Moved within same county (%) - Black or African American
Geographical mobility - Moved within same county (%) - Asian
Geographical mobility - Moved within same county (%) - Hispanic or Latino
Geographical mobility - Moved within same county (%) - American Indian and Alaska Native
Geographical mobility - Moved within same county (%) - Multirace
Geographical mobility - Moved within same county (%) - Other Race
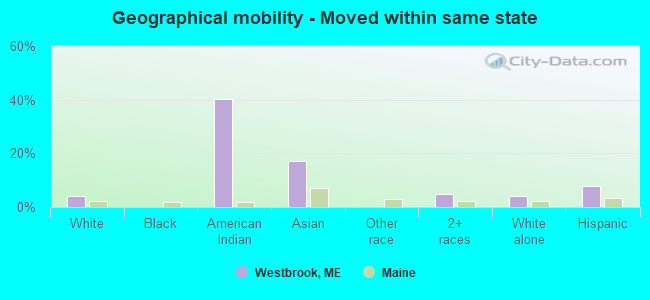
Geographical mobility - Moved from different county within same state (%)
Geographical mobility - Moved from different county within same state (%) - White
Geographical mobility - Moved from different county within same state (%) - Black or African American
Geographical mobility - Moved from different county within same state (%) - Asian
Geographical mobility - Moved from different county within same state (%) - Hispanic or Latino
Geographical mobility - Moved from different county within same state (%) - American Indian and Alaska Native
Geographical mobility - Moved from different county within same state (%) - Multirace
Geographical mobility - Moved from different county within same state (%) - Other Race
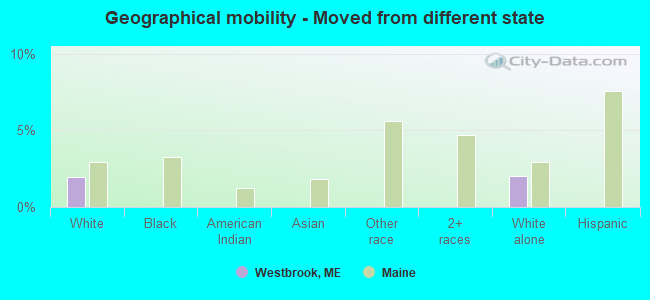
Geographical mobility - Moved from different state (%)
Geographical mobility - Moved from different state (%) - White
Geographical mobility - Moved from different state (%) - Black or African American
Geographical mobility - Moved from different state (%) - Asian
Geographical mobility - Moved from different state (%) - Hispanic or Latino
Geographical mobility - Moved from different state (%) - American Indian and Alaska Native
Geographical mobility - Moved from different state (%) - Multirace
Geographical mobility - Moved from different state (%) - Other Race
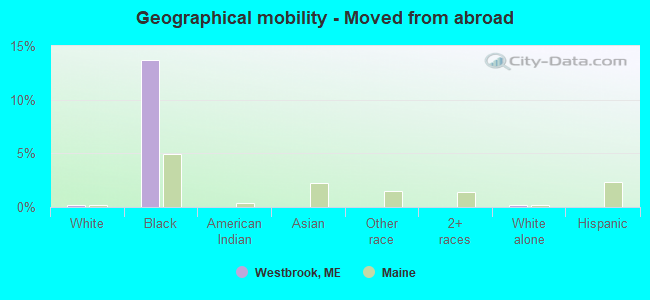
Geographical mobility - Moved from abroad (%)
Geographical mobility - Moved from abroad (%) - White
Geographical mobility - Moved from abroad (%) - Black or African American
Geographical mobility - Moved from abroad (%) - Asian
Geographical mobility - Moved from abroad (%) - Hispanic or Latino
Geographical mobility - Moved from abroad (%) - American Indian and Alaska Native
Geographical mobility - Moved from abroad (%) - Multirace
Geographical mobility - Moved from abroad (%) - Other Race
Place of birth for the foreign-born population - Ireland (%)
Place of birth for the foreign-born population - Denmark (%)
Place of birth for the foreign-born population - Norway (%)
Place of birth for the foreign-born population - Sweden (%)
Place of birth for the foreign-born population - United Kingdom (%)
Place of birth for the foreign-born population - England (%)
Place of birth for the foreign-born population - Scotland (%)
Place of birth for the foreign-born population - Other Northern Europe (%)
Place of birth for the foreign-born population - Austria (%)
Place of birth for the foreign-born population - Belgium (%)
Place of birth for the foreign-born population - France (%)
Place of birth for the foreign-born population - Germany (%)
Place of birth for the foreign-born population - Netherlands (%)
Place of birth for the foreign-born population - Switzerland (%)
Place of birth for the foreign-born population - Other Western Europe (%)
Place of birth for the foreign-born population - Greece (%)
Place of birth for the foreign-born population - Italy (%)
Place of birth for the foreign-born population - Portugal (%)
Place of birth for the foreign-born population - Spain (%)
Place of birth for the foreign-born population - Other Southern Europe (%)
Place of birth for the foreign-born population - Albania (%)
Place of birth for the foreign-born population - Belarus (%)
Place of birth for the foreign-born population - Bosnia and Herzegovina (%)
Place of birth for the foreign-born population - Bulgaria (%)
Place of birth for the foreign-born population - Croatia (%)
Place of birth for the foreign-born population - Czechoslovakia (%)
Place of birth for the foreign-born population - Hungary (%)
Place of birth for the foreign-born population - Latvia (%)
Place of birth for the foreign-born population - Lithuania (%)
Place of birth for the foreign-born population - North Macedonia (Macedonia) (%)
Place of birth for the foreign-born population - Moldova (%)
Place of birth for the foreign-born population - Poland (%)
Place of birth for the foreign-born population - Romania (%)
Place of birth for the foreign-born population - Russia (%)
Place of birth for the foreign-born population - Serbia (%)
Place of birth for the foreign-born population - Ukraine (%)
Place of birth for the foreign-born population - Other Eastern Europe (%)
Place of birth for the foreign-born population - China (%)
Place of birth for the foreign-born population - Hong Kong (%)
Place of birth for the foreign-born population - Taiwan (%)
Place of birth for the foreign-born population - Japan (%)
Place of birth for the foreign-born population - Korea (%)
Place of birth for the foreign-born population - Other Eastern Asia (%)
Place of birth for the foreign-born population - Afghanistan (%)
Place of birth for the foreign-born population - Bangladesh (%)
Place of birth for the foreign-born population - India (%)
Place of birth for the foreign-born population - Iran (%)
Place of birth for the foreign-born population - Kazakhstan (%)
Place of birth for the foreign-born population - Nepal (%)
Place of birth for the foreign-born population - Pakistan (%)
Place of birth for the foreign-born population - Sri Lanka (%)
Place of birth for the foreign-born population - Uzbekistan (%)
Place of birth for the foreign-born population - Other South Central Asia (%)
Place of birth for the foreign-born population - Burma (%)
Place of birth for the foreign-born population - Cambodia (%)
Place of birth for the foreign-born population - Indonesia (%)
Place of birth for the foreign-born population - Laos (%)
Place of birth for the foreign-born population - Malaysia (%)
Place of birth for the foreign-born population - Philippines (%)
Place of birth for the foreign-born population - Singapore (%)
Place of birth for the foreign-born population - Thailand (%)
Place of birth for the foreign-born population - Vietnam (%)
Place of birth for the foreign-born population - Other South Eastern Asia (%)
Place of birth for the foreign-born population - Armenia (%)
Place of birth for the foreign-born population - Iraq (%)
Place of birth for the foreign-born population - Israel (%)
Place of birth for the foreign-born population - Jordan (%)
Place of birth for the foreign-born population - Kuwait (%)
Place of birth for the foreign-born population - Lebanon (%)
Place of birth for the foreign-born population - Saudi Arabia (%)
Place of birth for the foreign-born population - Syria (%)
Place of birth for the foreign-born population - Turkey (%)
Place of birth for the foreign-born population - Yemen (%)
Place of birth for the foreign-born population - Other Western Asia (%)
Place of birth for the foreign-born population - Eritrea (%)
Place of birth for the foreign-born population - Ethiopia (%)
Place of birth for the foreign-born population - Kenya (%)
Place of birth for the foreign-born population - Somalia (%)
Place of birth for the foreign-born population - Uganda (%)
Place of birth for the foreign-born population - Zimbabwe (%)
Place of birth for the foreign-born population - Other Eastern Africa (%)
Place of birth for the foreign-born population - Cameroon (%)
Place of birth for the foreign-born population - Congo (%)
Place of birth for the foreign-born population - Democratic Republic of Congo (Zaire) (%)
Place of birth for the foreign-born population - Other Middle Africa (%)
Place of birth for the foreign-born population - Egypt (%)
Place of birth for the foreign-born population - Morocco (%)
Place of birth for the foreign-born population - Sudan (%)
Place of birth for the foreign-born population - Other Northern Africa (%)
Place of birth for the foreign-born population - South Africa (%)
Place of birth for the foreign-born population - Other Southern Africa (%)
Place of birth for the foreign-born population - Cabo Verde (%)
Place of birth for the foreign-born population - Ghana (%)
Place of birth for the foreign-born population - Liberia (%)
Place of birth for the foreign-born population - Nigeria (%)
Place of birth for the foreign-born population - Senegal (%)
Place of birth for the foreign-born population - Sierra Leone (%)
Place of birth for the foreign-born population - Other Western Africa (%)
Place of birth for the foreign-born population - Australia (%)
Place of birth for the foreign-born population - New Zealand (%)
Place of birth for the foreign-born population - Fiji (%)
Place of birth for the foreign-born population - Micronesia (%)
Place of birth for the foreign-born population - Bahamas (%)
Place of birth for the foreign-born population - Barbados (%)
Place of birth for the foreign-born population - Cuba (%)
Place of birth for the foreign-born population - Dominica (%)
Place of birth for the foreign-born population - Dominican Republic (%)
Place of birth for the foreign-born population - Grenada (%)
Place of birth for the foreign-born population - Haiti (%)
Place of birth for the foreign-born population - Jamaica (%)
Place of birth for the foreign-born population - St. Vincent and the Grenadines (%)
Place of birth for the foreign-born population - Trinidad and Tobago (%)
Place of birth for the foreign-born population - West Indies (%)
Place of birth for the foreign-born population - Other Caribbean (%)
Place of birth for the foreign-born population - Belize (%)
Place of birth for the foreign-born population - Costa Rica (%)
Place of birth for the foreign-born population - El Salvador (%)
Place of birth for the foreign-born population - Guatemala (%)
Place of birth for the foreign-born population - Honduras (%)
Place of birth for the foreign-born population - Mexico (%)
Place of birth for the foreign-born population - Nicaragua (%)
Place of birth for the foreign-born population - Panama (%)
Place of birth for the foreign-born population - Other Central America (%)
Place of birth for the foreign-born population - Argentina (%)
Place of birth for the foreign-born population - Bolivia (%)
Place of birth for the foreign-born population - Brazil (%)
Place of birth for the foreign-born population - Chile (%)
Place of birth for the foreign-born population - Colombia (%)
Place of birth for the foreign-born population - Ecuador (%)
Place of birth for the foreign-born population - Guyana (%)
Place of birth for the foreign-born population - Peru (%)
Place of birth for the foreign-born population - Uruguay (%)
Place of birth for the foreign-born population - Venezuela (%)
Place of birth for the foreign-born population - Other South America (%)
Place of birth for the foreign-born population - Canada (%)
Place of birth for the foreign-born population - Other Northern America (%)
Place of birth for the foreign-born population - Other (%)
Latest news about races in Westbrook, ME collected exclusively by city-data.com from local newspapers, TV, and radio stations
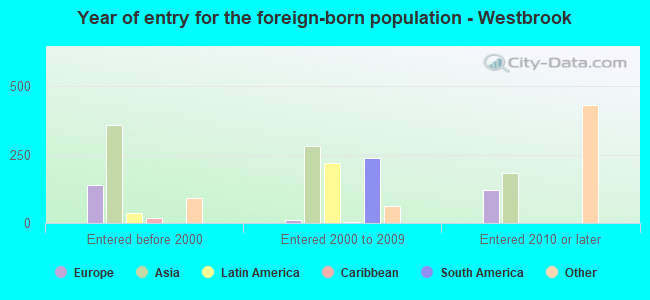
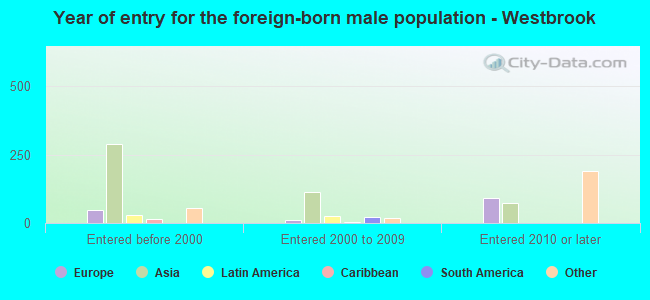
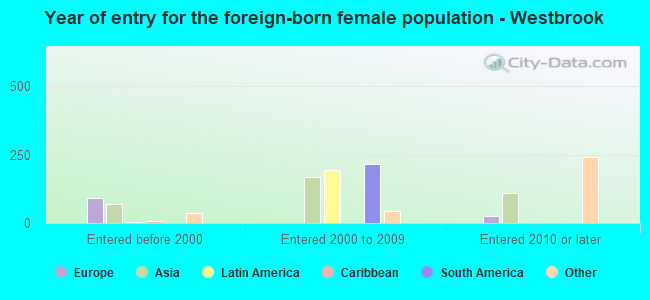
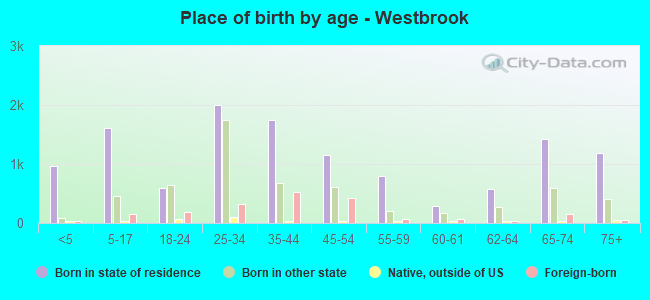
According to 2022 data, the most numerous races in Westbrook, ME are White alone (17,192 residents), Two or more races (1,178 residents), and Hispanic (421 residents). 90.4% of Westbrook residents speak English at home. 8.8% of Westbrook, ME residents are foreign-born (3.7% born in Asia, 2.4% born in Africa, 1.2% born in Latin America, 1.1% born in Europe), which is 65.7% greater than the foreign-born rate of 3.0% across the entire state of Maine.
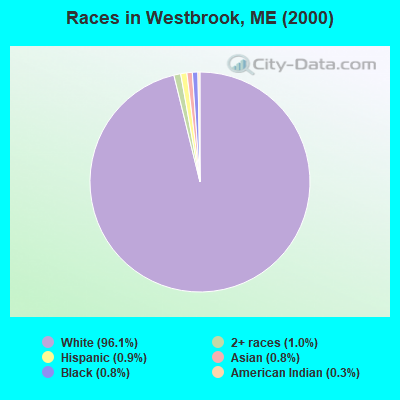
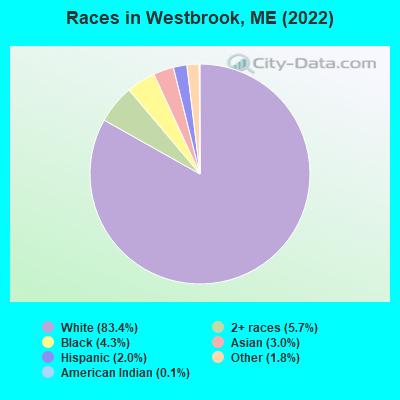
Race distribution in Westbrook
2000 2022
1,230,297 96.5% White alone 11,731 0.9% Two or more races 9,360 0.7% Hispanic 9,014 0.7% Asian alone 6,440 0.5% Black alone 6,911 0.5% American Indian alone 836 0.07% Other race alone 334 0.03% Native Hawaiian and Other
1,249,233 90.2% White alone 58,357 4.2% Two or more races 28,717 2.1% Hispanic 21,583 1.6% Black alone 16,151 1.2% Asian alone 5,873 0.4% Other race alone 5,205 0.4% American Indian alone 221 0.02% Native Hawaiian and Other
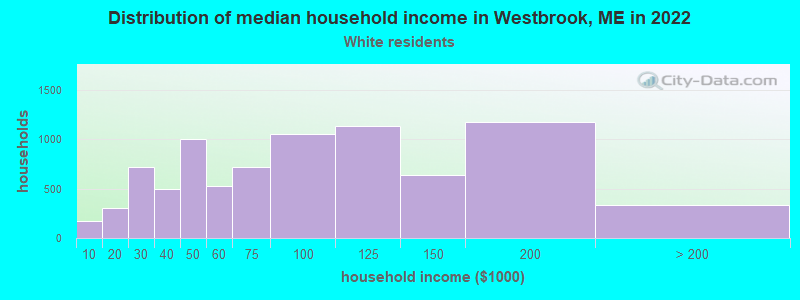
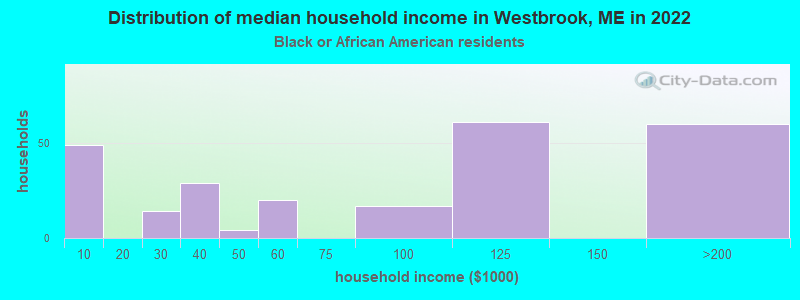
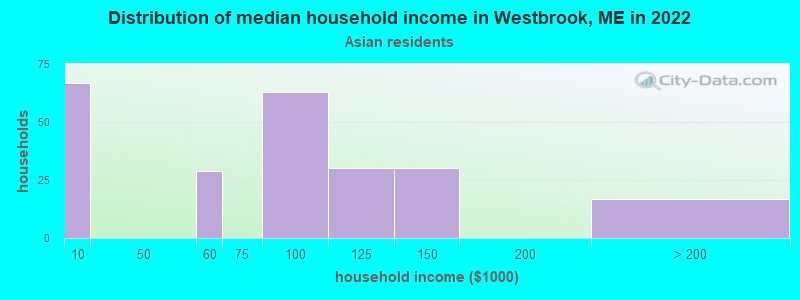
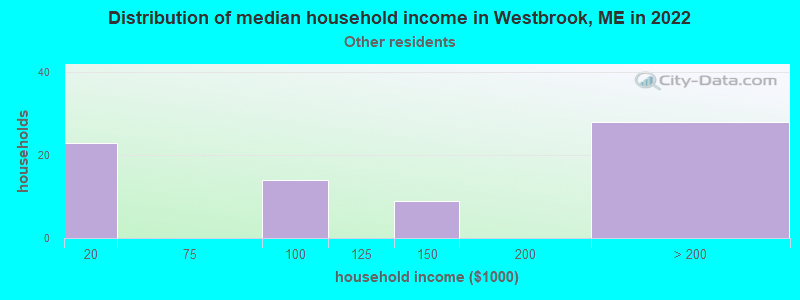
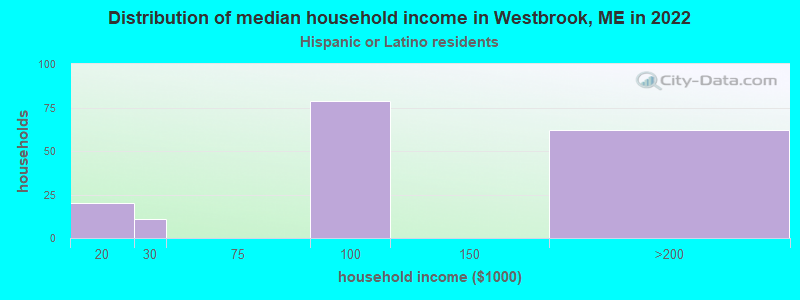
Income and house value in Westbrook Median household income in 2022 $79,232 White non-Hispanic householders$103,173 Black householders$148,646 Asian householders$108,942 Two or more races householdersMedian 2022 house value $360,204 White Non-Hispanic householders$276,081 American Indian or Alaska Native householders $521,955 Asian householders$365,401 Some other race householders$211,120 Two or more races householders$446,601 Hispanic or Latino householders
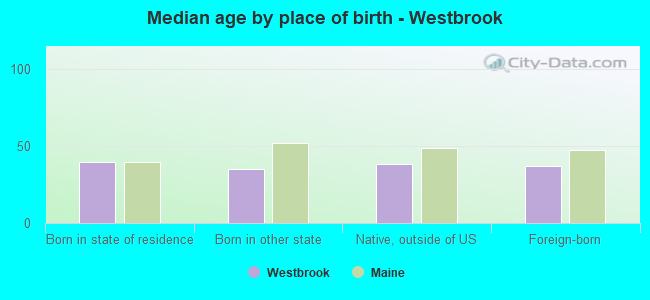
Median age by race in Westbrook
39.3 Median age for White residents38.2 41.7 40.5 Median age for Black or African American residents42.9 30.9 -639,386,188.6 Median age for American Indian / Alaska Native residents-664,907,651.1 -464,646,464.2 46.4 Median age for Asian residents50.2 42.7 -442,352,940.7 Median age for Native Hawaiian / Pacific Islander residents-668,724,279.2 -453,900,708.8 13.0 Median age for Other race residents9.7 13.7 24.6 Median age for Two or more races residents27.6 19.7 40.0 Median age for White alone residents38.6 42.4 21.8 Median age for Hispanic or Latino residents5.7 27.2
Owner/renter occupied households by race in Westbrook
House owners and renters - White residents 5,360 64.4% Owner occupied2,966 35.6% Renter occupiedHouse owners and renters - Black or African American residents 102 35.8% Owner occupied182 64.2% Renter occupiedHouse owners and renters - American Indian / Alaska Native residents 34 100.0% Renter occupiedHouse owners and renters - Asian residents 154 87.1% Owner occupied23 12.9% Renter occupiedHouse owners and renters - Other race residents 36 52.5% Owner occupied33 47.5% Renter occupiedHouse owners and renters - Two or more races residents 215 65.4% Owner occupied114 34.6% Renter occupiedHouse owners and renters - White alone residents 5,314 64.6% Owner occupied2,918 35.4% Renter occupiedHouse owners and renters - Hispanic or Latino residents 55 39.1% Owner occupied85 60.9% Renter occupied
Language usage in Westbrook
English speakers - Total 90.4% of residents of Westbrook speak English at home.
0.8% of residents speak Spanish at home 148 97.4% Speak English very well4 2.6% Speak English less than very well9.1% of residents speak other language at home 1,225 69.0% Speak English very well551 31.0% Speak English less than very well
English speakers - Born in the United States 96.1% of residents of Westbrook speak English at home.
0.3% of residents speak Spanish at home 16 100.0% Speak English very well3.9% of residents speak other language at home 220 100.0% Speak English very well
English speakers - Native, born elsewhere 42.2% of residents of Westbrook speak English at home.
93.0% of residents speak other language at home 204 85.0% Speak English very well36 15.0% Speak English less than very well
English speakers - Foreign-born 25.8% of residents of Westbrook speak English at home.
5.6% of residents speak Spanish at home 118 100.0% Speak English very well67.9% of residents speak other language at home 912 64.1% Speak English very well510 35.9% Speak English less than very well
White (Caucasian) - Speak only English Native:
97.7% (15,556)Foreign-born:
40.6% (393)
White (Caucasian) - Speak another language Native:
2.2% (358)Foreign-born:
60.2% (584)
Black or African American - Speak only English Native:
100.0% (150)Foreign-born:
17.0% (99)
Asian - Speak only English Native:
61.8% (66)Foreign-born:
7.6% (40)
Asian - Speak another language Native:
26.5% (28)Foreign-born:
100.0% (521)
Two or more races - Speak only English Native:
95.6% (1,029)Foreign-born:
100.0% (30)
Two or more races - Speak another language Native:
4.5% (49)Foreign-born:
2.7% (1)
White alone - Speak only English Native:
97.6% (15,451)Foreign-born:
45.6% (332)
White alone - Speak another language Native:
2.4% (376)Foreign-born:
56.1% (409)
Hispanic or Latino - Speak only English Native:
98.2% (150)Foreign-born:
34.0% (48)
Hispanic or Latino - Speak another language Native:
6.4% (10)Foreign-born:
59.3% (84)
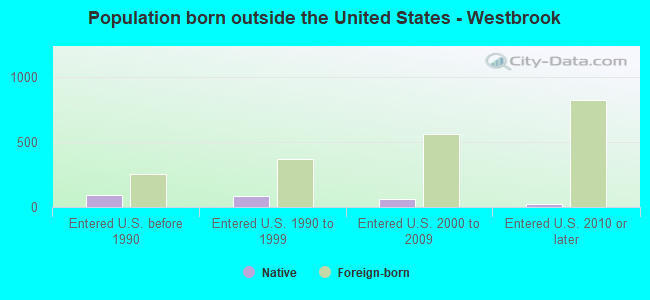
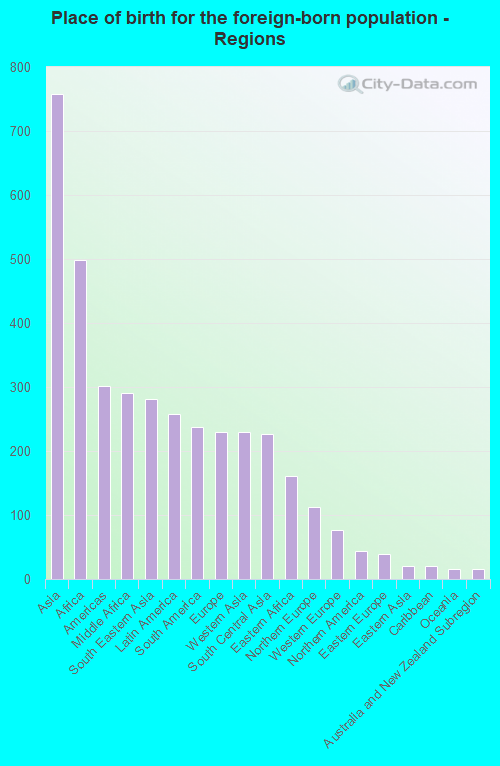
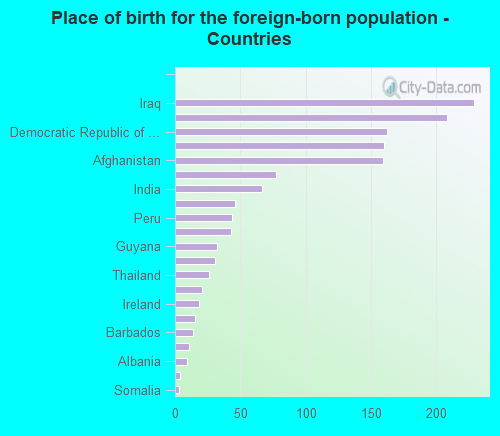
Foreign-born residents in Westbrook 1,804 residents are foreign born (3.7% Asia , 2.4% Africa , 1.2% Latin America , 1.1% Europe ).
Marital status for residents in Westbrook Marital status - White (Caucasian) population 15 years and over
Males 38.8% Never married44.2% Now married0.8% Separated4.2% Widowed12.0% DivorcedFemales 35.7% Never married40.3% Now married1.8% Separated8.5% Widowed13.7% DivorcedWomen who gave birth in the past 12 months Now married:
81.8% (128)Unmarried:
18.2% (29)
Women who did not give birth in the past 12 months Now married:
40.0% (1,719)Unmarried:
60.0% (2,581)
Marital status - Black or African American population 15 years and over
Males 23.2% Never married72.3% Now married0.0% Separated0.0% Widowed4.5% DivorcedFemales 14.3% Never married84.2% Now married0.0% Separated0.0% Widowed1.4% DivorcedWomen who gave birth in the past 12 months Now married:
100.0% (21)Unmarried:
0.0% (0)
Women who did not give birth in the past 12 months Now married:
84.4% (241)Unmarried:
15.6% (45)
Marital status - Asian population 15 years and over
Males 21.6% Never married76.0% Now married0.0% Separated2.4% Widowed0.0% DivorcedFemales 25.8% Never married61.2% Now married0.0% Separated0.0% Widowed13.1% DivorcedWomen who did not give birth in the past 12 months Now married:
55.8% (103)Unmarried:
44.2% (82)
Marital status - Other race population 15 years and over
Males 44.9% Never married55.1% Now married0.0% Separated0.0% Widowed0.0% DivorcedFemales 67.0% Never married21.6% Now married0.0% Separated0.0% Widowed11.3% DivorcedWomen who did not give birth in the past 12 months Now married:
24.4% (28)Unmarried:
75.6% (86)
Marital status - Two or more races population 15 years and over
Males 68.4% Never married23.2% Now married0.0% Separated6.1% Widowed2.4% DivorcedFemales 66.3% Never married27.2% Now married0.0% Separated6.5% Widowed0.0% DivorcedWomen who did not give birth in the past 12 months Now married:
23.3% (91)Unmarried:
76.7% (302)
Marital status - White alone, not Hispanic / Latino population 15 years and over
Males 38.6% Never married44.4% Now married0.8% Separated4.2% Widowed12.1% DivorcedFemales 35.3% Never married40.8% Now married1.9% Separated8.7% Widowed13.4% DivorcedWomen who gave birth in the past 12 months Now married:
81.8% (128)Unmarried:
18.2% (29)
Women who did not give birth in the past 12 months Now married:
40.3% (1,678)Unmarried:
59.7% (2,486)
Marital status - Hispanic or Latino population 15 years and over
Males 100.0% Never married0.0% Now married0.0% Separated0.0% Widowed0.0% DivorcedFemales 52.2% Never married21.1% Now married0.0% Separated0.0% Widowed26.8% DivorcedWomen who did not give birth in the past 12 months Now married:
28.8% (46)Unmarried:
71.2% (114)
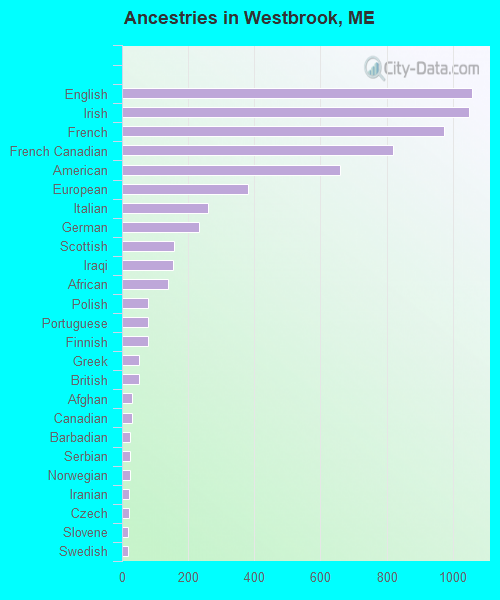
Ancestries in Westbrook
1,057 13.1% English1,049 13.0% Irish975 12.1% French820 10.2% French Canadian660 8.2% American380 4.7% European261 3.2% Italian234 2.9% German158 2.0% Scottish155 1.9% Iraqi139 1.7% African79 1.0% Polish78 1.0% Portuguese78 1.0% Finnish52 0.6% Greek50 0.6% British31 0.4% Afghan30 0.4% Canadian25 0.3% Barbadian24 0.3% Serbian23 0.3% Norwegian20 0.2% Iranian20 0.2% Czech18 0.2% Slovene17 0.2% Swedish16 0.2% Dutch16 0.2% Welsh14 0.2% Australian13 0.2% Austrian9 0.1% Russian9 0.1% Scandinavian6 0.07% Scotch-Irish4 0.05% Trinidadian and Tobagonian1 0.01% British West Indian
Children Nativity (place of birth) in Westbrook
Children under 6 years - Living with two parents Both parents native 401 100.0% NativeBoth parents foreign-born 116 73.9% Native41 26.1% Foreign-bornOne native, one foreign-born parent 305 100.0% NativeChildren under 6 years - Living with one parent Native parent 410 100.0% NativeForeign-born parent 90 100.0% NativeChildren 6 to 17 years - Living with two parents Both parents native 1,144 100.0% NativeBoth parents foreign-born 84 35.0% Native156 65.0% Foreign-bornOne native, one foreign-born parent 77 100.0% NativeChildren 6 to 17 years - Living with one parent Native parent 275 100.0% NativeForeign-born parent 173 62.7% Native103 37.3% Foreign-born
Grandparents responsible for own grandchildren in Westbrook
Grandparents (30 to 59 years) White / Caucasian 26 49.1% Responsible for grandchildren27 50.9% Not responsible for grandchildrenWhite alone, not Hispanic / Latino 26 49.1% Responsible for grandchildren27 50.9% Not responsible for grandchildrenGrandparents (60 years and over) White / Caucasian 56 52.5% Responsible for grandchildren51 47.5% Not responsible for grandchildrenWhite alone, not Hispanic / Latino 56 52.3% Responsible for grandchildren51 47.7% Not responsible for grandchildren