Races in West Samoset, Florida (FL) Detailed Stats
Data:
Races - White alone (%)
Races - White alone (% change since 2000)
Races - Black alone (%)
Races - Black alone (% change since 2000)
Races - American Indian alone (%)
Races - American Indian alone (% change since 2000)
Races - Asian alone (%)
Races - Asian alone (% change since 2000)
Races - Hispanic (%)
Races - Hispanic (% change since 2000)
Races - Native Hawaiian and Other Pacific Islander alone (%)
Races - Native Hawaiian and Other Pacific Islander alone (% change since 2000)
Races - Two or more races(%)
Races - Two or more races(% change since 2000)
Races - Other race alone (%)
Races - Other race alone (% change since 2000)
Racial diversity
Place of birth - Born in state of residence (%)
Place of birth - Born in state of residence (%) - White
Place of birth - Born in state of residence (%) - Black or African American
Place of birth - Born in state of residence (%) - Asian
Place of birth - Born in state of residence (%) - Hispanic or Latino
Place of birth - Born in state of residence (%) - American Indian and Alaska Native
Place of birth - Born in state of residence (%) - Multirace
Place of birth - Born in state of residence (%) - Other Race
Place of birth - Born in other state (%)
Place of birth - Born in other state (%) - White
Place of birth - Born in other state (%) - Black or African American
Place of birth - Born in other state (%) - Asian
Place of birth - Born in other state (%) - Hispanic or Latino
Place of birth - Born in other state (%) - American Indian and Alaska Native
Place of birth - Born in other state (%) - Multirace
Place of birth - Born in other state (%) - Other Race
Place of birth - Native, outside of US (%)
Place of birth - Native, outside of US (%) - White
Place of birth - Native, outside of US (%) - Black or African American
Place of birth - Native, outside of US (%) - Asian
Place of birth - Native, outside of US (%) - Hispanic or Latino
Place of birth - Native, outside of US (%) - American Indian and Alaska Native
Place of birth - Native, outside of US (%) - Multirace
Place of birth - Native, outside of US (%) - Other Race
Place of birth - Foreign born (%)
Place of birth - Foreign born (%) - White
Place of birth - Foreign born (%) - Black or African American
Place of birth - Foreign born (%) - Asian
Place of birth - Foreign born (%) - Hispanic or Latino
Place of birth - Foreign born (%) - American Indian and Alaska Native
Place of birth - Foreign born (%) - Multirace
Place of birth - Foreign born (%) - Other Race
Residents speaking English at home (%)
Residents speaking English at home - Born in the United States (%)
Residents speaking English at home - Native, born elsewhere (%)
Residents speaking English at home - Foreign born (%)
Residents speaking Spanish at home (%)
Residents speaking Spanish at home - Born in the United States (%)
Residents speaking Spanish at home - Native, born elsewhere (%)
Residents speaking Spanish at home - Foreign born (%)
Residents speaking other language at home (%)
Residents speaking other language at home - Born in the United States (%)
Residents speaking other language at home - Native, born elsewhere (%)
Residents speaking other language at home - Foreign born (%)
Marital status - Never married (%)
Marital status - Now married (%)
Marital status - Separated (%)
Marital status - Widowed (%)
Marital status - Divorced (%)
Ancestries Reported - Arab (%)
Ancestries Reported - Czech (%)
Ancestries Reported - Danish (%)
Ancestries Reported - Dutch (%)
Ancestries Reported - English (%)
Ancestries Reported - French (%)
Ancestries Reported - French Canadian (%)
Ancestries Reported - German (%)
Ancestries Reported - Greek (%)
Ancestries Reported - Hungarian (%)
Ancestries Reported - Irish (%)
Ancestries Reported - Italian (%)
Ancestries Reported - Lithuanian (%)
Ancestries Reported - Norwegian (%)
Ancestries Reported - Polish (%)
Ancestries Reported - Portuguese (%)
Ancestries Reported - Russian (%)
Ancestries Reported - Scotch-Irish (%)
Ancestries Reported - Scottish (%)
Ancestries Reported - Slovak (%)
Ancestries Reported - Subsaharan African (%)
Ancestries Reported - Swedish (%)
Ancestries Reported - Swiss (%)
Ancestries Reported - Ukrainian (%)
Ancestries Reported - United States (%)
Ancestries Reported - Welsh (%)
Ancestries Reported - West Indian (%)
Ancestries Reported - Other (%)
Geographical mobility - Same house 1 year ago (%)
Geographical mobility - Same house 1 year ago (%) - White
Geographical mobility - Same house 1 year ago (%) - Black or African American
Geographical mobility - Same house 1 year ago (%) - Asian
Geographical mobility - Same house 1 year ago (%) - Hispanic or Latino
Geographical mobility - Same house 1 year ago (%) - American Indian and Alaska Native
Geographical mobility - Same house 1 year ago (%) - Multirace
Geographical mobility - Same house 1 year ago (%) - Other Race
Geographical mobility - Moved within same county (%)
Geographical mobility - Moved within same county (%) - White
Geographical mobility - Moved within same county (%) - Black or African American
Geographical mobility - Moved within same county (%) - Asian
Geographical mobility - Moved within same county (%) - Hispanic or Latino
Geographical mobility - Moved within same county (%) - American Indian and Alaska Native
Geographical mobility - Moved within same county (%) - Multirace
Geographical mobility - Moved within same county (%) - Other Race
Geographical mobility - Moved from different county within same state (%)
Geographical mobility - Moved from different county within same state (%) - White
Geographical mobility - Moved from different county within same state (%) - Black or African American
Geographical mobility - Moved from different county within same state (%) - Asian
Geographical mobility - Moved from different county within same state (%) - Hispanic or Latino
Geographical mobility - Moved from different county within same state (%) - American Indian and Alaska Native
Geographical mobility - Moved from different county within same state (%) - Multirace
Geographical mobility - Moved from different county within same state (%) - Other Race
Geographical mobility - Moved from different state (%)
Geographical mobility - Moved from different state (%) - White
Geographical mobility - Moved from different state (%) - Black or African American
Geographical mobility - Moved from different state (%) - Asian
Geographical mobility - Moved from different state (%) - Hispanic or Latino
Geographical mobility - Moved from different state (%) - American Indian and Alaska Native
Geographical mobility - Moved from different state (%) - Multirace
Geographical mobility - Moved from different state (%) - Other Race
Geographical mobility - Moved from abroad (%)
Geographical mobility - Moved from abroad (%) - White
Geographical mobility - Moved from abroad (%) - Black or African American
Geographical mobility - Moved from abroad (%) - Asian
Geographical mobility - Moved from abroad (%) - Hispanic or Latino
Geographical mobility - Moved from abroad (%) - American Indian and Alaska Native
Geographical mobility - Moved from abroad (%) - Multirace
Geographical mobility - Moved from abroad (%) - Other Race
Place of birth for the foreign-born population - Ireland (%)
Place of birth for the foreign-born population - Denmark (%)
Place of birth for the foreign-born population - Norway (%)
Place of birth for the foreign-born population - Sweden (%)
Place of birth for the foreign-born population - United Kingdom (%)
Place of birth for the foreign-born population - England (%)
Place of birth for the foreign-born population - Scotland (%)
Place of birth for the foreign-born population - Other Northern Europe (%)
Place of birth for the foreign-born population - Austria (%)
Place of birth for the foreign-born population - Belgium (%)
Place of birth for the foreign-born population - France (%)
Place of birth for the foreign-born population - Germany (%)
Place of birth for the foreign-born population - Netherlands (%)
Place of birth for the foreign-born population - Switzerland (%)
Place of birth for the foreign-born population - Other Western Europe (%)
Place of birth for the foreign-born population - Greece (%)
Place of birth for the foreign-born population - Italy (%)
Place of birth for the foreign-born population - Portugal (%)
Place of birth for the foreign-born population - Spain (%)
Place of birth for the foreign-born population - Other Southern Europe (%)
Place of birth for the foreign-born population - Albania (%)
Place of birth for the foreign-born population - Belarus (%)
Place of birth for the foreign-born population - Bosnia and Herzegovina (%)
Place of birth for the foreign-born population - Bulgaria (%)
Place of birth for the foreign-born population - Croatia (%)
Place of birth for the foreign-born population - Czechoslovakia (%)
Place of birth for the foreign-born population - Hungary (%)
Place of birth for the foreign-born population - Latvia (%)
Place of birth for the foreign-born population - Lithuania (%)
Place of birth for the foreign-born population - North Macedonia (Macedonia) (%)
Place of birth for the foreign-born population - Moldova (%)
Place of birth for the foreign-born population - Poland (%)
Place of birth for the foreign-born population - Romania (%)
Place of birth for the foreign-born population - Russia (%)
Place of birth for the foreign-born population - Serbia (%)
Place of birth for the foreign-born population - Ukraine (%)
Place of birth for the foreign-born population - Other Eastern Europe (%)
Place of birth for the foreign-born population - China (%)
Place of birth for the foreign-born population - Hong Kong (%)
Place of birth for the foreign-born population - Taiwan (%)
Place of birth for the foreign-born population - Japan (%)
Place of birth for the foreign-born population - Korea (%)
Place of birth for the foreign-born population - Other Eastern Asia (%)
Place of birth for the foreign-born population - Afghanistan (%)
Place of birth for the foreign-born population - Bangladesh (%)
Place of birth for the foreign-born population - India (%)
Place of birth for the foreign-born population - Iran (%)
Place of birth for the foreign-born population - Kazakhstan (%)
Place of birth for the foreign-born population - Nepal (%)
Place of birth for the foreign-born population - Pakistan (%)
Place of birth for the foreign-born population - Sri Lanka (%)
Place of birth for the foreign-born population - Uzbekistan (%)
Place of birth for the foreign-born population - Other South Central Asia (%)
Place of birth for the foreign-born population - Burma (%)
Place of birth for the foreign-born population - Cambodia (%)
Place of birth for the foreign-born population - Indonesia (%)
Place of birth for the foreign-born population - Laos (%)
Place of birth for the foreign-born population - Malaysia (%)
Place of birth for the foreign-born population - Philippines (%)
Place of birth for the foreign-born population - Singapore (%)
Place of birth for the foreign-born population - Thailand (%)
Place of birth for the foreign-born population - Vietnam (%)
Place of birth for the foreign-born population - Other South Eastern Asia (%)
Place of birth for the foreign-born population - Armenia (%)
Place of birth for the foreign-born population - Iraq (%)
Place of birth for the foreign-born population - Israel (%)
Place of birth for the foreign-born population - Jordan (%)
Place of birth for the foreign-born population - Kuwait (%)
Place of birth for the foreign-born population - Lebanon (%)
Place of birth for the foreign-born population - Saudi Arabia (%)
Place of birth for the foreign-born population - Syria (%)
Place of birth for the foreign-born population - Turkey (%)
Place of birth for the foreign-born population - Yemen (%)
Place of birth for the foreign-born population - Other Western Asia (%)
Place of birth for the foreign-born population - Eritrea (%)
Place of birth for the foreign-born population - Ethiopia (%)
Place of birth for the foreign-born population - Kenya (%)
Place of birth for the foreign-born population - Somalia (%)
Place of birth for the foreign-born population - Uganda (%)
Place of birth for the foreign-born population - Zimbabwe (%)
Place of birth for the foreign-born population - Other Eastern Africa (%)
Place of birth for the foreign-born population - Cameroon (%)
Place of birth for the foreign-born population - Congo (%)
Place of birth for the foreign-born population - Democratic Republic of Congo (Zaire) (%)
Place of birth for the foreign-born population - Other Middle Africa (%)
Place of birth for the foreign-born population - Egypt (%)
Place of birth for the foreign-born population - Morocco (%)
Place of birth for the foreign-born population - Sudan (%)
Place of birth for the foreign-born population - Other Northern Africa (%)
Place of birth for the foreign-born population - South Africa (%)
Place of birth for the foreign-born population - Other Southern Africa (%)
Place of birth for the foreign-born population - Cabo Verde (%)
Place of birth for the foreign-born population - Ghana (%)
Place of birth for the foreign-born population - Liberia (%)
Place of birth for the foreign-born population - Nigeria (%)
Place of birth for the foreign-born population - Senegal (%)
Place of birth for the foreign-born population - Sierra Leone (%)
Place of birth for the foreign-born population - Other Western Africa (%)
Place of birth for the foreign-born population - Australia (%)
Place of birth for the foreign-born population - New Zealand (%)
Place of birth for the foreign-born population - Fiji (%)
Place of birth for the foreign-born population - Micronesia (%)
Place of birth for the foreign-born population - Bahamas (%)
Place of birth for the foreign-born population - Barbados (%)
Place of birth for the foreign-born population - Cuba (%)
Place of birth for the foreign-born population - Dominica (%)
Place of birth for the foreign-born population - Dominican Republic (%)
Place of birth for the foreign-born population - Grenada (%)
Place of birth for the foreign-born population - Haiti (%)
Place of birth for the foreign-born population - Jamaica (%)
Place of birth for the foreign-born population - St. Vincent and the Grenadines (%)
Place of birth for the foreign-born population - Trinidad and Tobago (%)
Place of birth for the foreign-born population - West Indies (%)
Place of birth for the foreign-born population - Other Caribbean (%)
Place of birth for the foreign-born population - Belize (%)
Place of birth for the foreign-born population - Costa Rica (%)
Place of birth for the foreign-born population - El Salvador (%)
Place of birth for the foreign-born population - Guatemala (%)
Place of birth for the foreign-born population - Honduras (%)
Place of birth for the foreign-born population - Mexico (%)
Place of birth for the foreign-born population - Nicaragua (%)
Place of birth for the foreign-born population - Panama (%)
Place of birth for the foreign-born population - Other Central America (%)
Place of birth for the foreign-born population - Argentina (%)
Place of birth for the foreign-born population - Bolivia (%)
Place of birth for the foreign-born population - Brazil (%)
Place of birth for the foreign-born population - Chile (%)
Place of birth for the foreign-born population - Colombia (%)
Place of birth for the foreign-born population - Ecuador (%)
Place of birth for the foreign-born population - Guyana (%)
Place of birth for the foreign-born population - Peru (%)
Place of birth for the foreign-born population - Uruguay (%)
Place of birth for the foreign-born population - Venezuela (%)
Place of birth for the foreign-born population - Other South America (%)
Place of birth for the foreign-born population - Canada (%)
Place of birth for the foreign-born population - Other Northern America (%)
Place of birth for the foreign-born population - Other (%)
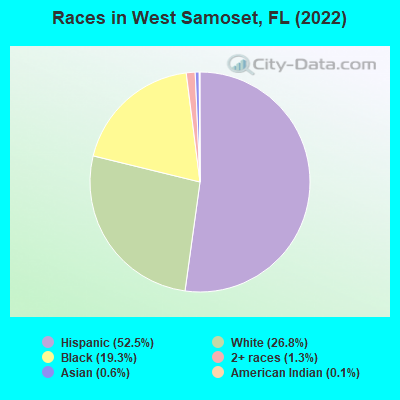
According to 2022 data, the most numerous races in West Samoset, FL are White alone (1,983 residents), Hispanic (3,886 residents), and Black alone (1,428 residents). 43.6% of West Samoset residents speak English at home. 27.2% of West Samoset, FL residents are foreign-born (26.1% born in Latin America), which is 22.9% greater than the foreign-born rate of 21.0% across the entire state of Florida.
Race distribution in West Samoset
2000 2022
10,458,509 65.4% White alone 2,682,715 16.8% Hispanic 2,264,268 14.2% Black alone 261,693 1.6% Asian alone 236,954 1.5% Two or more races 42,358 0.3% American Indian alone 28,994 0.2% Other race alone 6,887 0.04% Native Hawaiian and Other
11,309,403 50.8% White alone 6,025,039 27.1% Hispanic 3,241,015 14.6% Black alone 861,630 3.9% Two or more races 623,692 2.8% Asian alone 152,054 0.7% Other race alone 22,504 0.1% American Indian alone 9,486 0.04% Native Hawaiian and Other
Income and house value in West Samoset Median household income in 2022 $30,168 White non-Hispanic householders$44,188 Black householders$22,353 Some other race householders$67,265 Two or more races householders$53,846 Hispanic or Latino race householdersMedian 2022 house value $198,833 White Non-Hispanic householders$262,949 Black or African American householders$223,687 Some other race householders$270,154 Two or more races householders$262,589 Hispanic or Latino householders
Median age by race in West Samoset
31.7 Median age for White residents32.0 31.5 28.8 Median age for Black or African American residents38.1 27.5 45.6 Median age for American Indian / Alaska Native residents-611,418,047.3 -594,925,633.7 -698,412,697.7 Median age for Asian residents-815,173,526.2 -642,479,213.3 -679,849,340.2 Median age for Native Hawaiian / Pacific Islander residents-858,307,848.3 -443,298,968.6 32.5 Median age for Other race residents41.0 20.5 39.0 Median age for Two or more races residents34.0 48.9 31.2 Median age for White alone residents31.2 33.8 29.9 Median age for Hispanic or Latino residents35.7 24.9
Owner/renter occupied households by race in West Samoset
House owners and renters - White residents 586 50.6% Owner occupied572 49.4% Renter occupiedHouse owners and renters - Black or African American residents 196 40.1% Owner occupied293 59.9% Renter occupiedHouse owners and renters - American Indian / Alaska Native residents 24 31.9% Owner occupied51 68.1% Renter occupiedHouse owners and renters - Asian residents 19 100.0% Owner occupiedHouse owners and renters - Other race residents 112 61.8% Owner occupied69 38.2% Renter occupiedHouse owners and renters - Two or more races residents 414 82.2% Owner occupied90 17.8% Renter occupiedHouse owners and renters - White alone residents 470 58.5% Owner occupied333 41.5% Renter occupiedHouse owners and renters - Hispanic or Latino residents 539 53.6% Owner occupied468 46.4% Renter occupied
Language usage in West Samoset
English speakers - Total 43.6% of residents of West Samoset speak English at home.
44.8% of residents speak Spanish at home 1,522 48.5% Speak English very well1,617 51.5% Speak English less than very well8.6% of residents speak other language at home 438 72.4% Speak English very well167 27.6% Speak English less than very well
English speakers - Born in the United States 85.5% of residents of West Samoset speak English at home.
13.7% of residents speak Spanish at home 202 95.3% Speak English very well10 4.7% Speak English less than very well0.8% of residents speak other language at home 12 100.0% Speak English very well
English speakers - Native, born elsewhere 58.9% of residents of West Samoset speak English at home.
51.0% of residents speak Spanish at home 23 17.2% Speak English very well111 82.8% Speak English less than very well
English speakers - Foreign-born 2.2% of residents of West Samoset speak English at home.
80.6% of residents speak Spanish at home 185 11.4% Speak English very well1,436 88.6% Speak English less than very well11.4% of residents speak other language at home 47 20.5% Speak English very well182 79.5% Speak English less than very well
White (Caucasian) - Speak only English Native:
65.9% (1,794)Foreign-born:
2.2% (12)
White (Caucasian) - Speak another language Native:
22.9% (624)Foreign-born:
81.4% (423)
Black or African American - Speak only English Native:
72.4% (947)Foreign-born:
10.5% (15)
Black or African American - Speak another language Native:
41.8% (546)Foreign-born:
100.0% (145)
American Indian / Alaska Native - Speak another language Native:
87.5% (54)Foreign-born:
100.0% (125)
Other race - Speak another language Native:
79.5% (215)Foreign-born:
95.6% (251)
Two or more races - Speak another language Native:
89.0% (674)Foreign-born:
96.5% (1,234)
White alone - Speak only English Native:
96.4% (1,747)Foreign-born:
22.0% (12)
White alone - Speak another language Native:
3.8% (68)Foreign-born:
80.4% (42)
Hispanic or Latino - Speak another language Native:
75.0% (1,455)Foreign-born:
95.2% (1,592)
Foreign-born residents in West Samoset 2,016 residents are foreign born (26.1% Latin America ).
This city:
27.2%Florida:
21.1%
Marital status for residents in West Samoset Marital status - White (Caucasian) population 15 years and over
Males 36.1% Never married31.8% Now married4.1% Separated0.6% Widowed27.4% DivorcedFemales 23.5% Never married41.0% Now married3.3% Separated20.5% Widowed11.7% DivorcedWomen who gave birth in the past 12 months Now married:
68.9% (130)Unmarried:
31.1% (59)
Women who did not give birth in the past 12 months Now married:
43.8% (290)Unmarried:
56.2% (372)
Marital status - Black or African American population 15 years and over
Males 39.2% Never married44.7% Now married1.7% Separated7.6% Widowed6.8% DivorcedFemales 58.0% Never married27.9% Now married0.0% Separated1.6% Widowed12.4% DivorcedWomen who gave birth in the past 12 months Now married:
100.0% (18)Unmarried:
0.0% (0)
Women who did not give birth in the past 12 months Now married:
8.2% (34)Unmarried:
91.8% (380)
Marital status - American Indian / Alaska Native population 15 years and over
Males 0.0% Never married100.0% Now married0.0% Separated0.0% Widowed0.0% DivorcedFemales 51.9% Never married48.1% Now married0.0% Separated0.0% Widowed0.0% DivorcedWomen who did not give birth in the past 12 months Now married:
0.0% (0)Unmarried:
100.0% (46)
Marital status - Asian population 15 years and over
Males 0.0% Never married100.0% Now married0.0% Separated0.0% Widowed0.0% DivorcedFemales 0.0% Never married100.0% Now married0.0% Separated0.0% Widowed0.0% DivorcedMarital status - Other race population 15 years and over
Males 54.6% Never married45.4% Now married0.0% Separated0.0% Widowed0.0% DivorcedFemales 56.1% Never married33.3% Now married0.0% Separated0.0% Widowed10.6% DivorcedWomen who did not give birth in the past 12 months Now married:
33.3% (75)Unmarried:
66.7% (150)
Marital status - Two or more races population 15 years and over
Males 72.8% Never married8.7% Now married17.2% Separated0.0% Widowed1.2% DivorcedFemales 55.4% Never married7.2% Now married14.2% Separated0.0% Widowed23.2% DivorcedWomen who did not give birth in the past 12 months Now married:
0.0% (0)Unmarried:
100.0% (276)
Marital status - White alone, not Hispanic / Latino population 15 years and over
Males 25.3% Never married18.8% Now married7.5% Separated1.1% Widowed47.3% DivorcedFemales 8.6% Never married35.3% Now married3.9% Separated33.4% Widowed18.8% DivorcedWomen who gave birth in the past 12 months Now married:
100.0% (140)Unmarried:
0.0% (0)
Women who did not give birth in the past 12 months Now married:
28.9% (75)Unmarried:
71.1% (183)
Marital status - Hispanic or Latino population 15 years and over
Males 59.9% Never married30.3% Now married8.2% Separated0.0% Widowed1.6% DivorcedFemales 51.9% Never married32.7% Now married5.4% Separated0.9% Widowed9.1% DivorcedWomen who gave birth in the past 12 months Now married:
0.0% (0)Unmarried:
100.0% (65)
Women who did not give birth in the past 12 months Now married:
33.1% (310)Unmarried:
66.9% (628)
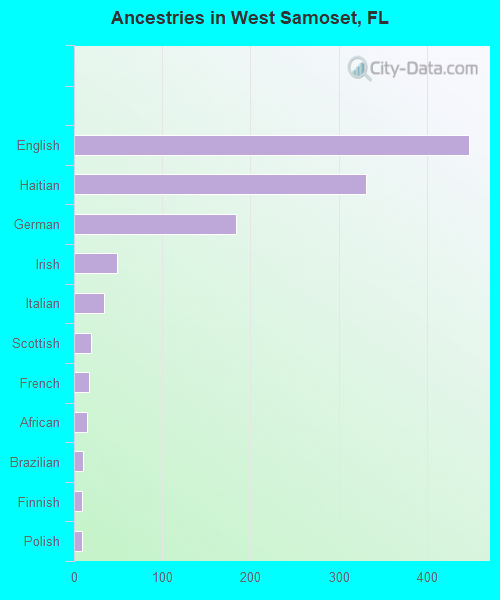
Ancestries in West Samoset
448 8.8% English331 6.5% Haitian184 3.6% German49 1.0% Irish34 0.7% Italian19 0.4% Scottish17 0.3% French15 0.3% African10 0.2% Brazilian9 0.2% Finnish9 0.2% Polish
Children Nativity (place of birth) in West Samoset
Children under 6 years - Living with two parents Both parents native 24 100.0% NativeBoth parents foreign-born 120 100.0% NativeOne native, one foreign-born parent 17 100.0% NativeChildren under 6 years - Living with one parent Native parent 169 100.0% NativeForeign-born parent 96 100.0% NativeChildren 6 to 17 years - Living with two parents Both parents foreign-born 701 100.0% NativeOne native, one foreign-born parent 25 100.0% NativeChildren 6 to 17 years - Living with one parent Native parent 180 100.0% NativeForeign-born parent 325 53.0% Native287 47.0% Foreign-born
Grandparents responsible for own grandchildren in West Samoset
Grandparents (30 to 59 years) White / Caucasian 57 100.0% Not responsible for grandchildrenBlack or African American 35 40.1% Responsible for grandchildren52 59.9% Not responsible for grandchildrenOther race 10 100.0% Not responsible for grandchildrenWhite alone, not Hispanic / Latino 35 100.0% Not responsible for grandchildrenHispanic or Latino 40 100.0% Not responsible for grandchildrenGrandparents (60 years and over) White / Caucasian 6 100.0% Not responsible for grandchildrenBlack or African American 35 43.5% Responsible for grandchildren46 56.5% Not responsible for grandchildrenWhite alone, not Hispanic / Latino 6 100.0% Not responsible for grandchildren