Races in West River, Wyoming (WY) Detailed Stats
Ancestries, Foreign-born residents, place of birth

Discuss West River, Wyoming races on our local forum with over 2,400,000 registered users
1.6% of West River, WY residents are foreign-born , which is 92.6% less than the foreign-born rate of 3.0% across the entire state of Wyoming.
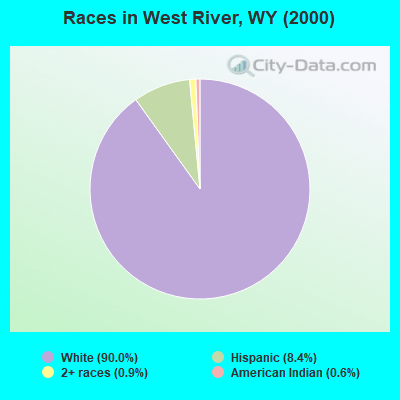
Race distribution in West River

- 28990.0%White alone
- 278.4%Hispanic
- 30.9%Two or more races
- 20.6%American Indian alone
2000
2022
-
- 438,79988.9%White alone
- 31,6696.4%Hispanic
- 10,2382.1%American Indian alone
- 6,1641.2%Two or more races
- 3,5040.7%Black alone
- 2,6700.5%Asian alone
- 4740.10%Other race alone
- 2640.05%Native Hawaiian and Other
Pacific Islander alone

-
- 473,22081.4%White alone
- 62,80310.8%Hispanic
- 22,9113.9%Two or more races
- 9,5891.6%American Indian alone
- 4,9970.9%Other race alone
- 3,9900.7%Black alone
- 3,5770.6%Asian alone
- 2940.05%Native Hawaiian and Other
Pacific Islander alone

Income and house value in West River
- Median household income in 2022
- $89,004White non-Hispanic householders
- $107,193Some other race householders
- $93,702Hispanic or Latino race householders
- Median 2022 house value
- $377,249White Non-Hispanic householders
- $291,087Some other race householders
- $291,087Hispanic or Latino householders
Household income for White non-Hispanic householders

Household income for Hispanic or Latino race householders

Foreign-born residents in West River
5 residents are foreign born
| This city: | 1.6% |
| Wyoming: | 2.3% |
Ancestries in West River

- 10828.8%German
- 7820.8%English
- 5213.9%Other
- 369.6%French
- 328.5%Portuguese
- 215.6%Irish
- 112.9%Danish
- 82.1%Norwegian
- 82.1%United States
- 71.9%Scottish
- 61.6%Polish
- 41.1%Greek
- 41.1%Swedish

Zip codes: 82401.