Races in West Hempstead, New York (NY) Detailed Stats
Data:
Races - White alone (%)
Races - White alone (% change since 2000)
Races - Black alone (%)
Races - Black alone (% change since 2000)
Races - American Indian alone (%)
Races - American Indian alone (% change since 2000)
Races - Asian alone (%)
Races - Asian alone (% change since 2000)
Races - Hispanic (%)
Races - Hispanic (% change since 2000)
Races - Native Hawaiian and Other Pacific Islander alone (%)
Races - Native Hawaiian and Other Pacific Islander alone (% change since 2000)
Races - Two or more races(%)
Races - Two or more races(% change since 2000)
Races - Other race alone (%)
Races - Other race alone (% change since 2000)
Racial diversity
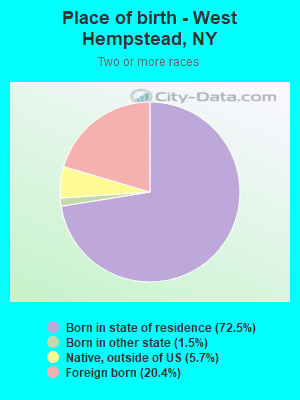
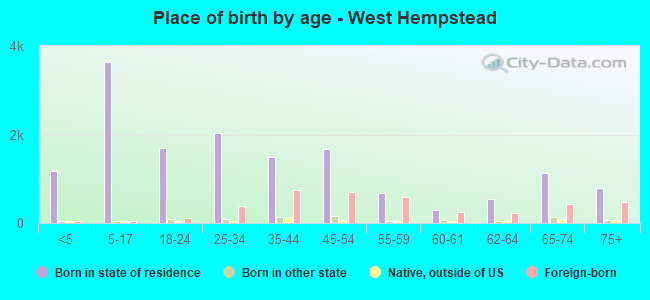
Place of birth - Born in state of residence (%)
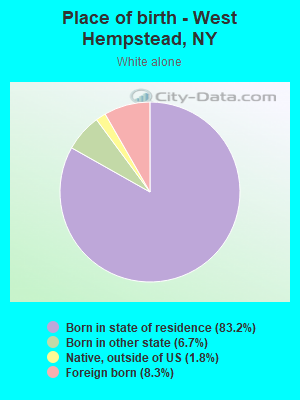
Place of birth - Born in state of residence (%) - White
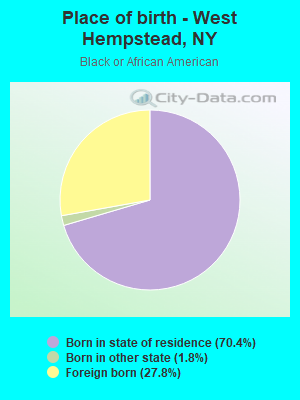
Place of birth - Born in state of residence (%) - Black or African American
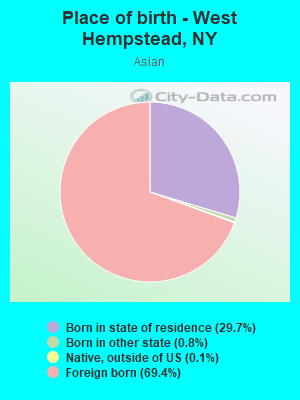
Place of birth - Born in state of residence (%) - Asian
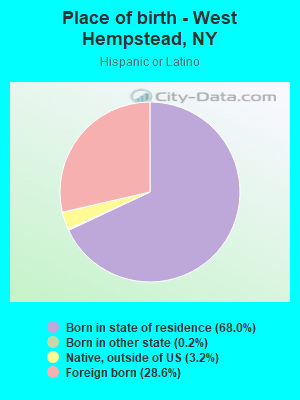
Place of birth - Born in state of residence (%) - Hispanic or Latino
Place of birth - Born in state of residence (%) - American Indian and Alaska Native
Place of birth - Born in state of residence (%) - Multirace
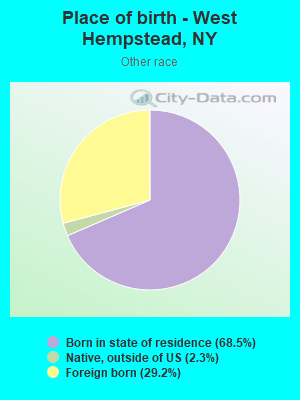
Place of birth - Born in state of residence (%) - Other Race
Place of birth - Born in other state (%)
Place of birth - Born in other state (%) - White
Place of birth - Born in other state (%) - Black or African American
Place of birth - Born in other state (%) - Asian
Place of birth - Born in other state (%) - Hispanic or Latino
Place of birth - Born in other state (%) - American Indian and Alaska Native
Place of birth - Born in other state (%) - Multirace
Place of birth - Born in other state (%) - Other Race
Place of birth - Native, outside of US (%)
Place of birth - Native, outside of US (%) - White
Place of birth - Native, outside of US (%) - Black or African American
Place of birth - Native, outside of US (%) - Asian
Place of birth - Native, outside of US (%) - Hispanic or Latino
Place of birth - Native, outside of US (%) - American Indian and Alaska Native
Place of birth - Native, outside of US (%) - Multirace
Place of birth - Native, outside of US (%) - Other Race
Place of birth - Foreign born (%)
Place of birth - Foreign born (%) - White
Place of birth - Foreign born (%) - Black or African American
Place of birth - Foreign born (%) - Asian
Place of birth - Foreign born (%) - Hispanic or Latino
Place of birth - Foreign born (%) - American Indian and Alaska Native
Place of birth - Foreign born (%) - Multirace
Place of birth - Foreign born (%) - Other Race
Residents speaking English at home (%)
Residents speaking English at home - Born in the United States (%)
Residents speaking English at home - Native, born elsewhere (%)
Residents speaking English at home - Foreign born (%)
Residents speaking Spanish at home (%)
Residents speaking Spanish at home - Born in the United States (%)
Residents speaking Spanish at home - Native, born elsewhere (%)
Residents speaking Spanish at home - Foreign born (%)
Residents speaking other language at home (%)
Residents speaking other language at home - Born in the United States (%)
Residents speaking other language at home - Native, born elsewhere (%)
Residents speaking other language at home - Foreign born (%)
Marital status - Never married (%)
Marital status - Now married (%)
Marital status - Separated (%)
Marital status - Widowed (%)
Marital status - Divorced (%)
Ancestries Reported - Arab (%)
Ancestries Reported - Czech (%)
Ancestries Reported - Danish (%)
Ancestries Reported - Dutch (%)
Ancestries Reported - English (%)
Ancestries Reported - French (%)
Ancestries Reported - French Canadian (%)
Ancestries Reported - German (%)
Ancestries Reported - Greek (%)
Ancestries Reported - Hungarian (%)
Ancestries Reported - Irish (%)
Ancestries Reported - Italian (%)
Ancestries Reported - Lithuanian (%)
Ancestries Reported - Norwegian (%)
Ancestries Reported - Polish (%)
Ancestries Reported - Portuguese (%)
Ancestries Reported - Russian (%)
Ancestries Reported - Scotch-Irish (%)
Ancestries Reported - Scottish (%)
Ancestries Reported - Slovak (%)
Ancestries Reported - Subsaharan African (%)
Ancestries Reported - Swedish (%)
Ancestries Reported - Swiss (%)
Ancestries Reported - Ukrainian (%)
Ancestries Reported - United States (%)
Ancestries Reported - Welsh (%)
Ancestries Reported - West Indian (%)
Ancestries Reported - Other (%)
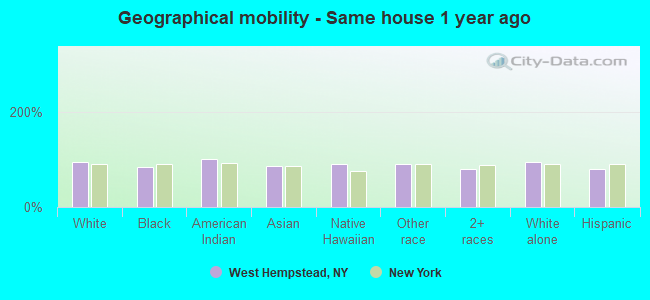
Geographical mobility - Same house 1 year ago (%)
Geographical mobility - Same house 1 year ago (%) - White
Geographical mobility - Same house 1 year ago (%) - Black or African American
Geographical mobility - Same house 1 year ago (%) - Asian
Geographical mobility - Same house 1 year ago (%) - Hispanic or Latino
Geographical mobility - Same house 1 year ago (%) - American Indian and Alaska Native
Geographical mobility - Same house 1 year ago (%) - Multirace
Geographical mobility - Same house 1 year ago (%) - Other Race
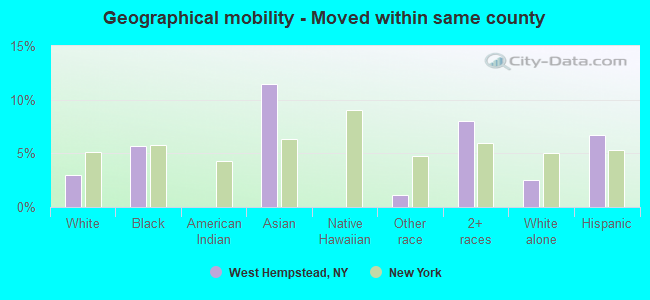
Geographical mobility - Moved within same county (%)
Geographical mobility - Moved within same county (%) - White
Geographical mobility - Moved within same county (%) - Black or African American
Geographical mobility - Moved within same county (%) - Asian
Geographical mobility - Moved within same county (%) - Hispanic or Latino
Geographical mobility - Moved within same county (%) - American Indian and Alaska Native
Geographical mobility - Moved within same county (%) - Multirace
Geographical mobility - Moved within same county (%) - Other Race
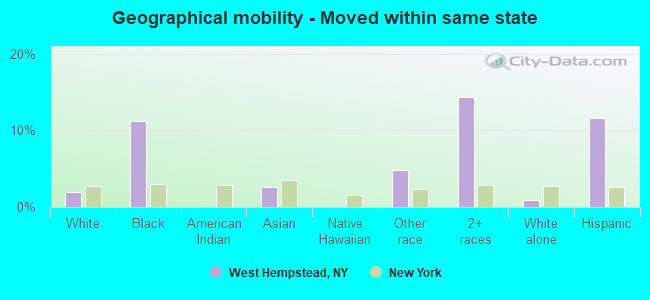
Geographical mobility - Moved from different county within same state (%)
Geographical mobility - Moved from different county within same state (%) - White
Geographical mobility - Moved from different county within same state (%) - Black or African American
Geographical mobility - Moved from different county within same state (%) - Asian
Geographical mobility - Moved from different county within same state (%) - Hispanic or Latino
Geographical mobility - Moved from different county within same state (%) - American Indian and Alaska Native
Geographical mobility - Moved from different county within same state (%) - Multirace
Geographical mobility - Moved from different county within same state (%) - Other Race
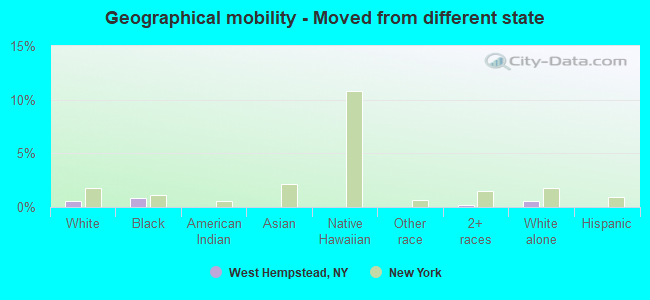
Geographical mobility - Moved from different state (%)
Geographical mobility - Moved from different state (%) - White
Geographical mobility - Moved from different state (%) - Black or African American
Geographical mobility - Moved from different state (%) - Asian
Geographical mobility - Moved from different state (%) - Hispanic or Latino
Geographical mobility - Moved from different state (%) - American Indian and Alaska Native
Geographical mobility - Moved from different state (%) - Multirace
Geographical mobility - Moved from different state (%) - Other Race
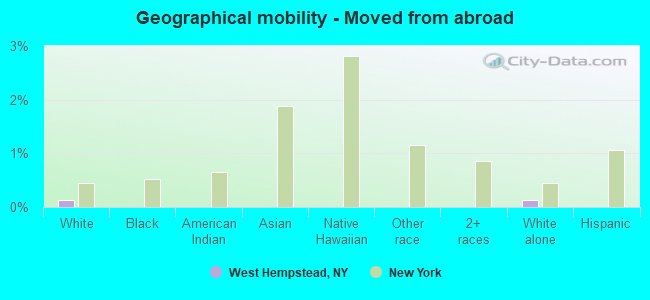
Geographical mobility - Moved from abroad (%)
Geographical mobility - Moved from abroad (%) - White
Geographical mobility - Moved from abroad (%) - Black or African American
Geographical mobility - Moved from abroad (%) - Asian
Geographical mobility - Moved from abroad (%) - Hispanic or Latino
Geographical mobility - Moved from abroad (%) - American Indian and Alaska Native
Geographical mobility - Moved from abroad (%) - Multirace
Geographical mobility - Moved from abroad (%) - Other Race
Place of birth for the foreign-born population - Ireland (%)
Place of birth for the foreign-born population - Denmark (%)
Place of birth for the foreign-born population - Norway (%)
Place of birth for the foreign-born population - Sweden (%)
Place of birth for the foreign-born population - United Kingdom (%)
Place of birth for the foreign-born population - England (%)
Place of birth for the foreign-born population - Scotland (%)
Place of birth for the foreign-born population - Other Northern Europe (%)
Place of birth for the foreign-born population - Austria (%)
Place of birth for the foreign-born population - Belgium (%)
Place of birth for the foreign-born population - France (%)
Place of birth for the foreign-born population - Germany (%)
Place of birth for the foreign-born population - Netherlands (%)
Place of birth for the foreign-born population - Switzerland (%)
Place of birth for the foreign-born population - Other Western Europe (%)
Place of birth for the foreign-born population - Greece (%)
Place of birth for the foreign-born population - Italy (%)
Place of birth for the foreign-born population - Portugal (%)
Place of birth for the foreign-born population - Spain (%)
Place of birth for the foreign-born population - Other Southern Europe (%)
Place of birth for the foreign-born population - Albania (%)
Place of birth for the foreign-born population - Belarus (%)
Place of birth for the foreign-born population - Bosnia and Herzegovina (%)
Place of birth for the foreign-born population - Bulgaria (%)
Place of birth for the foreign-born population - Croatia (%)
Place of birth for the foreign-born population - Czechoslovakia (%)
Place of birth for the foreign-born population - Hungary (%)
Place of birth for the foreign-born population - Latvia (%)
Place of birth for the foreign-born population - Lithuania (%)
Place of birth for the foreign-born population - North Macedonia (Macedonia) (%)
Place of birth for the foreign-born population - Moldova (%)
Place of birth for the foreign-born population - Poland (%)
Place of birth for the foreign-born population - Romania (%)
Place of birth for the foreign-born population - Russia (%)
Place of birth for the foreign-born population - Serbia (%)
Place of birth for the foreign-born population - Ukraine (%)
Place of birth for the foreign-born population - Other Eastern Europe (%)
Place of birth for the foreign-born population - China (%)
Place of birth for the foreign-born population - Hong Kong (%)
Place of birth for the foreign-born population - Taiwan (%)
Place of birth for the foreign-born population - Japan (%)
Place of birth for the foreign-born population - Korea (%)
Place of birth for the foreign-born population - Other Eastern Asia (%)
Place of birth for the foreign-born population - Afghanistan (%)
Place of birth for the foreign-born population - Bangladesh (%)
Place of birth for the foreign-born population - India (%)
Place of birth for the foreign-born population - Iran (%)
Place of birth for the foreign-born population - Kazakhstan (%)
Place of birth for the foreign-born population - Nepal (%)
Place of birth for the foreign-born population - Pakistan (%)
Place of birth for the foreign-born population - Sri Lanka (%)
Place of birth for the foreign-born population - Uzbekistan (%)
Place of birth for the foreign-born population - Other South Central Asia (%)
Place of birth for the foreign-born population - Burma (%)
Place of birth for the foreign-born population - Cambodia (%)
Place of birth for the foreign-born population - Indonesia (%)
Place of birth for the foreign-born population - Laos (%)
Place of birth for the foreign-born population - Malaysia (%)
Place of birth for the foreign-born population - Philippines (%)
Place of birth for the foreign-born population - Singapore (%)
Place of birth for the foreign-born population - Thailand (%)
Place of birth for the foreign-born population - Vietnam (%)
Place of birth for the foreign-born population - Other South Eastern Asia (%)
Place of birth for the foreign-born population - Armenia (%)
Place of birth for the foreign-born population - Iraq (%)
Place of birth for the foreign-born population - Israel (%)
Place of birth for the foreign-born population - Jordan (%)
Place of birth for the foreign-born population - Kuwait (%)
Place of birth for the foreign-born population - Lebanon (%)
Place of birth for the foreign-born population - Saudi Arabia (%)
Place of birth for the foreign-born population - Syria (%)
Place of birth for the foreign-born population - Turkey (%)
Place of birth for the foreign-born population - Yemen (%)
Place of birth for the foreign-born population - Other Western Asia (%)
Place of birth for the foreign-born population - Eritrea (%)
Place of birth for the foreign-born population - Ethiopia (%)
Place of birth for the foreign-born population - Kenya (%)
Place of birth for the foreign-born population - Somalia (%)
Place of birth for the foreign-born population - Uganda (%)
Place of birth for the foreign-born population - Zimbabwe (%)
Place of birth for the foreign-born population - Other Eastern Africa (%)
Place of birth for the foreign-born population - Cameroon (%)
Place of birth for the foreign-born population - Congo (%)
Place of birth for the foreign-born population - Democratic Republic of Congo (Zaire) (%)
Place of birth for the foreign-born population - Other Middle Africa (%)
Place of birth for the foreign-born population - Egypt (%)
Place of birth for the foreign-born population - Morocco (%)
Place of birth for the foreign-born population - Sudan (%)
Place of birth for the foreign-born population - Other Northern Africa (%)
Place of birth for the foreign-born population - South Africa (%)
Place of birth for the foreign-born population - Other Southern Africa (%)
Place of birth for the foreign-born population - Cabo Verde (%)
Place of birth for the foreign-born population - Ghana (%)
Place of birth for the foreign-born population - Liberia (%)
Place of birth for the foreign-born population - Nigeria (%)
Place of birth for the foreign-born population - Senegal (%)
Place of birth for the foreign-born population - Sierra Leone (%)
Place of birth for the foreign-born population - Other Western Africa (%)
Place of birth for the foreign-born population - Australia (%)
Place of birth for the foreign-born population - New Zealand (%)
Place of birth for the foreign-born population - Fiji (%)
Place of birth for the foreign-born population - Micronesia (%)
Place of birth for the foreign-born population - Bahamas (%)
Place of birth for the foreign-born population - Barbados (%)
Place of birth for the foreign-born population - Cuba (%)
Place of birth for the foreign-born population - Dominica (%)
Place of birth for the foreign-born population - Dominican Republic (%)
Place of birth for the foreign-born population - Grenada (%)
Place of birth for the foreign-born population - Haiti (%)
Place of birth for the foreign-born population - Jamaica (%)
Place of birth for the foreign-born population - St. Vincent and the Grenadines (%)
Place of birth for the foreign-born population - Trinidad and Tobago (%)
Place of birth for the foreign-born population - West Indies (%)
Place of birth for the foreign-born population - Other Caribbean (%)
Place of birth for the foreign-born population - Belize (%)
Place of birth for the foreign-born population - Costa Rica (%)
Place of birth for the foreign-born population - El Salvador (%)
Place of birth for the foreign-born population - Guatemala (%)
Place of birth for the foreign-born population - Honduras (%)
Place of birth for the foreign-born population - Mexico (%)
Place of birth for the foreign-born population - Nicaragua (%)
Place of birth for the foreign-born population - Panama (%)
Place of birth for the foreign-born population - Other Central America (%)
Place of birth for the foreign-born population - Argentina (%)
Place of birth for the foreign-born population - Bolivia (%)
Place of birth for the foreign-born population - Brazil (%)
Place of birth for the foreign-born population - Chile (%)
Place of birth for the foreign-born population - Colombia (%)
Place of birth for the foreign-born population - Ecuador (%)
Place of birth for the foreign-born population - Guyana (%)
Place of birth for the foreign-born population - Peru (%)
Place of birth for the foreign-born population - Uruguay (%)
Place of birth for the foreign-born population - Venezuela (%)
Place of birth for the foreign-born population - Other South America (%)
Place of birth for the foreign-born population - Canada (%)
Place of birth for the foreign-born population - Other Northern America (%)
Place of birth for the foreign-born population - Other (%)
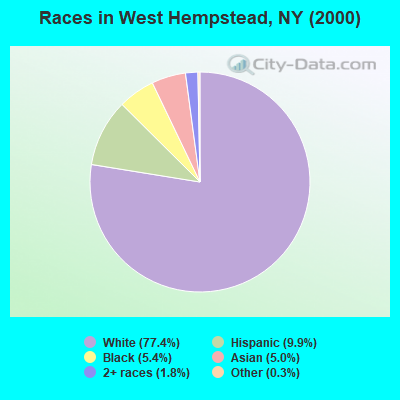
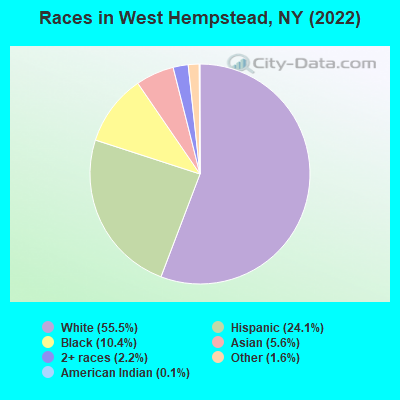
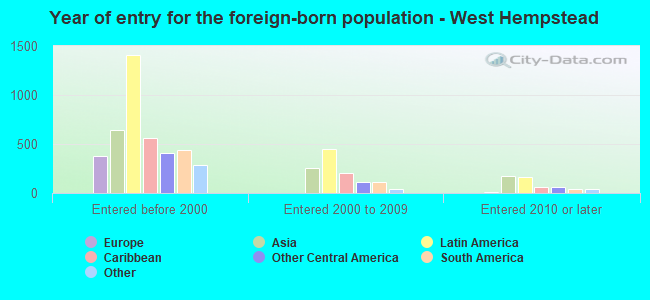
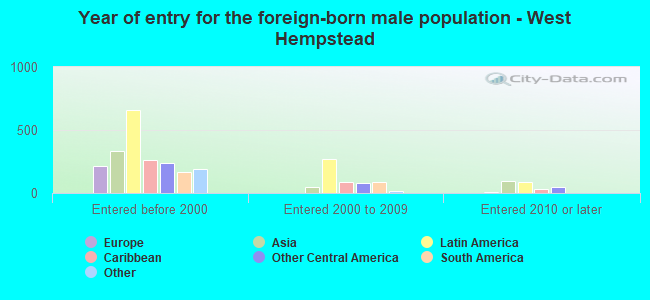
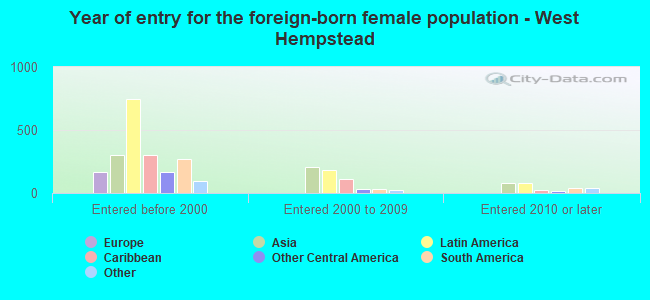
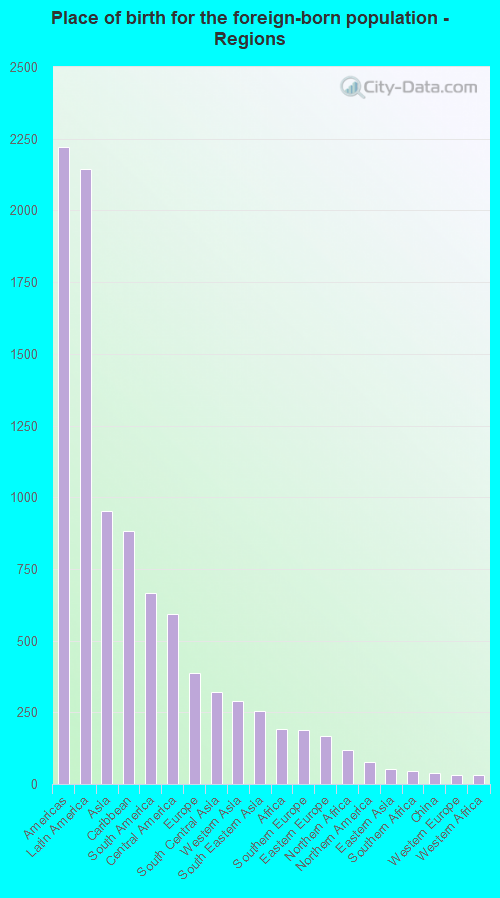
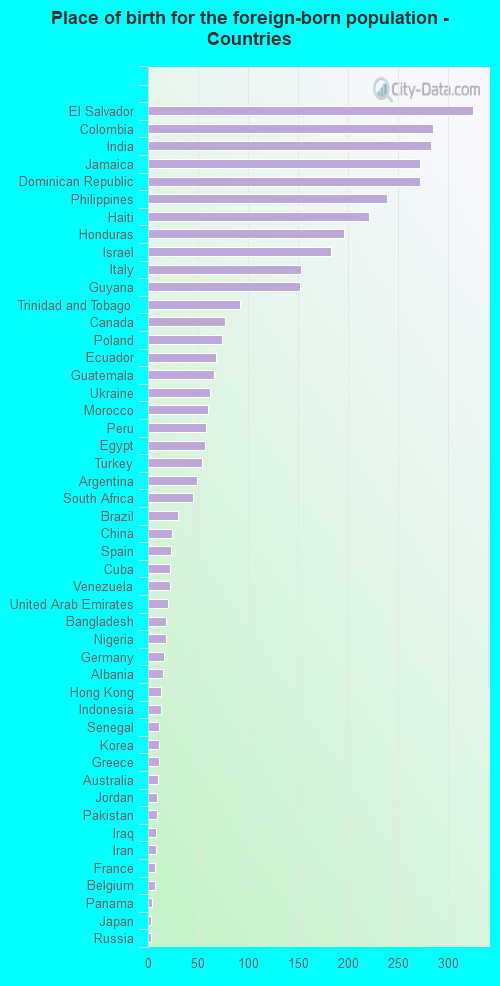
According to 2022 data, the most numerous races in West Hempstead, NY are White alone (11,281 residents), Hispanic (4,892 residents), and Black alone (2,113 residents). 69.1% of West Hempstead residents speak English at home. 18.5% of West Hempstead, NY residents are foreign-born (10.6% born in Latin America, 4.7% born in Asia, 1.9% born in Europe), which is 18.7% less than the foreign-born rate of 22.0% across the entire state of New York.
Race distribution in West Hempstead
2000 2022
11,760,981 62.0% White alone 2,867,583 15.1% Hispanic 2,812,623 14.8% Black alone 1,035,926 5.5% Asian alone 366,116 1.9% Two or more races 75,499 0.4% Other race alone 52,499 0.3% American Indian alone 5,230 0.03% Native Hawaiian and Other
10,408,933 52.9% White alone 3,867,299 19.7% Hispanic 2,633,840 13.4% Black alone 1,776,286 9.0% Asian alone 732,670 3.7% Two or more races 216,110 1.1% Other race alone 35,082 0.2% American Indian alone 6,931 0.04% Native Hawaiian and Other
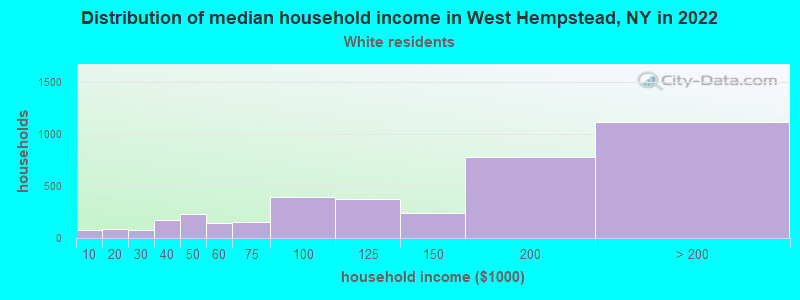
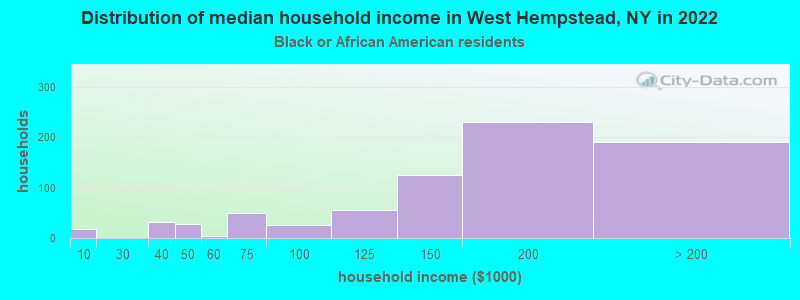
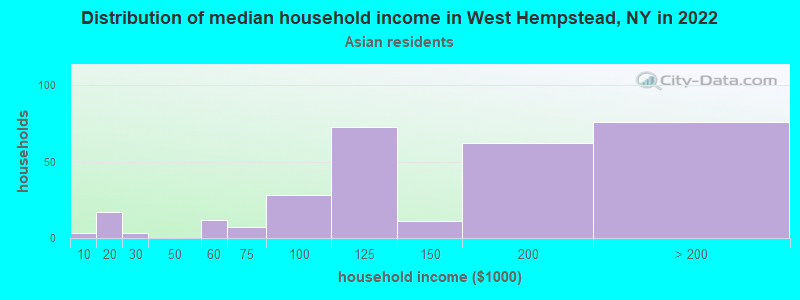
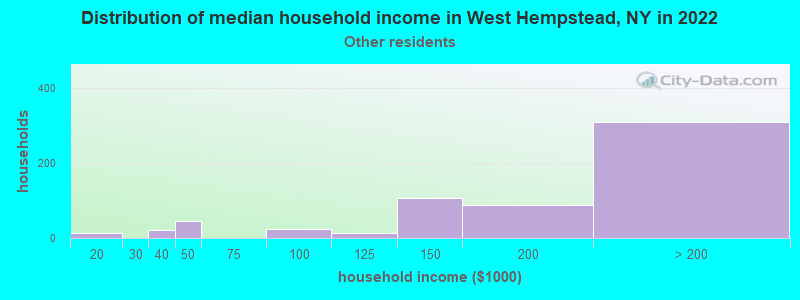
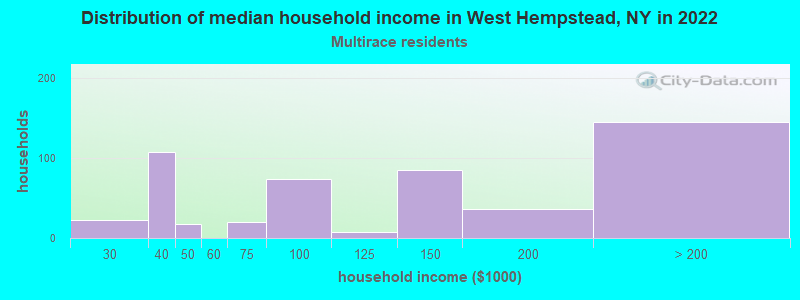
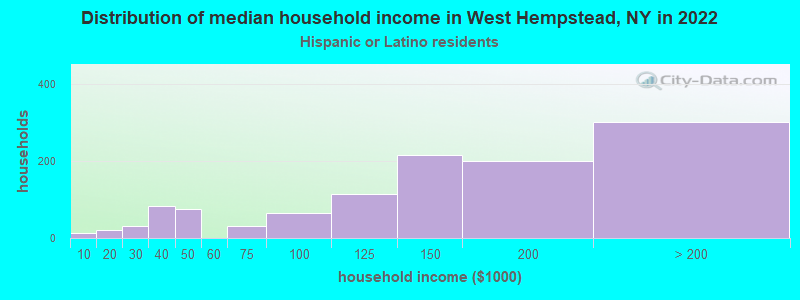
Income and house value in West Hempstead Median household income in 2022 $153,269 White non-Hispanic householders$174,538 Black householders$138,279 Asian householders$186,719 Some other race householders$125,613 Two or more races householders$143,148 Hispanic or Latino race householdersMedian 2022 house value $617,925 White Non-Hispanic householders$555,066 Black or African American householdersover $1,000,000 American Indian or Alaska Native householders $555,347 Asian householders$548,892 Some other race householders$561,240 Two or more races householders$576,393 Hispanic or Latino householders
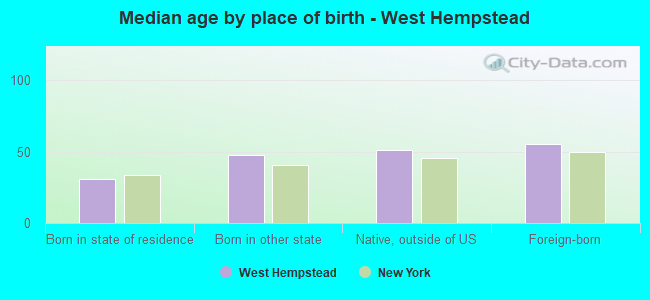
Median age by race in West Hempstead
41.4 Median age for White residents42.0 41.3 40.8 Median age for Black or African American residents35.6 45.6 62.0 Median age for American Indian / Alaska Native residents-607,543,322.5 -837,121,211.3 42.6 Median age for Asian residents39.7 48.3 14.3 Median age for Native Hawaiian / Pacific Islander residents-477,502,295.2 -497,387,669.3 33.4 Median age for Other race residents36.0 30.9 22.4 Median age for Two or more races residents15.8 36.6 41.9 Median age for White alone residents41.4 43.9 31.2 Median age for Hispanic or Latino residents28.8 33.8
Owner/renter occupied households by race in West Hempstead
House owners and renters - White residents 3,499 91.7% Owner occupied318 8.3% Renter occupiedHouse owners and renters - Black or African American residents 653 91.7% Owner occupied59 8.3% Renter occupiedHouse owners and renters - American Indian / Alaska Native residents 8 100.0% Owner occupiedHouse owners and renters - Asian residents 263 88.9% Owner occupied33 11.1% Renter occupiedHouse owners and renters - Native Hawaiian / Pacific Islander residents 20 100.0% Renter occupiedHouse owners and renters - Other race residents 604 93.9% Owner occupied39 6.1% Renter occupiedHouse owners and renters - Two or more races residents 478 89.1% Owner occupied58 10.9% Renter occupiedHouse owners and renters - White alone residents 3,363 91.5% Owner occupied312 8.5% Renter occupiedHouse owners and renters - Hispanic or Latino residents 1,021 88.6% Owner occupied131 11.4% Renter occupied
Language usage in West Hempstead
English speakers - Total 69.1% of residents of West Hempstead speak English at home.
15.9% of residents speak Spanish at home 1,916 62.8% Speak English very well1,134 37.2% Speak English less than very well14.7% of residents speak other language at home 2,062 73.2% Speak English very well754 26.8% Speak English less than very well
English speakers - Born in the United States 94.0% of residents of West Hempstead speak English at home.
0.8% of residents speak Spanish at home 7 100.0% Speak English less than very well2.9% of residents speak other language at home 25 100.0% Speak English very well
English speakers - Native, born elsewhere 38.4% of residents of West Hempstead speak English at home.
37.9% of residents speak Spanish at home 27 20.1% Speak English very well107 79.9% Speak English less than very well24.9% of residents speak other language at home 76 86.4% Speak English very well12 13.6% Speak English less than very well
English speakers - Foreign-born 24.5% of residents of West Hempstead speak English at home.
33.3% of residents speak Spanish at home 408 31.5% Speak English very well887 68.5% Speak English less than very well41.2% of residents speak other language at home 1,033 64.4% Speak English very well572 35.6% Speak English less than very well
White (Caucasian) - Speak only English Native:
90.2% (9,150)Foreign-born:
27.5% (288)
White (Caucasian) - Speak another language Native:
9.1% (921)Foreign-born:
72.1% (757)
Black or African American - Speak only English Native:
74.4% (1,298)Foreign-born:
56.5% (388)
Black or African American - Speak another language Native:
27.0% (471)Foreign-born:
43.6% (300)
Asian - Speak only English Native:
67.4% (192)Foreign-born:
22.8% (183)
Asian - Speak another language Native:
33.8% (96)Foreign-born:
74.3% (596)
Other race - Speak only English Native:
55.1% (839)Foreign-born:
1.5% (11)
Other race - Speak another language Native:
47.3% (719)Foreign-born:
100.0% (720)
Two or more races - Speak only English Native:
52.6% (876)Foreign-born:
17.9% (88)
Two or more races - Speak another language Native:
50.7% (844)Foreign-born:
82.1% (402)
White alone - Speak only English Native:
91.5% (8,915)Foreign-born:
29.6% (278)
White alone - Speak another language Native:
8.2% (803)Foreign-born:
70.4% (660)
Hispanic or Latino - Speak only English Native:
43.2% (1,363)Foreign-born:
5.3% (73)
Hispanic or Latino - Speak another language Native:
56.8% (1,792)Foreign-born:
94.7% (1,325)
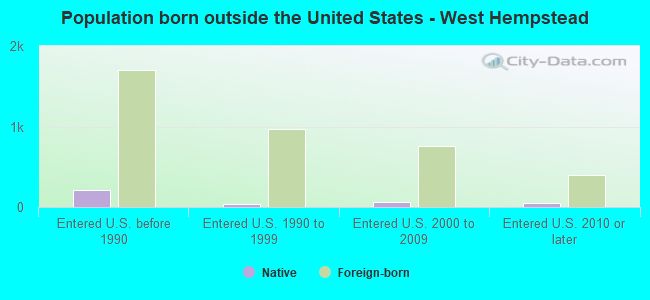
Foreign-born residents in West Hempstead 3,766 residents are foreign born (10.6% Latin America , 4.7% Asia , 1.9% Europe ).
This city:
18.5%New York:
22.6%
Marital status for residents in West Hempstead Marital status - White (Caucasian) population 15 years and over
Males 35.6% Never married57.5% Now married0.5% Separated1.2% Widowed5.1% DivorcedFemales 27.7% Never married51.1% Now married2.4% Separated10.8% Widowed7.9% DivorcedWomen who gave birth in the past 12 months Now married:
100.0% (121)Unmarried:
0.0% (0)
Women who did not give birth in the past 12 months Now married:
39.3% (998)Unmarried:
60.7% (1,539)
Marital status - Black or African American population 15 years and over
Males 54.7% Never married31.2% Now married0.8% Separated2.6% Widowed10.7% DivorcedFemales 43.1% Never married30.1% Now married5.5% Separated6.4% Widowed14.9% DivorcedWomen who did not give birth in the past 12 months Now married:
27.7% (142)Unmarried:
72.3% (373)
Marital status - American Indian / Alaska Native population 15 years and over
Males 0.0% Never married0.0% Now married0.0% Separated100.0% Widowed0.0% DivorcedFemales 0.0% Never married100.0% Now married0.0% Separated0.0% Widowed0.0% DivorcedWomen who did not give birth in the past 12 months Now married:
100.0% (27)Unmarried:
0.0% (0)
Marital status - Asian population 15 years and over
Males 28.4% Never married54.1% Now married10.9% Separated0.0% Widowed6.6% DivorcedFemales 12.1% Never married78.5% Now married7.6% Separated0.2% Widowed1.7% DivorcedWomen who gave birth in the past 12 months Now married:
100.0% (19)Unmarried:
0.0% (0)
Women who did not give birth in the past 12 months Now married:
78.4% (231)Unmarried:
21.6% (64)
Marital status - Native Hawaiian / Pacific Islander population 15 years and over
Males 100.0% Never married0.0% Now married0.0% Separated0.0% Widowed0.0% DivorcedFemales 0.0% Never married100.0% Now married0.0% Separated0.0% Widowed0.0% DivorcedWomen who did not give birth in the past 12 months Now married:
100.0% (23)Unmarried:
0.0% (0)
Marital status - Other race population 15 years and over
Males 46.4% Never married43.8% Now married3.6% Separated4.2% Widowed2.1% DivorcedFemales 40.5% Never married55.3% Now married0.0% Separated3.8% Widowed0.4% DivorcedWomen who gave birth in the past 12 months Now married:
100.0% (11)Unmarried:
0.0% (0)
Women who did not give birth in the past 12 months Now married:
46.1% (252)Unmarried:
53.9% (296)
Marital status - Two or more races population 15 years and over
Males 52.5% Never married45.5% Now married0.0% Separated2.1% Widowed0.0% DivorcedFemales 47.6% Never married42.3% Now married0.0% Separated1.9% Widowed8.3% DivorcedWomen who did not give birth in the past 12 months Now married:
37.0% (190)Unmarried:
63.0% (325)
Marital status - White alone, not Hispanic / Latino population 15 years and over
Males 35.5% Never married57.2% Now married0.4% Separated1.4% Widowed5.5% DivorcedFemales 27.2% Never married50.6% Now married2.4% Separated11.7% Widowed8.1% DivorcedWomen who gave birth in the past 12 months Now married:
100.0% (89)Unmarried:
0.0% (0)
Women who did not give birth in the past 12 months Now married:
38.7% (948)Unmarried:
61.3% (1,500)
Marital status - Hispanic or Latino population 15 years and over
Males 48.2% Never married42.6% Now married2.4% Separated2.7% Widowed4.0% DivorcedFemales 42.9% Never married49.5% Now married0.6% Separated2.3% Widowed4.8% DivorcedWomen who gave birth in the past 12 months Now married:
100.0% (52)Unmarried:
0.0% (0)
Women who did not give birth in the past 12 months Now married:
42.1% (449)Unmarried:
57.9% (618)
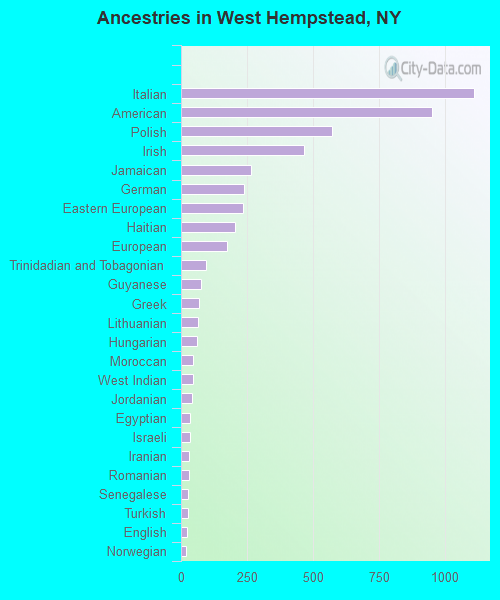
Ancestries in West Hempstead
1,113 12.3% Italian953 10.5% American572 6.3% Polish467 5.2% Irish267 2.9% Jamaican240 2.6% German237 2.6% Eastern European206 2.3% Haitian174 1.9% European96 1.1% Trinidadian and Tobagonian77 0.8% Guyanese70 0.8% Greek65 0.7% Lithuanian61 0.7% Hungarian46 0.5% Moroccan44 0.5% West Indian42 0.5% Jordanian35 0.4% Egyptian34 0.4% Israeli31 0.3% Iranian29 0.3% Romanian28 0.3% Senegalese25 0.3% Turkish24 0.3% English19 0.2% Norwegian18 0.2% Iraqi18 0.2% Ukrainian17 0.2% Arab16 0.2% Russian15 0.2% Albanian12 0.1% Austrian11 0.1% Palestinian10 0.1% Cypriot9 0.10% South African7 0.08% Canadian5 0.06% Czechoslovakian5 0.06% Slavic5 0.06% Slovak3 0.03% Barbadian2 0.02% Scotch-Irish
Geographical mobility in West Hempstead Same house 1 year ago 11,071 94.3% White (Caucasian)2,084 83.7% Black or African American34 100.0% American Indian / Alaska Native951 84.7% Asian64 89.7% Native Hawaiian / Pacific Islander2,173 90.9% Other race1,883 78.8% Two or more races10,743 95.5% White alone, not Hispanic / Latino3,910 80.4% Hispanic or LatinoMoved within same county 349 3.0% White / Caucasian141 5.7% Black or African American129 11.5% Asian27 1.1% Other race191 8.0% Two or more races285 2.5% White alone, not Hispanic / Latino328 6.7% Hispanic or LatinoMoved within same state 224 1.9% White / Caucasian280 11.3% Black or African American29 2.6% Asian115 4.8% Other race344 14.4% Two or more races108 1.0% White alone, not Hispanic / Latino564 11.6% Hispanic or LatinoMoved from different state 63 0.5% White / Caucasian20 0.8% Black or African American4 0.2% Two or more races64 0.6% White alone, not Hispanic / LatinoMoved from abroad 15 0.1% White15 0.1% White alone, not Hispanic / Latino
Children Nativity (place of birth) in West Hempstead
Children under 6 years - Living with two parents Both parents native 739 100.0% NativeBoth parents foreign-born 305 100.0% NativeOne native, one foreign-born parent 89 100.0% NativeChildren under 6 years - Living with one parent Native parent 205 100.0% NativeForeign-born parent 191 100.0% NativeChildren 6 to 17 years - Living with two parents Both parents native 1,694 100.0% NativeBoth parents foreign-born 525 98.3% Native9 1.7% Foreign-bornOne native, one foreign-born parent 294 100.0% NativeChildren 6 to 17 years - Living with one parent Native parent 514 100.0% NativeForeign-born parent 219 47.9% Native238 52.1% Foreign-born
Grandparents responsible for own grandchildren in West Hempstead
Grandparents (30 to 59 years) White / Caucasian 11 100.0% Not responsible for grandchildrenBlack or African American 3 100.0% Not responsible for grandchildrenOther race 28 44.6% Responsible for grandchildren35 55.4% Not responsible for grandchildrenWhite alone, not Hispanic / Latino 4 100.0% Not responsible for grandchildrenHispanic or Latino 25 45.4% Responsible for grandchildren31 54.6% Not responsible for grandchildren
Grandparents (60 years and over) White / Caucasian 214 100.0% Not responsible for grandchildrenBlack or African American 18 100.0% Not responsible for grandchildrenOther race 30 100.0% Not responsible for grandchildrenWhite alone, not Hispanic / Latino 157 100.0% Not responsible for grandchildrenHispanic or Latino 113 100.0% Not responsible for grandchildren