Races in West De Baca, New Mexico (NM) Detailed Stats
Ancestries, Foreign-born residents, place of birth
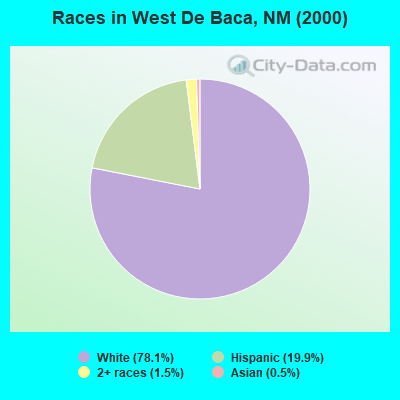
Race distribution in West De Baca

- 15778.1%White alone
- 4019.9%Hispanic
- 31.5%Two or more races
- 10.5%Asian alone
2000
2022
-
- 813,49544.7%White alone
- 765,38642.1%Hispanic
- 161,4608.9%American Indian alone
- 30,6541.7%Black alone
- 25,7931.4%Two or more races
- 18,2571.0%Asian alone
- 3,0090.2%Other race alone
- 9920.05%Native Hawaiian and Other
Pacific Islander alone

-
- 1,059,86750.2%Hispanic
- 735,47834.8%White alone
- 171,8088.1%American Indian alone
- 65,0843.1%Two or more races
- 36,8701.7%Black alone
- 35,8701.7%Asian alone
- 7,5820.4%Other race alone
- 7850.04%Native Hawaiian and Other
Pacific Islander alone

Income and house value in West De Baca
- Median household income in 2022
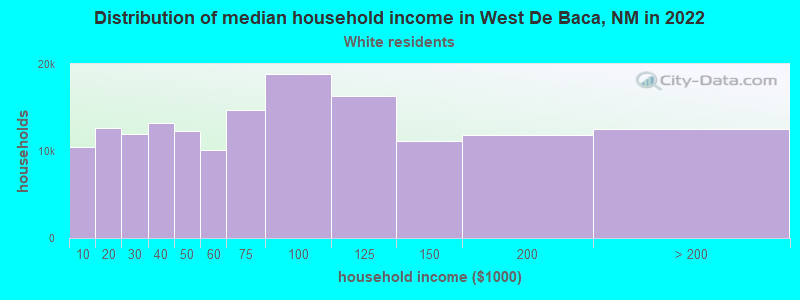
- $43,751White non-Hispanic householders
- $35,678Some other race householders
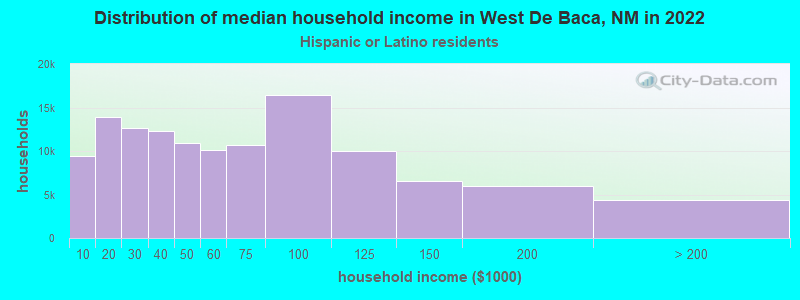
- $36,872Hispanic or Latino race householders
- Median 2022 house value
- $108,202White Non-Hispanic householders
Household income for White non-Hispanic householders
Household income for Hispanic or Latino race householders