Races in Wells Branch, Texas (TX) Detailed Stats
Data:
Races - White alone (%)
Races - White alone (% change since 2000)
Races - Black alone (%)
Races - Black alone (% change since 2000)
Races - American Indian alone (%)
Races - American Indian alone (% change since 2000)
Races - Asian alone (%)
Races - Asian alone (% change since 2000)
Races - Hispanic (%)
Races - Hispanic (% change since 2000)
Races - Native Hawaiian and Other Pacific Islander alone (%)
Races - Native Hawaiian and Other Pacific Islander alone (% change since 2000)
Races - Two or more races(%)
Races - Two or more races(% change since 2000)
Races - Other race alone (%)
Races - Other race alone (% change since 2000)
Racial diversity
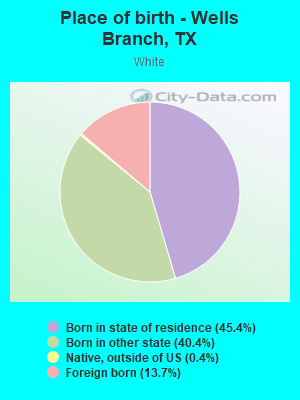
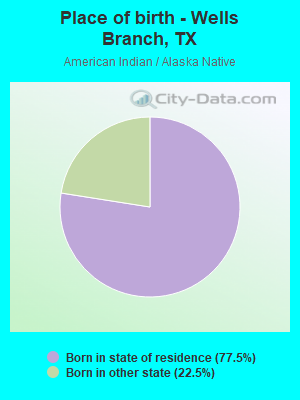
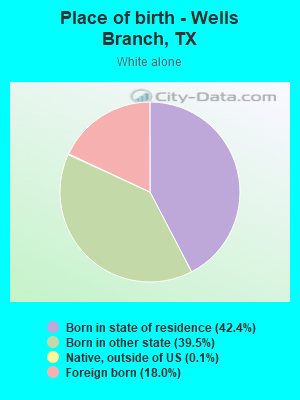
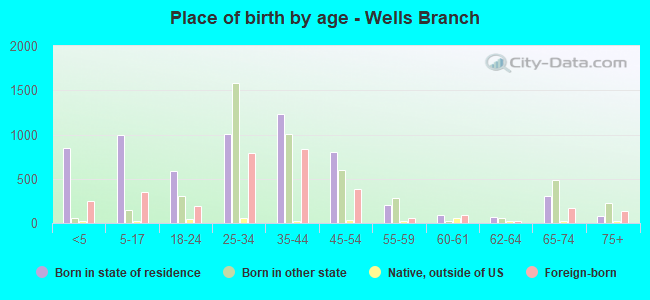
Place of birth - Born in state of residence (%)
Place of birth - Born in state of residence (%) - White
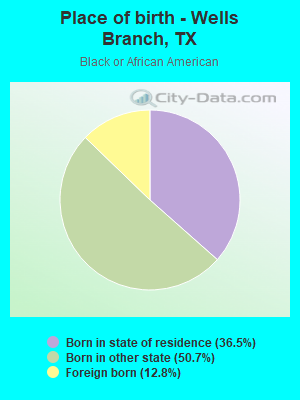
Place of birth - Born in state of residence (%) - Black or African American
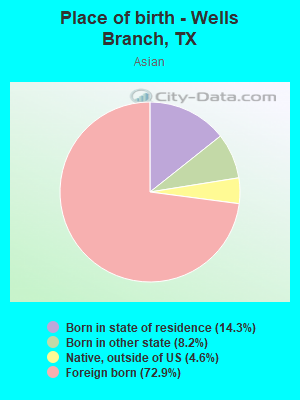
Place of birth - Born in state of residence (%) - Asian
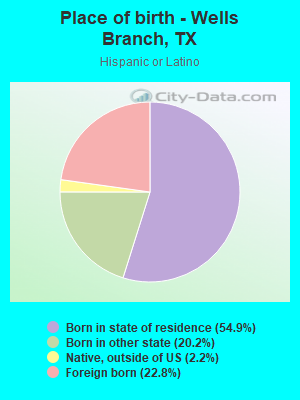
Place of birth - Born in state of residence (%) - Hispanic or Latino
Place of birth - Born in state of residence (%) - American Indian and Alaska Native
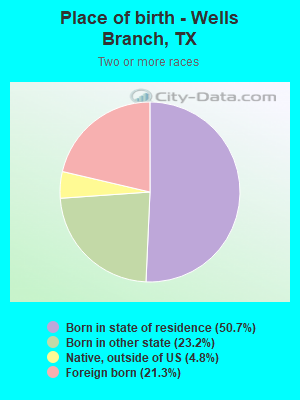
Place of birth - Born in state of residence (%) - Multirace
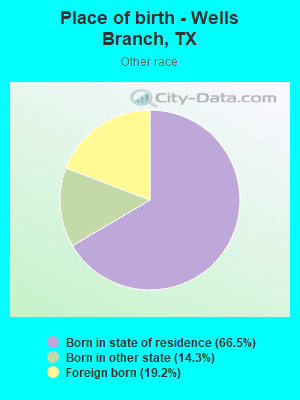
Place of birth - Born in state of residence (%) - Other Race
Place of birth - Born in other state (%)
Place of birth - Born in other state (%) - White
Place of birth - Born in other state (%) - Black or African American
Place of birth - Born in other state (%) - Asian
Place of birth - Born in other state (%) - Hispanic or Latino
Place of birth - Born in other state (%) - American Indian and Alaska Native
Place of birth - Born in other state (%) - Multirace
Place of birth - Born in other state (%) - Other Race
Place of birth - Native, outside of US (%)
Place of birth - Native, outside of US (%) - White
Place of birth - Native, outside of US (%) - Black or African American
Place of birth - Native, outside of US (%) - Asian
Place of birth - Native, outside of US (%) - Hispanic or Latino
Place of birth - Native, outside of US (%) - American Indian and Alaska Native
Place of birth - Native, outside of US (%) - Multirace
Place of birth - Native, outside of US (%) - Other Race
Place of birth - Foreign born (%)
Place of birth - Foreign born (%) - White
Place of birth - Foreign born (%) - Black or African American
Place of birth - Foreign born (%) - Asian
Place of birth - Foreign born (%) - Hispanic or Latino
Place of birth - Foreign born (%) - American Indian and Alaska Native
Place of birth - Foreign born (%) - Multirace
Place of birth - Foreign born (%) - Other Race
Residents speaking English at home (%)
Residents speaking English at home - Born in the United States (%)
Residents speaking English at home - Native, born elsewhere (%)
Residents speaking English at home - Foreign born (%)
Residents speaking Spanish at home (%)
Residents speaking Spanish at home - Born in the United States (%)
Residents speaking Spanish at home - Native, born elsewhere (%)
Residents speaking Spanish at home - Foreign born (%)
Residents speaking other language at home (%)
Residents speaking other language at home - Born in the United States (%)
Residents speaking other language at home - Native, born elsewhere (%)
Residents speaking other language at home - Foreign born (%)
Marital status - Never married (%)
Marital status - Now married (%)
Marital status - Separated (%)
Marital status - Widowed (%)
Marital status - Divorced (%)
Ancestries Reported - Arab (%)
Ancestries Reported - Czech (%)
Ancestries Reported - Danish (%)
Ancestries Reported - Dutch (%)
Ancestries Reported - English (%)
Ancestries Reported - French (%)
Ancestries Reported - French Canadian (%)
Ancestries Reported - German (%)
Ancestries Reported - Greek (%)
Ancestries Reported - Hungarian (%)
Ancestries Reported - Irish (%)
Ancestries Reported - Italian (%)
Ancestries Reported - Lithuanian (%)
Ancestries Reported - Norwegian (%)
Ancestries Reported - Polish (%)
Ancestries Reported - Portuguese (%)
Ancestries Reported - Russian (%)
Ancestries Reported - Scotch-Irish (%)
Ancestries Reported - Scottish (%)
Ancestries Reported - Slovak (%)
Ancestries Reported - Subsaharan African (%)
Ancestries Reported - Swedish (%)
Ancestries Reported - Swiss (%)
Ancestries Reported - Ukrainian (%)
Ancestries Reported - United States (%)
Ancestries Reported - Welsh (%)
Ancestries Reported - West Indian (%)
Ancestries Reported - Other (%)
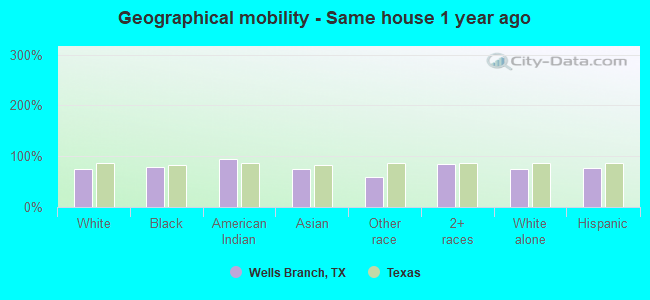
Geographical mobility - Same house 1 year ago (%)
Geographical mobility - Same house 1 year ago (%) - White
Geographical mobility - Same house 1 year ago (%) - Black or African American
Geographical mobility - Same house 1 year ago (%) - Asian
Geographical mobility - Same house 1 year ago (%) - Hispanic or Latino
Geographical mobility - Same house 1 year ago (%) - American Indian and Alaska Native
Geographical mobility - Same house 1 year ago (%) - Multirace
Geographical mobility - Same house 1 year ago (%) - Other Race
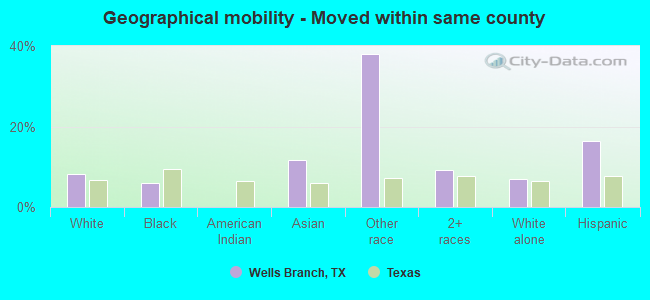
Geographical mobility - Moved within same county (%)
Geographical mobility - Moved within same county (%) - White
Geographical mobility - Moved within same county (%) - Black or African American
Geographical mobility - Moved within same county (%) - Asian
Geographical mobility - Moved within same county (%) - Hispanic or Latino
Geographical mobility - Moved within same county (%) - American Indian and Alaska Native
Geographical mobility - Moved within same county (%) - Multirace
Geographical mobility - Moved within same county (%) - Other Race
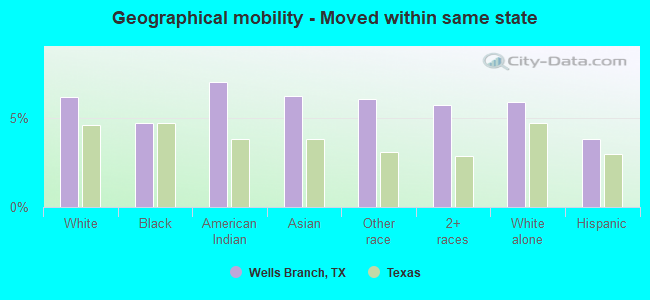
Geographical mobility - Moved from different county within same state (%)
Geographical mobility - Moved from different county within same state (%) - White
Geographical mobility - Moved from different county within same state (%) - Black or African American
Geographical mobility - Moved from different county within same state (%) - Asian
Geographical mobility - Moved from different county within same state (%) - Hispanic or Latino
Geographical mobility - Moved from different county within same state (%) - American Indian and Alaska Native
Geographical mobility - Moved from different county within same state (%) - Multirace
Geographical mobility - Moved from different county within same state (%) - Other Race
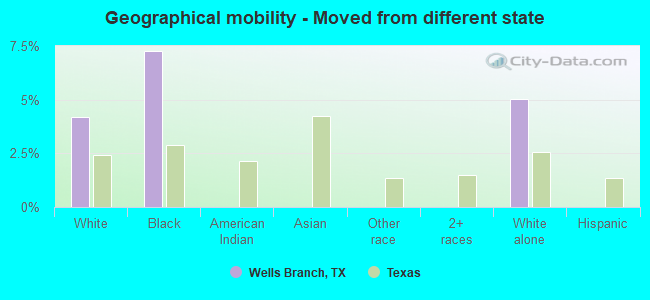
Geographical mobility - Moved from different state (%)
Geographical mobility - Moved from different state (%) - White
Geographical mobility - Moved from different state (%) - Black or African American
Geographical mobility - Moved from different state (%) - Asian
Geographical mobility - Moved from different state (%) - Hispanic or Latino
Geographical mobility - Moved from different state (%) - American Indian and Alaska Native
Geographical mobility - Moved from different state (%) - Multirace
Geographical mobility - Moved from different state (%) - Other Race
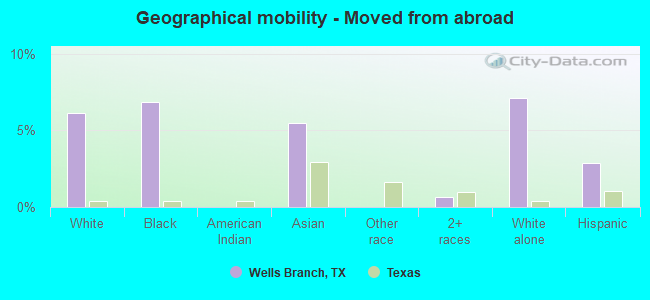
Geographical mobility - Moved from abroad (%)
Geographical mobility - Moved from abroad (%) - White
Geographical mobility - Moved from abroad (%) - Black or African American
Geographical mobility - Moved from abroad (%) - Asian
Geographical mobility - Moved from abroad (%) - Hispanic or Latino
Geographical mobility - Moved from abroad (%) - American Indian and Alaska Native
Geographical mobility - Moved from abroad (%) - Multirace
Geographical mobility - Moved from abroad (%) - Other Race
Place of birth for the foreign-born population - Ireland (%)
Place of birth for the foreign-born population - Denmark (%)
Place of birth for the foreign-born population - Norway (%)
Place of birth for the foreign-born population - Sweden (%)
Place of birth for the foreign-born population - United Kingdom (%)
Place of birth for the foreign-born population - England (%)
Place of birth for the foreign-born population - Scotland (%)
Place of birth for the foreign-born population - Other Northern Europe (%)
Place of birth for the foreign-born population - Austria (%)
Place of birth for the foreign-born population - Belgium (%)
Place of birth for the foreign-born population - France (%)
Place of birth for the foreign-born population - Germany (%)
Place of birth for the foreign-born population - Netherlands (%)
Place of birth for the foreign-born population - Switzerland (%)
Place of birth for the foreign-born population - Other Western Europe (%)
Place of birth for the foreign-born population - Greece (%)
Place of birth for the foreign-born population - Italy (%)
Place of birth for the foreign-born population - Portugal (%)
Place of birth for the foreign-born population - Spain (%)
Place of birth for the foreign-born population - Other Southern Europe (%)
Place of birth for the foreign-born population - Albania (%)
Place of birth for the foreign-born population - Belarus (%)
Place of birth for the foreign-born population - Bosnia and Herzegovina (%)
Place of birth for the foreign-born population - Bulgaria (%)
Place of birth for the foreign-born population - Croatia (%)
Place of birth for the foreign-born population - Czechoslovakia (%)
Place of birth for the foreign-born population - Hungary (%)
Place of birth for the foreign-born population - Latvia (%)
Place of birth for the foreign-born population - Lithuania (%)
Place of birth for the foreign-born population - North Macedonia (Macedonia) (%)
Place of birth for the foreign-born population - Moldova (%)
Place of birth for the foreign-born population - Poland (%)
Place of birth for the foreign-born population - Romania (%)
Place of birth for the foreign-born population - Russia (%)
Place of birth for the foreign-born population - Serbia (%)
Place of birth for the foreign-born population - Ukraine (%)
Place of birth for the foreign-born population - Other Eastern Europe (%)
Place of birth for the foreign-born population - China (%)
Place of birth for the foreign-born population - Hong Kong (%)
Place of birth for the foreign-born population - Taiwan (%)
Place of birth for the foreign-born population - Japan (%)
Place of birth for the foreign-born population - Korea (%)
Place of birth for the foreign-born population - Other Eastern Asia (%)
Place of birth for the foreign-born population - Afghanistan (%)
Place of birth for the foreign-born population - Bangladesh (%)
Place of birth for the foreign-born population - India (%)
Place of birth for the foreign-born population - Iran (%)
Place of birth for the foreign-born population - Kazakhstan (%)
Place of birth for the foreign-born population - Nepal (%)
Place of birth for the foreign-born population - Pakistan (%)
Place of birth for the foreign-born population - Sri Lanka (%)
Place of birth for the foreign-born population - Uzbekistan (%)
Place of birth for the foreign-born population - Other South Central Asia (%)
Place of birth for the foreign-born population - Burma (%)
Place of birth for the foreign-born population - Cambodia (%)
Place of birth for the foreign-born population - Indonesia (%)
Place of birth for the foreign-born population - Laos (%)
Place of birth for the foreign-born population - Malaysia (%)
Place of birth for the foreign-born population - Philippines (%)
Place of birth for the foreign-born population - Singapore (%)
Place of birth for the foreign-born population - Thailand (%)
Place of birth for the foreign-born population - Vietnam (%)
Place of birth for the foreign-born population - Other South Eastern Asia (%)
Place of birth for the foreign-born population - Armenia (%)
Place of birth for the foreign-born population - Iraq (%)
Place of birth for the foreign-born population - Israel (%)
Place of birth for the foreign-born population - Jordan (%)
Place of birth for the foreign-born population - Kuwait (%)
Place of birth for the foreign-born population - Lebanon (%)
Place of birth for the foreign-born population - Saudi Arabia (%)
Place of birth for the foreign-born population - Syria (%)
Place of birth for the foreign-born population - Turkey (%)
Place of birth for the foreign-born population - Yemen (%)
Place of birth for the foreign-born population - Other Western Asia (%)
Place of birth for the foreign-born population - Eritrea (%)
Place of birth for the foreign-born population - Ethiopia (%)
Place of birth for the foreign-born population - Kenya (%)
Place of birth for the foreign-born population - Somalia (%)
Place of birth for the foreign-born population - Uganda (%)
Place of birth for the foreign-born population - Zimbabwe (%)
Place of birth for the foreign-born population - Other Eastern Africa (%)
Place of birth for the foreign-born population - Cameroon (%)
Place of birth for the foreign-born population - Congo (%)
Place of birth for the foreign-born population - Democratic Republic of Congo (Zaire) (%)
Place of birth for the foreign-born population - Other Middle Africa (%)
Place of birth for the foreign-born population - Egypt (%)
Place of birth for the foreign-born population - Morocco (%)
Place of birth for the foreign-born population - Sudan (%)
Place of birth for the foreign-born population - Other Northern Africa (%)
Place of birth for the foreign-born population - South Africa (%)
Place of birth for the foreign-born population - Other Southern Africa (%)
Place of birth for the foreign-born population - Cabo Verde (%)
Place of birth for the foreign-born population - Ghana (%)
Place of birth for the foreign-born population - Liberia (%)
Place of birth for the foreign-born population - Nigeria (%)
Place of birth for the foreign-born population - Senegal (%)
Place of birth for the foreign-born population - Sierra Leone (%)
Place of birth for the foreign-born population - Other Western Africa (%)
Place of birth for the foreign-born population - Australia (%)
Place of birth for the foreign-born population - New Zealand (%)
Place of birth for the foreign-born population - Fiji (%)
Place of birth for the foreign-born population - Micronesia (%)
Place of birth for the foreign-born population - Bahamas (%)
Place of birth for the foreign-born population - Barbados (%)
Place of birth for the foreign-born population - Cuba (%)
Place of birth for the foreign-born population - Dominica (%)
Place of birth for the foreign-born population - Dominican Republic (%)
Place of birth for the foreign-born population - Grenada (%)
Place of birth for the foreign-born population - Haiti (%)
Place of birth for the foreign-born population - Jamaica (%)
Place of birth for the foreign-born population - St. Vincent and the Grenadines (%)
Place of birth for the foreign-born population - Trinidad and Tobago (%)
Place of birth for the foreign-born population - West Indies (%)
Place of birth for the foreign-born population - Other Caribbean (%)
Place of birth for the foreign-born population - Belize (%)
Place of birth for the foreign-born population - Costa Rica (%)
Place of birth for the foreign-born population - El Salvador (%)
Place of birth for the foreign-born population - Guatemala (%)
Place of birth for the foreign-born population - Honduras (%)
Place of birth for the foreign-born population - Mexico (%)
Place of birth for the foreign-born population - Nicaragua (%)
Place of birth for the foreign-born population - Panama (%)
Place of birth for the foreign-born population - Other Central America (%)
Place of birth for the foreign-born population - Argentina (%)
Place of birth for the foreign-born population - Bolivia (%)
Place of birth for the foreign-born population - Brazil (%)
Place of birth for the foreign-born population - Chile (%)
Place of birth for the foreign-born population - Colombia (%)
Place of birth for the foreign-born population - Ecuador (%)
Place of birth for the foreign-born population - Guyana (%)
Place of birth for the foreign-born population - Peru (%)
Place of birth for the foreign-born population - Uruguay (%)
Place of birth for the foreign-born population - Venezuela (%)
Place of birth for the foreign-born population - Other South America (%)
Place of birth for the foreign-born population - Canada (%)
Place of birth for the foreign-born population - Other Northern America (%)
Place of birth for the foreign-born population - Other (%)
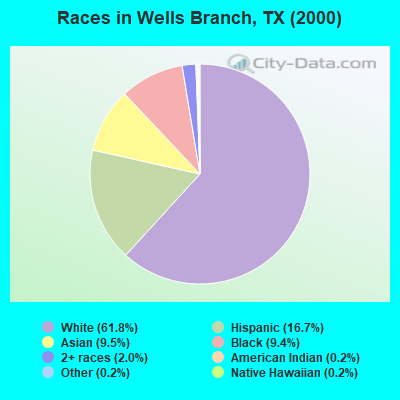
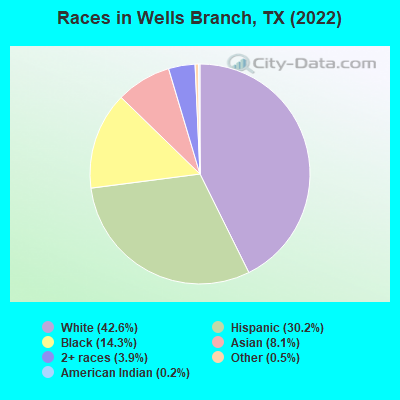
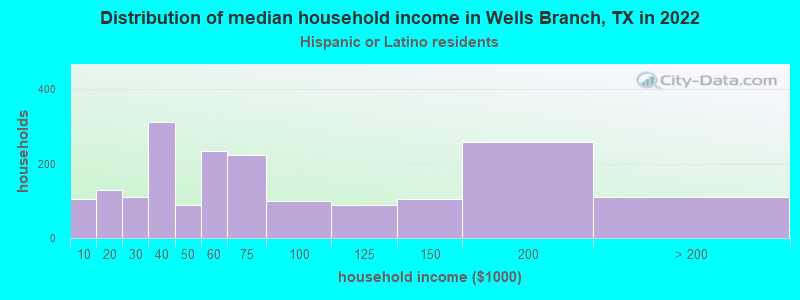
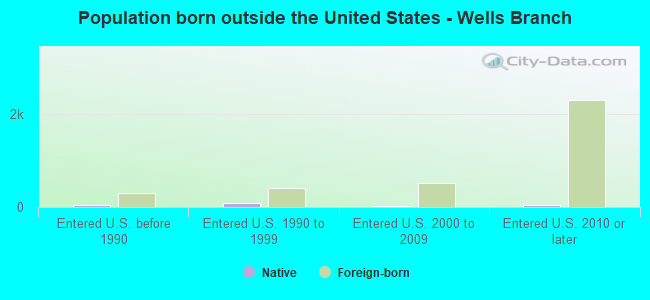
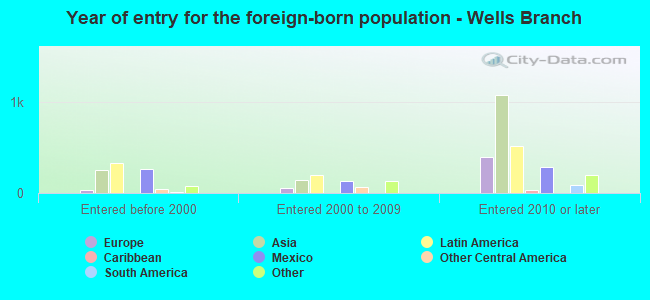
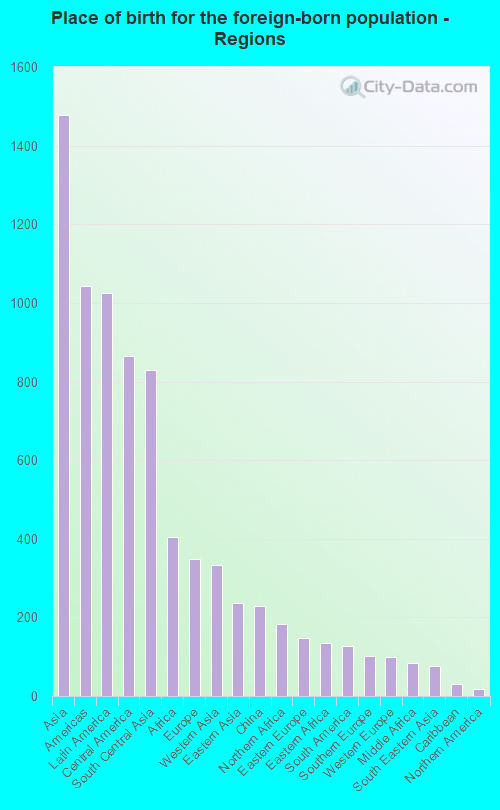
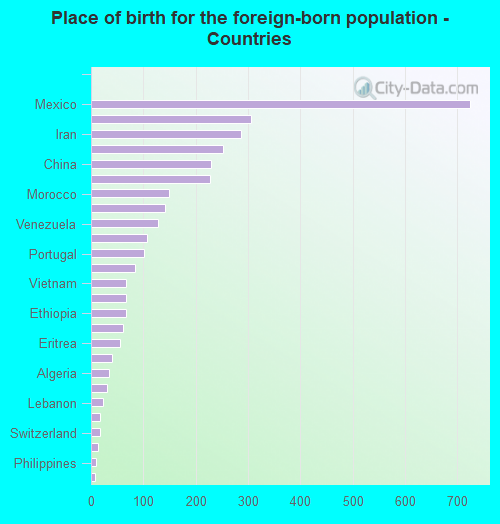
According to 2022 data, the most numerous races in Wells Branch, TX are Hispanic (4,329 residents), White alone (6,111 residents), and Black alone (2,058 residents). 67.6% of Wells Branch residents speak English at home. 22.9% of Wells Branch, TX residents are foreign-born (10.2% born in Asia, 7.1% born in Latin America, 2.8% born in Africa, 2.4% born in Europe), which is 25.6% greater than the foreign-born rate of 17.0% across the entire state of Texas.
Race distribution in Wells Branch
2000 2022
10,933,313 52.4% White alone 6,669,666 32.0% Hispanic 2,364,255 11.3% Black alone 554,445 2.7% Asian alone 230,567 1.1% Two or more races 68,859 0.3% American Indian alone 19,958 0.10% Other race alone 10,757 0.05% Native Hawaiian and Other
12,070,642 40.2% Hispanic 11,683,430 38.9% White alone 3,508,706 11.7% Black alone 1,608,173 5.4% Asian alone 956,560 3.2% Two or more races 125,763 0.4% Other race alone 47,023 0.2% American Indian alone 29,275 0.10% Native Hawaiian and Other
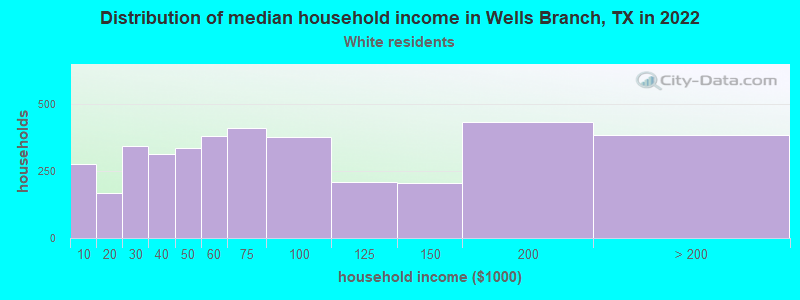
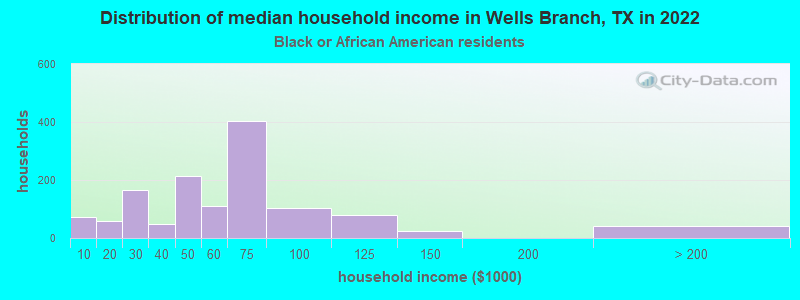
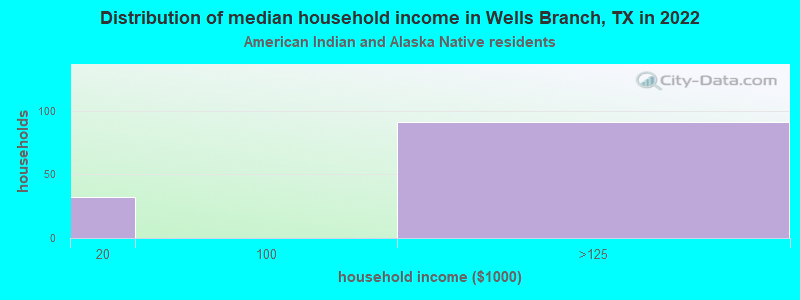
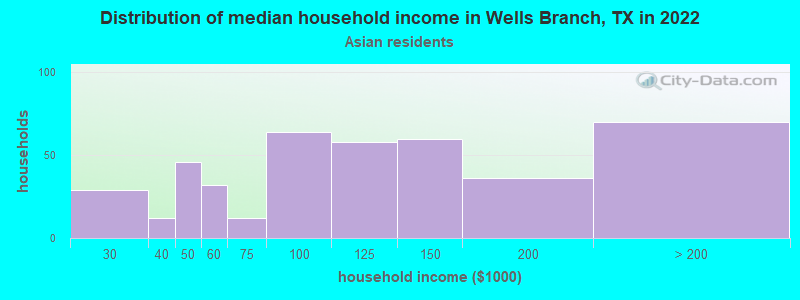
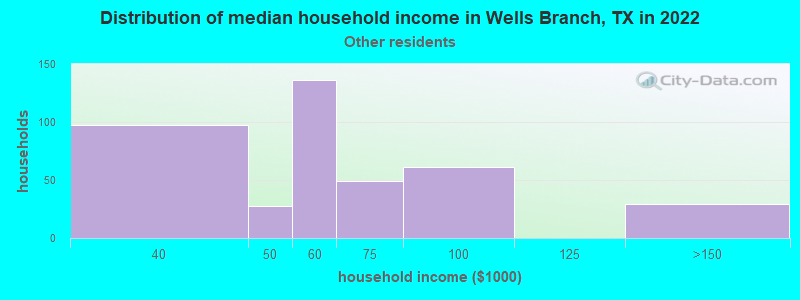
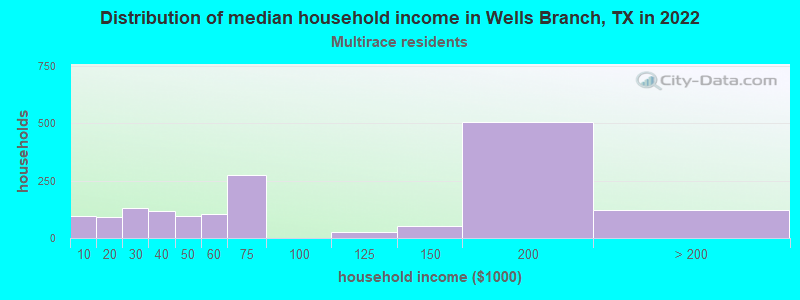
Income and house value in Wells Branch Median household income in 2022 $62,690 White non-Hispanic householders$52,075 Black householders$103,758 American Indian and Alaska Native householders$120,335 Asian householders$55,285 Some other race householders$64,420 Two or more races householders$58,394 Hispanic or Latino race householdersMedian 2022 house value $432,518 White Non-Hispanic householders$470,940 Black or African American householders $550,345 Asian householders$329,329 Some other race householders$376,166 Two or more races householders$414,222 Hispanic or Latino householders
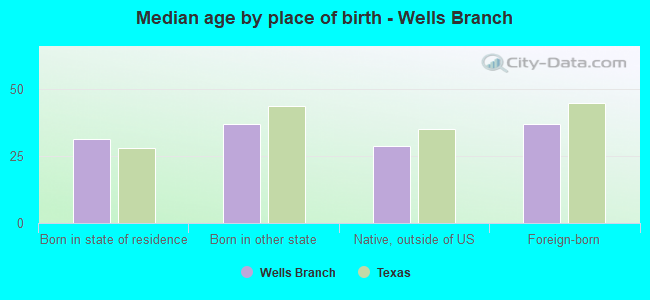
Median age by race in Wells Branch
38.3 Median age for White residents39.8 37.6 31.7 Median age for Black or African American residents36.3 26.6 26.6 Median age for American Indian / Alaska Native residents47.9 24.8 30.7 Median age for Asian residents30.7 30.5 -749,403,340.5 Median age for Native Hawaiian / Pacific Islander residents-751,851,851.1 -643,584,520.7 29.7 Median age for Other race residents29.0 31.0 30.3 Median age for Two or more races residents30.4 32.2 38.0 Median age for White alone residents39.0 37.5 31.3 Median age for Hispanic or Latino residents32.3 30.5
Owner/renter occupied households by race in Wells Branch
House owners and renters - White residents 1,196 30.2% Owner occupied2,767 69.8% Renter occupiedHouse owners and renters - Black or African American residents 144 10.7% Owner occupied1,198 89.3% Renter occupiedHouse owners and renters - American Indian / Alaska Native residents 47 68.9% Owner occupied21 31.1% Renter occupiedHouse owners and renters - Asian residents 78 18.1% Owner occupied353 81.9% Renter occupiedHouse owners and renters - Other race residents 66 17.4% Owner occupied314 82.6% Renter occupiedHouse owners and renters - Two or more races residents 765 48.5% Owner occupied812 51.5% Renter occupiedHouse owners and renters - White alone residents 1,160 31.9% Owner occupied2,472 68.1% Renter occupiedHouse owners and renters - Hispanic or Latino residents 636 33.9% Owner occupied1,239 66.1% Renter occupied
Language usage in Wells Branch
English speakers - Total 67.6% of residents of Wells Branch speak English at home.
14.8% of residents speak Spanish at home 1,179 60.2% Speak English very well780 39.8% Speak English less than very well17.7% of residents speak other language at home 1,291 55.3% Speak English very well1,043 44.7% Speak English less than very well
English speakers - Born in the United States 93.6% of residents of Wells Branch speak English at home.
3.7% of residents speak Spanish at home 154 89.5% Speak English very well18 10.5% Speak English less than very well2.8% of residents speak other language at home 122 93.1% Speak English very well9 6.9% Speak English less than very well
English speakers - Native, born elsewhere 46.6% of residents of Wells Branch speak English at home.
28.0% of residents speak Spanish at home 18 34.0% Speak English very well35 66.0% Speak English less than very well21.2% of residents speak other language at home 40 100.0% Speak English very well
English speakers - Foreign-born 12.4% of residents of Wells Branch speak English at home.
26.1% of residents speak Spanish at home 336 42.1% Speak English very well463 57.9% Speak English less than very well61.0% of residents speak other language at home 935 50.1% Speak English very well933 49.9% Speak English less than very well
White (Caucasian) - Speak only English Native:
94.2% (4,932)Foreign-born:
14.0% (117)
White (Caucasian) - Speak another language Native:
6.4% (335)Foreign-born:
79.7% (662)
Black or African American - Speak only English Native:
92.2% (1,699)Foreign-born:
33.4% (85)
Black or African American - Speak another language Native:
7.8% (144)Foreign-born:
65.3% (167)
Asian - Speak only English Native:
30.7% (97)Foreign-born:
5.6% (46)
Asian - Speak another language Native:
78.9% (249)Foreign-born:
93.9% (783)
Other race - Speak only English Native:
52.4% (292)Foreign-born:
12.4% (17)
Other race - Speak another language Native:
48.8% (272)Foreign-born:
88.3% (122)
Two or more races - Speak only English Native:
67.6% (1,596)Foreign-born:
17.2% (136)
Two or more races - Speak another language Native:
29.0% (686)Foreign-born:
82.5% (653)
White alone - Speak only English Native:
94.6% (4,491)Foreign-born:
12.4% (124)
White alone - Speak another language Native:
5.2% (247)Foreign-born:
90.3% (900)
Hispanic or Latino - Speak only English Native:
65.4% (1,829)Foreign-born:
19.9% (197)
Hispanic or Latino - Speak another language Native:
35.1% (982)Foreign-born:
80.3% (793)
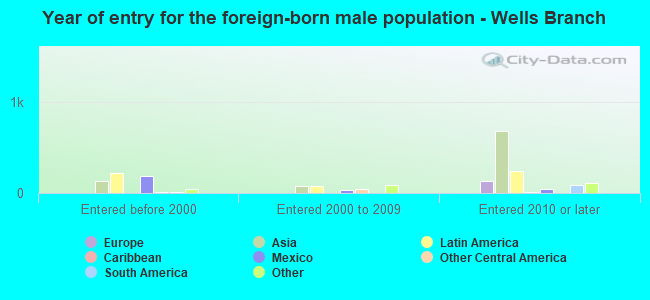
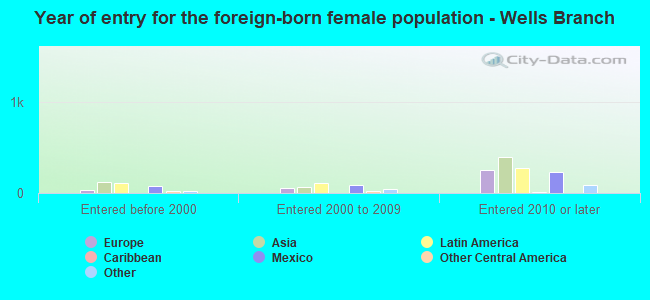
Foreign-born residents in Wells Branch 3,278 residents are foreign born (10.2% Asia , 7.1% Latin America , 2.8% Africa , 2.4% Europe ).
This city:
22.9%Texas:
17.1%
Marital status for residents in Wells Branch Marital status - White (Caucasian) population 15 years and over
Males 33.0% Never married50.6% Now married4.4% Separated0.3% Widowed11.7% DivorcedFemales 25.5% Never married53.6% Now married2.1% Separated4.9% Widowed13.8% DivorcedWomen who gave birth in the past 12 months Now married:
85.7% (74)Unmarried:
14.3% (12)
Women who did not give birth in the past 12 months Now married:
55.6% (949)Unmarried:
44.4% (758)
Marital status - Black or African American population 15 years and over
Males 63.3% Never married12.2% Now married7.1% Separated4.3% Widowed13.2% DivorcedFemales 62.4% Never married15.1% Now married0.0% Separated3.9% Widowed18.7% DivorcedWomen who gave birth in the past 12 months Now married:
0.0% (0)Unmarried:
100.0% (10)
Women who did not give birth in the past 12 months Now married:
9.3% (55)Unmarried:
90.7% (537)
Marital status - American Indian / Alaska Native population 15 years and over
Males 0.0% Never married100.0% Now married0.0% Separated0.0% Widowed0.0% DivorcedFemales 56.3% Never married43.8% Now married0.0% Separated0.0% Widowed0.0% DivorcedWomen who did not give birth in the past 12 months Now married:
43.8% (30)Unmarried:
56.3% (39)
Marital status - Asian population 15 years and over
Males 47.3% Never married52.7% Now married0.0% Separated0.0% Widowed0.0% DivorcedFemales 11.9% Never married88.1% Now married0.0% Separated0.0% Widowed0.0% DivorcedWomen who did not give birth in the past 12 months Now married:
85.3% (300)Unmarried:
14.7% (52)
Marital status - Other race population 15 years and over
Males 63.3% Never married23.2% Now married0.0% Separated0.0% Widowed13.5% DivorcedFemales 58.5% Never married41.5% Now married0.0% Separated0.0% Widowed0.0% DivorcedWomen who gave birth in the past 12 months Now married:
100.0% (24)Unmarried:
0.0% (0)
Women who did not give birth in the past 12 months Now married:
37.5% (133)Unmarried:
62.5% (222)
Marital status - Two or more races population 15 years and over
Males 31.5% Never married59.8% Now married1.9% Separated1.4% Widowed5.5% DivorcedFemales 30.8% Never married57.2% Now married1.3% Separated1.8% Widowed9.0% DivorcedWomen who gave birth in the past 12 months Now married:
61.5% (307)Unmarried:
38.5% (192)
Women who did not give birth in the past 12 months Now married:
53.7% (430)Unmarried:
46.3% (371)
Marital status - White alone, not Hispanic / Latino population 15 years and over
Males 32.5% Never married53.4% Now married0.5% Separated0.4% Widowed13.3% DivorcedFemales 24.7% Never married54.7% Now married1.7% Separated5.8% Widowed13.1% DivorcedWomen who gave birth in the past 12 months Now married:
85.7% (85)Unmarried:
14.3% (14)
Women who did not give birth in the past 12 months Now married:
56.8% (912)Unmarried:
43.2% (693)
Marital status - Hispanic or Latino population 15 years and over
Males 42.4% Never married44.3% Now married8.4% Separated0.6% Widowed4.3% DivorcedFemales 34.3% Never married53.9% Now married1.4% Separated1.1% Widowed9.3% DivorcedWomen who gave birth in the past 12 months Now married:
72.2% (206)Unmarried:
27.8% (79)
Women who did not give birth in the past 12 months Now married:
52.4% (577)Unmarried:
47.6% (525)
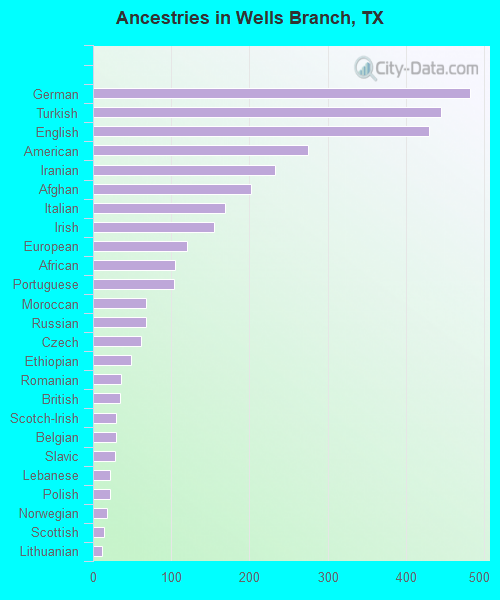
Ancestries in Wells Branch
482 6.6% German445 6.1% Turkish430 5.9% English275 3.8% American232 3.2% Iranian202 2.8% Afghan169 2.3% Italian155 2.1% Irish120 1.6% European105 1.4% African103 1.4% Portuguese68 0.9% Moroccan68 0.9% Russian61 0.8% Czech48 0.7% Ethiopian36 0.5% Romanian34 0.5% British30 0.4% Scotch-Irish29 0.4% Belgian28 0.4% Slavic22 0.3% Lebanese22 0.3% Polish18 0.2% Norwegian14 0.2% Scottish12 0.2% Lithuanian9 0.1% Armenian9 0.1% Greek9 0.1% Swedish7 0.10% French Canadian6 0.08% Dutch4 0.05% Eastern European3 0.04% French
Geographical mobility in Wells Branch Same house 1 year ago 4,974 74.8% White (Caucasian)1,734 79.6% Black or African American242 94.4% American Indian / Alaska Native947 75.0% Asian422 58.6% Other race2,970 85.1% Two or more races4,559 75.6% White alone, not Hispanic / Latino3,157 76.1% Hispanic or LatinoMoved within same county 541 8.1% White / Caucasian129 5.9% Black or African American146 11.6% Asian275 38.1% Other race318 9.1% Two or more races420 7.0% White alone, not Hispanic / Latino680 16.4% Hispanic or LatinoMoved within same state 410 6.2% White / Caucasian103 4.7% Black or African American18 7.0% American Indian / Alaska Native78 6.2% Asian43 6.0% Other race200 5.7% Two or more races353 5.8% White alone, not Hispanic / Latino157 3.8% Hispanic or LatinoMoved from different state 280 4.2% White / Caucasian159 7.3% Black or African American303 5.0% White alone, not Hispanic / LatinoMoved from abroad 409 6.2% White149 6.8% Black or African American69 5.5% Asian22 0.6% Two or more races428 7.1% White alone, not Hispanic / Latino119 2.9% Hispanic or Latino
Children Nativity (place of birth) in Wells Branch
Children under 6 years - Living with two parents Both parents native 545 94.2% Native33 5.8% Foreign-bornBoth parents foreign-born 246 58.7% Native173 41.3% Foreign-bornOne native, one foreign-born parent 81 74.3% Native28 25.7% Foreign-bornChildren under 6 years - Living with one parent Native parent 84 100.0% NativeForeign-born parent 34 41.6% Native48 58.4% Foreign-bornChildren 6 to 17 years - Living with two parents Both parents native 304 100.0% NativeBoth parents foreign-born 197 42.7% Native264 57.3% Foreign-bornOne native, one foreign-born parent 105 100.0% NativeChildren 6 to 17 years - Living with one parent Native parent 451 100.0% NativeForeign-born parent 11 56.0% Native9 44.0% Foreign-born
Grandparents responsible for own grandchildren in Wells Branch
Grandparents (30 to 59 years) White / Caucasian 8 100.0% Not responsible for grandchildrenWhite alone, not Hispanic / Latino 6 100.0% Not responsible for grandchildren
Grandparents (60 years and over) White / Caucasian 23 100.0% Not responsible for grandchildrenWhite alone, not Hispanic / Latino 27 100.0% Not responsible for grandchildren