Races in Waterford North, Wisconsin (WI) Detailed Stats
Ancestries, Foreign-born residents, place of birth

Discuss Waterford North, Wisconsin races on our local forum with over 2,400,000 registered users
2.3% of Waterford North, WI residents are foreign-born (1.7% born in Europe, 0.5% born in Latin America), which is 114.5% less than the foreign-born rate of 5.0% across the entire state of Wisconsin.
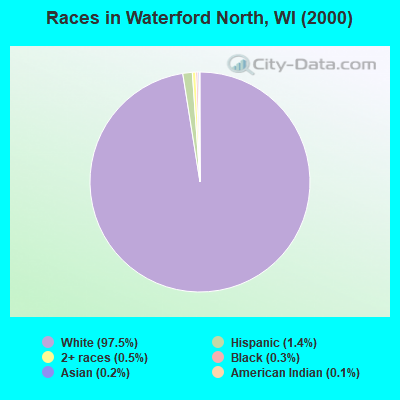
Race distribution in Waterford North

- 4,64197.5%White alone
- 661.4%Hispanic
- 240.5%Two or more races
- 130.3%Black alone
- 100.2%Asian alone
- 60.1%American Indian alone
- 10.02%Native Hawaiian and Other
Pacific Islander alone
2000
2022
-
- 4,681,63087.3%White alone
- 300,2455.6%Black alone
- 192,9213.6%Hispanic
- 87,9951.6%Asian alone
- 51,9211.0%Two or more races
- 43,9800.8%American Indian alone
- 3,6370.07%Other race alone
- 1,3460.03%Native Hawaiian and Other
Pacific Islander alone

-
- 4,654,03179.0%White alone
- 447,0227.6%Hispanic
- 345,6785.9%Black alone
- 217,5323.7%Two or more races
- 172,2422.9%Asian alone
- 33,7620.6%American Indian alone
- 19,6800.3%Other race alone
- 2,5920.04%Native Hawaiian and Other
Pacific Islander alone

Income and house value in Waterford North
- Median household income in 2022
- $101,846White non-Hispanic householders
- $117,118Some other race householders
- $71,532Hispanic or Latino race householders
- Median 2022 house value
- $370,269White Non-Hispanic householders
- $351,247Some other race householders
- $333,307Hispanic or Latino householders
Household income for White non-Hispanic householders

Household income for Hispanic or Latino race householders

Foreign-born residents in Waterford North
111 residents are foreign born (1.7% Europe, 0.5% Latin America).
| This city: | 2.3% |
| Wisconsin: | 3.6% |
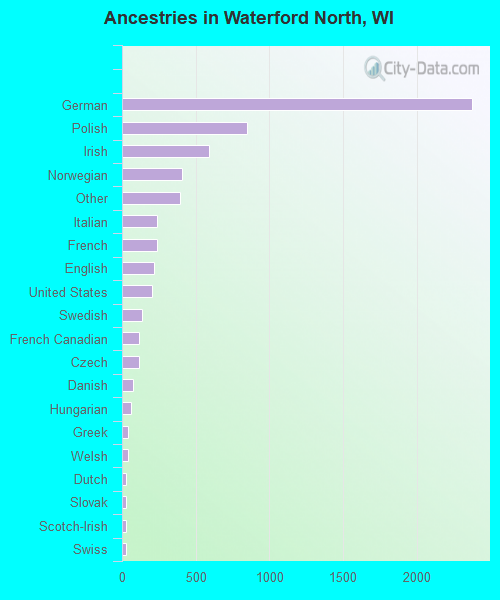
Ancestries in Waterford North

- 2,37337.9%German
- 85213.6%Polish
- 5889.4%Irish
- 4046.5%Norwegian
- 3916.2%Other
- 2403.8%Italian
- 2373.8%French
- 2203.5%English
- 2033.2%United States
- 1352.2%Swedish
- 1181.9%French Canadian
- 1141.8%Czech
- 741.2%Danish
- 590.9%Hungarian
- 400.6%Greek
- 390.6%Welsh
- 290.5%Dutch
- 280.4%Slovak
- 270.4%Scotch-Irish
- 250.4%Swiss
- 180.3%Russian
- 180.3%Scottish
- 120.2%Ukrainian
- 110.2%Lithuanian
- 80.1%Arab
Zip codes: 53185.