Races in Wapato, Washington (WA) Detailed Stats
Data:
Races - White alone (%)
Races - White alone (% change since 2000)
Races - Black alone (%)
Races - Black alone (% change since 2000)
Races - American Indian alone (%)
Races - American Indian alone (% change since 2000)
Races - Asian alone (%)
Races - Asian alone (% change since 2000)
Races - Hispanic (%)
Races - Hispanic (% change since 2000)
Races - Native Hawaiian and Other Pacific Islander alone (%)
Races - Native Hawaiian and Other Pacific Islander alone (% change since 2000)
Races - Two or more races(%)
Races - Two or more races(% change since 2000)
Races - Other race alone (%)
Races - Other race alone (% change since 2000)
Racial diversity
Place of birth - Born in state of residence (%)
Place of birth - Born in state of residence (%) - White
Place of birth - Born in state of residence (%) - Black or African American
Place of birth - Born in state of residence (%) - Asian
Place of birth - Born in state of residence (%) - Hispanic or Latino
Place of birth - Born in state of residence (%) - American Indian and Alaska Native
Place of birth - Born in state of residence (%) - Multirace
Place of birth - Born in state of residence (%) - Other Race
Place of birth - Born in other state (%)
Place of birth - Born in other state (%) - White
Place of birth - Born in other state (%) - Black or African American
Place of birth - Born in other state (%) - Asian
Place of birth - Born in other state (%) - Hispanic or Latino
Place of birth - Born in other state (%) - American Indian and Alaska Native
Place of birth - Born in other state (%) - Multirace
Place of birth - Born in other state (%) - Other Race
Place of birth - Native, outside of US (%)
Place of birth - Native, outside of US (%) - White
Place of birth - Native, outside of US (%) - Black or African American
Place of birth - Native, outside of US (%) - Asian
Place of birth - Native, outside of US (%) - Hispanic or Latino
Place of birth - Native, outside of US (%) - American Indian and Alaska Native
Place of birth - Native, outside of US (%) - Multirace
Place of birth - Native, outside of US (%) - Other Race
Place of birth - Foreign born (%)
Place of birth - Foreign born (%) - White
Place of birth - Foreign born (%) - Black or African American
Place of birth - Foreign born (%) - Asian
Place of birth - Foreign born (%) - Hispanic or Latino
Place of birth - Foreign born (%) - American Indian and Alaska Native
Place of birth - Foreign born (%) - Multirace
Place of birth - Foreign born (%) - Other Race
Residents speaking English at home (%)
Residents speaking English at home - Born in the United States (%)
Residents speaking English at home - Native, born elsewhere (%)
Residents speaking English at home - Foreign born (%)
Residents speaking Spanish at home (%)
Residents speaking Spanish at home - Born in the United States (%)
Residents speaking Spanish at home - Native, born elsewhere (%)
Residents speaking Spanish at home - Foreign born (%)
Residents speaking other language at home (%)
Residents speaking other language at home - Born in the United States (%)
Residents speaking other language at home - Native, born elsewhere (%)
Residents speaking other language at home - Foreign born (%)
Marital status - Never married (%)
Marital status - Now married (%)
Marital status - Separated (%)
Marital status - Widowed (%)
Marital status - Divorced (%)
Ancestries Reported - Arab (%)
Ancestries Reported - Czech (%)
Ancestries Reported - Danish (%)
Ancestries Reported - Dutch (%)
Ancestries Reported - English (%)
Ancestries Reported - French (%)
Ancestries Reported - French Canadian (%)
Ancestries Reported - German (%)
Ancestries Reported - Greek (%)
Ancestries Reported - Hungarian (%)
Ancestries Reported - Irish (%)
Ancestries Reported - Italian (%)
Ancestries Reported - Lithuanian (%)
Ancestries Reported - Norwegian (%)
Ancestries Reported - Polish (%)
Ancestries Reported - Portuguese (%)
Ancestries Reported - Russian (%)
Ancestries Reported - Scotch-Irish (%)
Ancestries Reported - Scottish (%)
Ancestries Reported - Slovak (%)
Ancestries Reported - Subsaharan African (%)
Ancestries Reported - Swedish (%)
Ancestries Reported - Swiss (%)
Ancestries Reported - Ukrainian (%)
Ancestries Reported - United States (%)
Ancestries Reported - Welsh (%)
Ancestries Reported - West Indian (%)
Ancestries Reported - Other (%)
Geographical mobility - Same house 1 year ago (%)
Geographical mobility - Same house 1 year ago (%) - White
Geographical mobility - Same house 1 year ago (%) - Black or African American
Geographical mobility - Same house 1 year ago (%) - Asian
Geographical mobility - Same house 1 year ago (%) - Hispanic or Latino
Geographical mobility - Same house 1 year ago (%) - American Indian and Alaska Native
Geographical mobility - Same house 1 year ago (%) - Multirace
Geographical mobility - Same house 1 year ago (%) - Other Race
Geographical mobility - Moved within same county (%)
Geographical mobility - Moved within same county (%) - White
Geographical mobility - Moved within same county (%) - Black or African American
Geographical mobility - Moved within same county (%) - Asian
Geographical mobility - Moved within same county (%) - Hispanic or Latino
Geographical mobility - Moved within same county (%) - American Indian and Alaska Native
Geographical mobility - Moved within same county (%) - Multirace
Geographical mobility - Moved within same county (%) - Other Race
Geographical mobility - Moved from different county within same state (%)
Geographical mobility - Moved from different county within same state (%) - White
Geographical mobility - Moved from different county within same state (%) - Black or African American
Geographical mobility - Moved from different county within same state (%) - Asian
Geographical mobility - Moved from different county within same state (%) - Hispanic or Latino
Geographical mobility - Moved from different county within same state (%) - American Indian and Alaska Native
Geographical mobility - Moved from different county within same state (%) - Multirace
Geographical mobility - Moved from different county within same state (%) - Other Race
Geographical mobility - Moved from different state (%)
Geographical mobility - Moved from different state (%) - White
Geographical mobility - Moved from different state (%) - Black or African American
Geographical mobility - Moved from different state (%) - Asian
Geographical mobility - Moved from different state (%) - Hispanic or Latino
Geographical mobility - Moved from different state (%) - American Indian and Alaska Native
Geographical mobility - Moved from different state (%) - Multirace
Geographical mobility - Moved from different state (%) - Other Race
Geographical mobility - Moved from abroad (%)
Geographical mobility - Moved from abroad (%) - White
Geographical mobility - Moved from abroad (%) - Black or African American
Geographical mobility - Moved from abroad (%) - Asian
Geographical mobility - Moved from abroad (%) - Hispanic or Latino
Geographical mobility - Moved from abroad (%) - American Indian and Alaska Native
Geographical mobility - Moved from abroad (%) - Multirace
Geographical mobility - Moved from abroad (%) - Other Race
Place of birth for the foreign-born population - Ireland (%)
Place of birth for the foreign-born population - Denmark (%)
Place of birth for the foreign-born population - Norway (%)
Place of birth for the foreign-born population - Sweden (%)
Place of birth for the foreign-born population - United Kingdom (%)
Place of birth for the foreign-born population - England (%)
Place of birth for the foreign-born population - Scotland (%)
Place of birth for the foreign-born population - Other Northern Europe (%)
Place of birth for the foreign-born population - Austria (%)
Place of birth for the foreign-born population - Belgium (%)
Place of birth for the foreign-born population - France (%)
Place of birth for the foreign-born population - Germany (%)
Place of birth for the foreign-born population - Netherlands (%)
Place of birth for the foreign-born population - Switzerland (%)
Place of birth for the foreign-born population - Other Western Europe (%)
Place of birth for the foreign-born population - Greece (%)
Place of birth for the foreign-born population - Italy (%)
Place of birth for the foreign-born population - Portugal (%)
Place of birth for the foreign-born population - Spain (%)
Place of birth for the foreign-born population - Other Southern Europe (%)
Place of birth for the foreign-born population - Albania (%)
Place of birth for the foreign-born population - Belarus (%)
Place of birth for the foreign-born population - Bosnia and Herzegovina (%)
Place of birth for the foreign-born population - Bulgaria (%)
Place of birth for the foreign-born population - Croatia (%)
Place of birth for the foreign-born population - Czechoslovakia (%)
Place of birth for the foreign-born population - Hungary (%)
Place of birth for the foreign-born population - Latvia (%)
Place of birth for the foreign-born population - Lithuania (%)
Place of birth for the foreign-born population - North Macedonia (Macedonia) (%)
Place of birth for the foreign-born population - Moldova (%)
Place of birth for the foreign-born population - Poland (%)
Place of birth for the foreign-born population - Romania (%)
Place of birth for the foreign-born population - Russia (%)
Place of birth for the foreign-born population - Serbia (%)
Place of birth for the foreign-born population - Ukraine (%)
Place of birth for the foreign-born population - Other Eastern Europe (%)
Place of birth for the foreign-born population - China (%)
Place of birth for the foreign-born population - Hong Kong (%)
Place of birth for the foreign-born population - Taiwan (%)
Place of birth for the foreign-born population - Japan (%)
Place of birth for the foreign-born population - Korea (%)
Place of birth for the foreign-born population - Other Eastern Asia (%)
Place of birth for the foreign-born population - Afghanistan (%)
Place of birth for the foreign-born population - Bangladesh (%)
Place of birth for the foreign-born population - India (%)
Place of birth for the foreign-born population - Iran (%)
Place of birth for the foreign-born population - Kazakhstan (%)
Place of birth for the foreign-born population - Nepal (%)
Place of birth for the foreign-born population - Pakistan (%)
Place of birth for the foreign-born population - Sri Lanka (%)
Place of birth for the foreign-born population - Uzbekistan (%)
Place of birth for the foreign-born population - Other South Central Asia (%)
Place of birth for the foreign-born population - Burma (%)
Place of birth for the foreign-born population - Cambodia (%)
Place of birth for the foreign-born population - Indonesia (%)
Place of birth for the foreign-born population - Laos (%)
Place of birth for the foreign-born population - Malaysia (%)
Place of birth for the foreign-born population - Philippines (%)
Place of birth for the foreign-born population - Singapore (%)
Place of birth for the foreign-born population - Thailand (%)
Place of birth for the foreign-born population - Vietnam (%)
Place of birth for the foreign-born population - Other South Eastern Asia (%)
Place of birth for the foreign-born population - Armenia (%)
Place of birth for the foreign-born population - Iraq (%)
Place of birth for the foreign-born population - Israel (%)
Place of birth for the foreign-born population - Jordan (%)
Place of birth for the foreign-born population - Kuwait (%)
Place of birth for the foreign-born population - Lebanon (%)
Place of birth for the foreign-born population - Saudi Arabia (%)
Place of birth for the foreign-born population - Syria (%)
Place of birth for the foreign-born population - Turkey (%)
Place of birth for the foreign-born population - Yemen (%)
Place of birth for the foreign-born population - Other Western Asia (%)
Place of birth for the foreign-born population - Eritrea (%)
Place of birth for the foreign-born population - Ethiopia (%)
Place of birth for the foreign-born population - Kenya (%)
Place of birth for the foreign-born population - Somalia (%)
Place of birth for the foreign-born population - Uganda (%)
Place of birth for the foreign-born population - Zimbabwe (%)
Place of birth for the foreign-born population - Other Eastern Africa (%)
Place of birth for the foreign-born population - Cameroon (%)
Place of birth for the foreign-born population - Congo (%)
Place of birth for the foreign-born population - Democratic Republic of Congo (Zaire) (%)
Place of birth for the foreign-born population - Other Middle Africa (%)
Place of birth for the foreign-born population - Egypt (%)
Place of birth for the foreign-born population - Morocco (%)
Place of birth for the foreign-born population - Sudan (%)
Place of birth for the foreign-born population - Other Northern Africa (%)
Place of birth for the foreign-born population - South Africa (%)
Place of birth for the foreign-born population - Other Southern Africa (%)
Place of birth for the foreign-born population - Cabo Verde (%)
Place of birth for the foreign-born population - Ghana (%)
Place of birth for the foreign-born population - Liberia (%)
Place of birth for the foreign-born population - Nigeria (%)
Place of birth for the foreign-born population - Senegal (%)
Place of birth for the foreign-born population - Sierra Leone (%)
Place of birth for the foreign-born population - Other Western Africa (%)
Place of birth for the foreign-born population - Australia (%)
Place of birth for the foreign-born population - New Zealand (%)
Place of birth for the foreign-born population - Fiji (%)
Place of birth for the foreign-born population - Micronesia (%)
Place of birth for the foreign-born population - Bahamas (%)
Place of birth for the foreign-born population - Barbados (%)
Place of birth for the foreign-born population - Cuba (%)
Place of birth for the foreign-born population - Dominica (%)
Place of birth for the foreign-born population - Dominican Republic (%)
Place of birth for the foreign-born population - Grenada (%)
Place of birth for the foreign-born population - Haiti (%)
Place of birth for the foreign-born population - Jamaica (%)
Place of birth for the foreign-born population - St. Vincent and the Grenadines (%)
Place of birth for the foreign-born population - Trinidad and Tobago (%)
Place of birth for the foreign-born population - West Indies (%)
Place of birth for the foreign-born population - Other Caribbean (%)
Place of birth for the foreign-born population - Belize (%)
Place of birth for the foreign-born population - Costa Rica (%)
Place of birth for the foreign-born population - El Salvador (%)
Place of birth for the foreign-born population - Guatemala (%)
Place of birth for the foreign-born population - Honduras (%)
Place of birth for the foreign-born population - Mexico (%)
Place of birth for the foreign-born population - Nicaragua (%)
Place of birth for the foreign-born population - Panama (%)
Place of birth for the foreign-born population - Other Central America (%)
Place of birth for the foreign-born population - Argentina (%)
Place of birth for the foreign-born population - Bolivia (%)
Place of birth for the foreign-born population - Brazil (%)
Place of birth for the foreign-born population - Chile (%)
Place of birth for the foreign-born population - Colombia (%)
Place of birth for the foreign-born population - Ecuador (%)
Place of birth for the foreign-born population - Guyana (%)
Place of birth for the foreign-born population - Peru (%)
Place of birth for the foreign-born population - Uruguay (%)
Place of birth for the foreign-born population - Venezuela (%)
Place of birth for the foreign-born population - Other South America (%)
Place of birth for the foreign-born population - Canada (%)
Place of birth for the foreign-born population - Other Northern America (%)
Place of birth for the foreign-born population - Other (%)
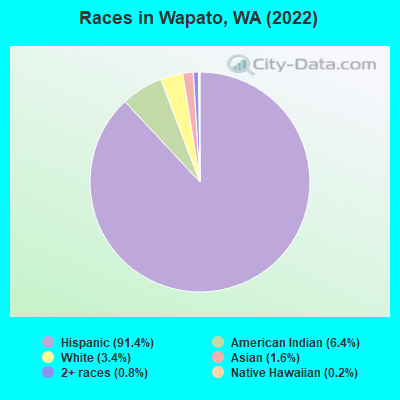
According to 2022 data, the most numerous races in Wapato, WA are White alone (155 residents), Hispanic (4,216 residents), and Asian alone (75 residents). 20.6% of Wapato residents speak English at home. 34.1% of Wapato, WA residents are foreign-born (31.5% born in Latin America), which is 56.0% greater than the foreign-born rate of 15.0% across the entire state of Washington.
Race distribution in Wapato
2000 2022
4,652,490 78.9% White alone 441,509 7.5% Hispanic 319,401 5.4% Asian alone 184,631 3.1% Black alone 175,926 3.0% Two or more races 85,396 1.4% American Indian alone 22,779 0.4% Native Hawaiian and Other 11,989 0.2% Other race alone
4,941,456 63.5% White alone 1,093,313 14.0% Hispanic 755,832 9.7% Asian alone 523,448 6.7% Two or more races 299,537 3.8% Black alone 69,024 0.9% American Indian alone 52,231 0.7% Native Hawaiian and Other 50,945 0.7% Other race alone
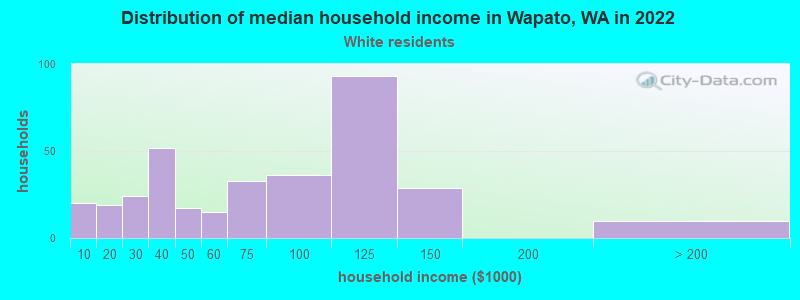
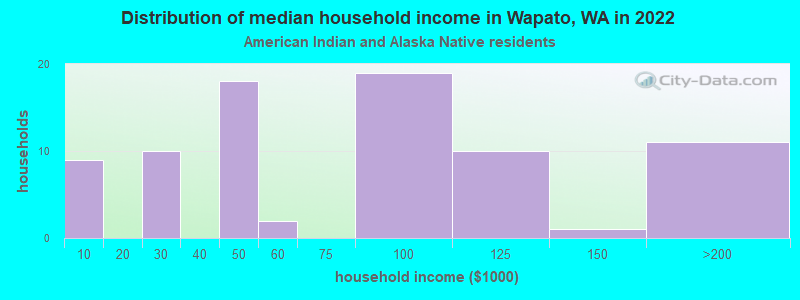
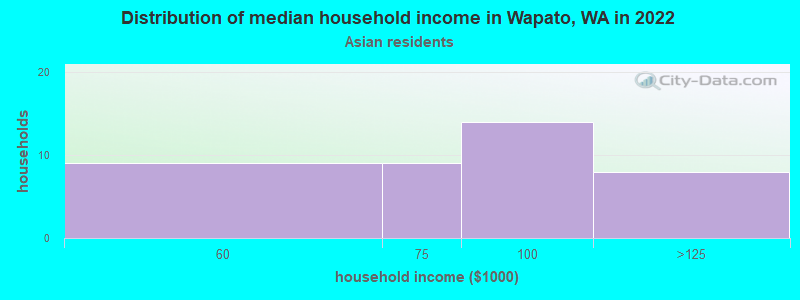
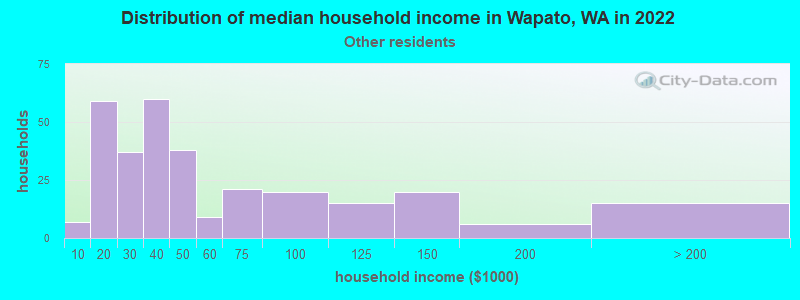
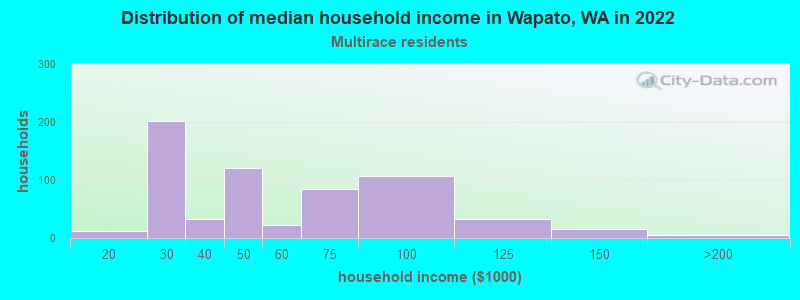
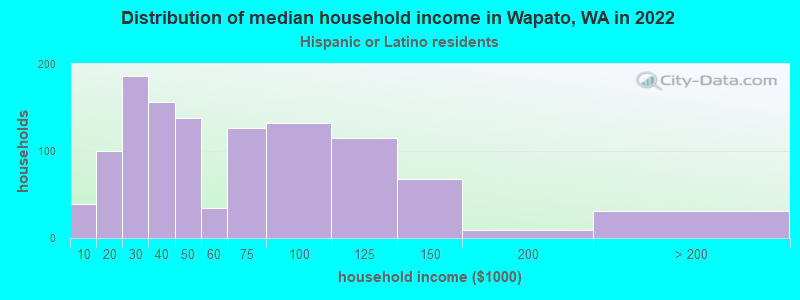
Income and house value in Wapato Median household income in 2022 $49,611 American Indian and Alaska Native householders$98,770 Asian householders$37,460 Some other race householders$42,256 Two or more races householders$46,769 Hispanic or Latino race householdersMedian 2022 house value $160,758 White Non-Hispanic householders$129,310 American Indian or Alaska Native householders $181,862 Asian householders$168,620 Some other race householders$151,448 Two or more races householders$175,862 Hispanic or Latino householders
Median age by race in Wapato
26.8 Median age for White residents26.8 27.1 -694,779,115.8 Median age for Black or African American residents-684,418,145.3 -711,934,155.7 28.9 Median age for American Indian / Alaska Native residents22.9 29.7 39.5 Median age for Asian residents60.5 24.6 -681,388,011.9 Median age for Native Hawaiian / Pacific Islander residents-696,774,192.9 -666,666,666.0 27.4 Median age for Other race residents31.7 26.3 24.6 Median age for Two or more races residents32.5 21.2 69.4 Median age for White alone residents64.2 72.4 24.5 Median age for Hispanic or Latino residents25.5 23.4
Owner/renter occupied households by race in Wapato
House owners and renters - White residents 190 52.7% Owner occupied170 47.3% Renter occupiedHouse owners and renters - American Indian / Alaska Native residents 62 68.4% Owner occupied29 31.6% Renter occupiedHouse owners and renters - Asian residents 25 75.8% Owner occupied8 24.2% Renter occupiedHouse owners and renters - Native Hawaiian / Pacific Islander residents 7 100.0% Renter occupiedHouse owners and renters - Other race residents 147 52.4% Owner occupied134 47.6% Renter occupiedHouse owners and renters - Two or more races residents 348 51.8% Owner occupied324 48.2% Renter occupiedHouse owners and renters - White alone residents 31 100.0% Owner occupiedHouse owners and renters - Hispanic or Latino residents 580 49.9% Owner occupied583 50.1% Renter occupied
Language usage in Wapato
English speakers - Total 20.6% of residents of Wapato speak English at home.
76.7% of residents speak Spanish at home 1,651 51.0% Speak English very well1,586 49.0% Speak English less than very well4.5% of residents speak other language at home 162 85.7% Speak English very well27 14.3% Speak English less than very well
English speakers - Born in the United States 25.1% of residents of Wapato speak English at home.
90.2% of residents speak Spanish at home 497 98.2% Speak English very well9 1.8% Speak English less than very well2.0% of residents speak other language at home 11 100.0% Speak English very well
English speakers - Native, born elsewhere 14.3% of residents of Wapato speak English at home.
75.0% of residents speak Spanish at home 8 38.1% Speak English very well13 61.9% Speak English less than very well
English speakers - Foreign-born 3.0% of residents of Wapato speak English at home.
93.1% of residents speak Spanish at home 226 15.9% Speak English very well1,194 84.1% Speak English less than very well3.8% of residents speak other language at home 38 65.5% Speak English very well20 34.5% Speak English less than very well
White (Caucasian) - Speak only English Native:
38.5% (308)Foreign-born:
3.3% (15)
White (Caucasian) - Speak another language Native:
33.2% (266)Foreign-born:
93.1% (429)
American Indian / Alaska Native - Speak another language Native:
59.3% (221)Foreign-born:
53.8% (7)
Native Hawaiian / Pacific Islander - Speak another language Native:
100.0% (1)Foreign-born:
96.0% (6)
Other race - Speak only English Native:
17.2% (89)Foreign-born:
4.8% (21)
Other race - Speak another language Native:
84.8% (439)Foreign-born:
95.1% (414)
Two or more races - Speak only English Native:
17.7% (251)Foreign-born:
1.4% (13)
Two or more races - Speak another language Native:
91.1% (1,293)Foreign-born:
98.1% (912)
Hispanic or Latino - Speak only English Native:
22.4% (526)Foreign-born:
3.8% (56)
Hispanic or Latino - Speak another language Native:
78.0% (1,830)Foreign-born:
95.6% (1,411)
Foreign-born residents in Wapato 1,575 residents are foreign born (31.5% Latin America ).
This city:
34.1%Washington:
14.9%
Marital status for residents in Wapato Marital status - White (Caucasian) population 15 years and over
Males 42.4% Never married46.0% Now married3.1% Separated2.9% Widowed5.5% DivorcedFemales 36.4% Never married42.6% Now married6.4% Separated9.3% Widowed5.3% DivorcedWomen who gave birth in the past 12 months Now married:
100.0% (17)Unmarried:
0.0% (0)
Women who did not give birth in the past 12 months Now married:
37.2% (96)Unmarried:
62.8% (162)
Marital status - American Indian / Alaska Native population 15 years and over
Males 60.3% Never married38.9% Now married0.0% Separated0.0% Widowed0.8% DivorcedFemales 58.7% Never married21.5% Now married0.0% Separated9.9% Widowed9.9% DivorcedWomen who gave birth in the past 12 months Now married:
0.0% (0)Unmarried:
100.0% (2)
Women who did not give birth in the past 12 months Now married:
19.0% (32)Unmarried:
81.0% (136)
Marital status - Asian population 15 years and over
Males 20.0% Never married70.0% Now married10.0% Separated0.0% Widowed0.0% DivorcedFemales 47.9% Never married47.9% Now married0.0% Separated4.2% Widowed0.0% DivorcedWomen who did not give birth in the past 12 months Now married:
0.0% (0)Unmarried:
100.0% (25)
Marital status - Native Hawaiian / Pacific Islander population 15 years and over
Males 100.0% Never married0.0% Now married0.0% Separated0.0% Widowed0.0% DivorcedFemales 0.0% Never married0.0% Now married0.0% Separated0.0% Widowed100.0% DivorcedWomen who did not give birth in the past 12 months Now married:
0.0% (0)Unmarried:
100.0% (6)
Marital status - Other race population 15 years and over
Males 50.5% Never married42.9% Now married3.3% Separated1.9% Widowed1.4% DivorcedFemales 42.0% Never married38.6% Now married2.6% Separated3.2% Widowed13.6% DivorcedWomen who gave birth in the past 12 months Now married:
53.8% (8)Unmarried:
46.2% (7)
Women who did not give birth in the past 12 months Now married:
39.8% (112)Unmarried:
60.2% (169)
Marital status - Two or more races population 15 years and over
Males 57.5% Never married30.2% Now married1.6% Separated3.3% Widowed7.5% DivorcedFemales 45.0% Never married37.5% Now married7.2% Separated3.7% Widowed6.5% DivorcedWomen who gave birth in the past 12 months Now married:
100.0% (36)Unmarried:
0.0% (0)
Women who did not give birth in the past 12 months Now married:
43.2% (226)Unmarried:
56.8% (297)
Marital status - White alone, not Hispanic / Latino population 15 years and over
Males 30.4% Never married27.8% Now married1.3% Separated21.5% Widowed19.0% DivorcedFemales 0.0% Never married39.5% Now married5.3% Separated43.4% Widowed11.8% DivorcedWomen who did not give birth in the past 12 months Now married:
100.0% (12)Unmarried:
0.0% (0)
Marital status - Hispanic or Latino population 15 years and over
Males 50.0% Never married41.2% Now married2.6% Separated1.8% Widowed4.4% DivorcedFemales 43.6% Never married38.5% Now married5.5% Separated4.4% Widowed8.0% DivorcedWomen who gave birth in the past 12 months Now married:
89.7% (54)Unmarried:
10.3% (6)
Women who did not give birth in the past 12 months Now married:
37.7% (370)Unmarried:
62.3% (612)
Ancestries in Wapato
17 0.4% American12 0.3% Italian8 0.2% English8 0.2% German7 0.2% Irish4 0.10% Canadian1 0.02% European
Children Nativity (place of birth) in Wapato
Children under 6 years - Living with two parents Both parents native 14 100.0% NativeBoth parents foreign-born 117 100.0% NativeOne native, one foreign-born parent 102 100.0% NativeChildren under 6 years - Living with one parent Native parent 129 100.0% NativeForeign-born parent 119 90.2% Native13 9.8% Foreign-bornChildren 6 to 17 years - Living with two parents Both parents native 7 83.2% Native1 16.8% Foreign-bornBoth parents foreign-born 455 95.7% Native20 4.3% Foreign-bornOne native, one foreign-born parent 75 100.0% NativeChildren 6 to 17 years - Living with one parent Native parent 239 100.0% NativeForeign-born parent 296 51.3% Native281 48.7% Foreign-born
Place of birth for residents in Wapato 1,507 Americas1,507 Latin America1,507 Central America62 Asia62 South Eastern Asia6 Oceania
Grandparents responsible for own grandchildren in Wapato
Grandparents (30 to 59 years) White / Caucasian 1 4.5% Responsible for grandchildren27 95.5% Not responsible for grandchildrenAmerican Indian / Alaska Native 11 100.0% Responsible for grandchildrenAsian 18 100.0% Not responsible for grandchildrenOther race 63 100.0% Not responsible for grandchildrenTwo or more races 12 100.0% Not responsible for grandchildrenWhite alone, not Hispanic / Latino 9 100.0% Not responsible for grandchildrenHispanic or Latino 1 1.8% Responsible for grandchildren66 98.2% Not responsible for grandchildrenGrandparents (60 years and over) White / Caucasian 16 100.0% Not responsible for grandchildrenAmerican Indian / Alaska Native 6 100.0% Responsible for grandchildrenOther race 5 100.0% Not responsible for grandchildrenHispanic or Latino 3 17.3% Responsible for grandchildren16 82.7% Not responsible for grandchildren