Races in Walton Park, New York (NY) Detailed Stats
Data:
Races - White alone (%)
Races - White alone (% change since 2000)
Races - Black alone (%)
Races - Black alone (% change since 2000)
Races - American Indian alone (%)
Races - American Indian alone (% change since 2000)
Races - Asian alone (%)
Races - Asian alone (% change since 2000)
Races - Hispanic (%)
Races - Hispanic (% change since 2000)
Races - Native Hawaiian and Other Pacific Islander alone (%)
Races - Native Hawaiian and Other Pacific Islander alone (% change since 2000)
Races - Two or more races(%)
Races - Two or more races(% change since 2000)
Races - Other race alone (%)
Races - Other race alone (% change since 2000)
Racial diversity
Place of birth - Born in state of residence (%)
Place of birth - Born in state of residence (%) - White
Place of birth - Born in state of residence (%) - Black or African American
Place of birth - Born in state of residence (%) - Asian
Place of birth - Born in state of residence (%) - Hispanic or Latino
Place of birth - Born in state of residence (%) - American Indian and Alaska Native
Place of birth - Born in state of residence (%) - Multirace
Place of birth - Born in state of residence (%) - Other Race
Place of birth - Born in other state (%)
Place of birth - Born in other state (%) - White
Place of birth - Born in other state (%) - Black or African American
Place of birth - Born in other state (%) - Asian
Place of birth - Born in other state (%) - Hispanic or Latino
Place of birth - Born in other state (%) - American Indian and Alaska Native
Place of birth - Born in other state (%) - Multirace
Place of birth - Born in other state (%) - Other Race
Place of birth - Native, outside of US (%)
Place of birth - Native, outside of US (%) - White
Place of birth - Native, outside of US (%) - Black or African American
Place of birth - Native, outside of US (%) - Asian
Place of birth - Native, outside of US (%) - Hispanic or Latino
Place of birth - Native, outside of US (%) - American Indian and Alaska Native
Place of birth - Native, outside of US (%) - Multirace
Place of birth - Native, outside of US (%) - Other Race
Place of birth - Foreign born (%)
Place of birth - Foreign born (%) - White
Place of birth - Foreign born (%) - Black or African American
Place of birth - Foreign born (%) - Asian
Place of birth - Foreign born (%) - Hispanic or Latino
Place of birth - Foreign born (%) - American Indian and Alaska Native
Place of birth - Foreign born (%) - Multirace
Place of birth - Foreign born (%) - Other Race
Residents speaking English at home (%)
Residents speaking English at home - Born in the United States (%)
Residents speaking English at home - Native, born elsewhere (%)
Residents speaking English at home - Foreign born (%)
Residents speaking Spanish at home (%)
Residents speaking Spanish at home - Born in the United States (%)
Residents speaking Spanish at home - Native, born elsewhere (%)
Residents speaking Spanish at home - Foreign born (%)
Residents speaking other language at home (%)
Residents speaking other language at home - Born in the United States (%)
Residents speaking other language at home - Native, born elsewhere (%)
Residents speaking other language at home - Foreign born (%)
Marital status - Never married (%)
Marital status - Now married (%)
Marital status - Separated (%)
Marital status - Widowed (%)
Marital status - Divorced (%)
Ancestries Reported - Arab (%)
Ancestries Reported - Czech (%)
Ancestries Reported - Danish (%)
Ancestries Reported - Dutch (%)
Ancestries Reported - English (%)
Ancestries Reported - French (%)
Ancestries Reported - French Canadian (%)
Ancestries Reported - German (%)
Ancestries Reported - Greek (%)
Ancestries Reported - Hungarian (%)
Ancestries Reported - Irish (%)
Ancestries Reported - Italian (%)
Ancestries Reported - Lithuanian (%)
Ancestries Reported - Norwegian (%)
Ancestries Reported - Polish (%)
Ancestries Reported - Portuguese (%)
Ancestries Reported - Russian (%)
Ancestries Reported - Scotch-Irish (%)
Ancestries Reported - Scottish (%)
Ancestries Reported - Slovak (%)
Ancestries Reported - Subsaharan African (%)
Ancestries Reported - Swedish (%)
Ancestries Reported - Swiss (%)
Ancestries Reported - Ukrainian (%)
Ancestries Reported - United States (%)
Ancestries Reported - Welsh (%)
Ancestries Reported - West Indian (%)
Ancestries Reported - Other (%)
Geographical mobility - Same house 1 year ago (%)
Geographical mobility - Same house 1 year ago (%) - White
Geographical mobility - Same house 1 year ago (%) - Black or African American
Geographical mobility - Same house 1 year ago (%) - Asian
Geographical mobility - Same house 1 year ago (%) - Hispanic or Latino
Geographical mobility - Same house 1 year ago (%) - American Indian and Alaska Native
Geographical mobility - Same house 1 year ago (%) - Multirace
Geographical mobility - Same house 1 year ago (%) - Other Race
Geographical mobility - Moved within same county (%)
Geographical mobility - Moved within same county (%) - White
Geographical mobility - Moved within same county (%) - Black or African American
Geographical mobility - Moved within same county (%) - Asian
Geographical mobility - Moved within same county (%) - Hispanic or Latino
Geographical mobility - Moved within same county (%) - American Indian and Alaska Native
Geographical mobility - Moved within same county (%) - Multirace
Geographical mobility - Moved within same county (%) - Other Race
Geographical mobility - Moved from different county within same state (%)
Geographical mobility - Moved from different county within same state (%) - White
Geographical mobility - Moved from different county within same state (%) - Black or African American
Geographical mobility - Moved from different county within same state (%) - Asian
Geographical mobility - Moved from different county within same state (%) - Hispanic or Latino
Geographical mobility - Moved from different county within same state (%) - American Indian and Alaska Native
Geographical mobility - Moved from different county within same state (%) - Multirace
Geographical mobility - Moved from different county within same state (%) - Other Race
Geographical mobility - Moved from different state (%)
Geographical mobility - Moved from different state (%) - White
Geographical mobility - Moved from different state (%) - Black or African American
Geographical mobility - Moved from different state (%) - Asian
Geographical mobility - Moved from different state (%) - Hispanic or Latino
Geographical mobility - Moved from different state (%) - American Indian and Alaska Native
Geographical mobility - Moved from different state (%) - Multirace
Geographical mobility - Moved from different state (%) - Other Race
Geographical mobility - Moved from abroad (%)
Geographical mobility - Moved from abroad (%) - White
Geographical mobility - Moved from abroad (%) - Black or African American
Geographical mobility - Moved from abroad (%) - Asian
Geographical mobility - Moved from abroad (%) - Hispanic or Latino
Geographical mobility - Moved from abroad (%) - American Indian and Alaska Native
Geographical mobility - Moved from abroad (%) - Multirace
Geographical mobility - Moved from abroad (%) - Other Race
Place of birth for the foreign-born population - Ireland (%)
Place of birth for the foreign-born population - Denmark (%)
Place of birth for the foreign-born population - Norway (%)
Place of birth for the foreign-born population - Sweden (%)
Place of birth for the foreign-born population - United Kingdom (%)
Place of birth for the foreign-born population - England (%)
Place of birth for the foreign-born population - Scotland (%)
Place of birth for the foreign-born population - Other Northern Europe (%)
Place of birth for the foreign-born population - Austria (%)
Place of birth for the foreign-born population - Belgium (%)
Place of birth for the foreign-born population - France (%)
Place of birth for the foreign-born population - Germany (%)
Place of birth for the foreign-born population - Netherlands (%)
Place of birth for the foreign-born population - Switzerland (%)
Place of birth for the foreign-born population - Other Western Europe (%)
Place of birth for the foreign-born population - Greece (%)
Place of birth for the foreign-born population - Italy (%)
Place of birth for the foreign-born population - Portugal (%)
Place of birth for the foreign-born population - Spain (%)
Place of birth for the foreign-born population - Other Southern Europe (%)
Place of birth for the foreign-born population - Albania (%)
Place of birth for the foreign-born population - Belarus (%)
Place of birth for the foreign-born population - Bosnia and Herzegovina (%)
Place of birth for the foreign-born population - Bulgaria (%)
Place of birth for the foreign-born population - Croatia (%)
Place of birth for the foreign-born population - Czechoslovakia (%)
Place of birth for the foreign-born population - Hungary (%)
Place of birth for the foreign-born population - Latvia (%)
Place of birth for the foreign-born population - Lithuania (%)
Place of birth for the foreign-born population - North Macedonia (Macedonia) (%)
Place of birth for the foreign-born population - Moldova (%)
Place of birth for the foreign-born population - Poland (%)
Place of birth for the foreign-born population - Romania (%)
Place of birth for the foreign-born population - Russia (%)
Place of birth for the foreign-born population - Serbia (%)
Place of birth for the foreign-born population - Ukraine (%)
Place of birth for the foreign-born population - Other Eastern Europe (%)
Place of birth for the foreign-born population - China (%)
Place of birth for the foreign-born population - Hong Kong (%)
Place of birth for the foreign-born population - Taiwan (%)
Place of birth for the foreign-born population - Japan (%)
Place of birth for the foreign-born population - Korea (%)
Place of birth for the foreign-born population - Other Eastern Asia (%)
Place of birth for the foreign-born population - Afghanistan (%)
Place of birth for the foreign-born population - Bangladesh (%)
Place of birth for the foreign-born population - India (%)
Place of birth for the foreign-born population - Iran (%)
Place of birth for the foreign-born population - Kazakhstan (%)
Place of birth for the foreign-born population - Nepal (%)
Place of birth for the foreign-born population - Pakistan (%)
Place of birth for the foreign-born population - Sri Lanka (%)
Place of birth for the foreign-born population - Uzbekistan (%)
Place of birth for the foreign-born population - Other South Central Asia (%)
Place of birth for the foreign-born population - Burma (%)
Place of birth for the foreign-born population - Cambodia (%)
Place of birth for the foreign-born population - Indonesia (%)
Place of birth for the foreign-born population - Laos (%)
Place of birth for the foreign-born population - Malaysia (%)
Place of birth for the foreign-born population - Philippines (%)
Place of birth for the foreign-born population - Singapore (%)
Place of birth for the foreign-born population - Thailand (%)
Place of birth for the foreign-born population - Vietnam (%)
Place of birth for the foreign-born population - Other South Eastern Asia (%)
Place of birth for the foreign-born population - Armenia (%)
Place of birth for the foreign-born population - Iraq (%)
Place of birth for the foreign-born population - Israel (%)
Place of birth for the foreign-born population - Jordan (%)
Place of birth for the foreign-born population - Kuwait (%)
Place of birth for the foreign-born population - Lebanon (%)
Place of birth for the foreign-born population - Saudi Arabia (%)
Place of birth for the foreign-born population - Syria (%)
Place of birth for the foreign-born population - Turkey (%)
Place of birth for the foreign-born population - Yemen (%)
Place of birth for the foreign-born population - Other Western Asia (%)
Place of birth for the foreign-born population - Eritrea (%)
Place of birth for the foreign-born population - Ethiopia (%)
Place of birth for the foreign-born population - Kenya (%)
Place of birth for the foreign-born population - Somalia (%)
Place of birth for the foreign-born population - Uganda (%)
Place of birth for the foreign-born population - Zimbabwe (%)
Place of birth for the foreign-born population - Other Eastern Africa (%)
Place of birth for the foreign-born population - Cameroon (%)
Place of birth for the foreign-born population - Congo (%)
Place of birth for the foreign-born population - Democratic Republic of Congo (Zaire) (%)
Place of birth for the foreign-born population - Other Middle Africa (%)
Place of birth for the foreign-born population - Egypt (%)
Place of birth for the foreign-born population - Morocco (%)
Place of birth for the foreign-born population - Sudan (%)
Place of birth for the foreign-born population - Other Northern Africa (%)
Place of birth for the foreign-born population - South Africa (%)
Place of birth for the foreign-born population - Other Southern Africa (%)
Place of birth for the foreign-born population - Cabo Verde (%)
Place of birth for the foreign-born population - Ghana (%)
Place of birth for the foreign-born population - Liberia (%)
Place of birth for the foreign-born population - Nigeria (%)
Place of birth for the foreign-born population - Senegal (%)
Place of birth for the foreign-born population - Sierra Leone (%)
Place of birth for the foreign-born population - Other Western Africa (%)
Place of birth for the foreign-born population - Australia (%)
Place of birth for the foreign-born population - New Zealand (%)
Place of birth for the foreign-born population - Fiji (%)
Place of birth for the foreign-born population - Micronesia (%)
Place of birth for the foreign-born population - Bahamas (%)
Place of birth for the foreign-born population - Barbados (%)
Place of birth for the foreign-born population - Cuba (%)
Place of birth for the foreign-born population - Dominica (%)
Place of birth for the foreign-born population - Dominican Republic (%)
Place of birth for the foreign-born population - Grenada (%)
Place of birth for the foreign-born population - Haiti (%)
Place of birth for the foreign-born population - Jamaica (%)
Place of birth for the foreign-born population - St. Vincent and the Grenadines (%)
Place of birth for the foreign-born population - Trinidad and Tobago (%)
Place of birth for the foreign-born population - West Indies (%)
Place of birth for the foreign-born population - Other Caribbean (%)
Place of birth for the foreign-born population - Belize (%)
Place of birth for the foreign-born population - Costa Rica (%)
Place of birth for the foreign-born population - El Salvador (%)
Place of birth for the foreign-born population - Guatemala (%)
Place of birth for the foreign-born population - Honduras (%)
Place of birth for the foreign-born population - Mexico (%)
Place of birth for the foreign-born population - Nicaragua (%)
Place of birth for the foreign-born population - Panama (%)
Place of birth for the foreign-born population - Other Central America (%)
Place of birth for the foreign-born population - Argentina (%)
Place of birth for the foreign-born population - Bolivia (%)
Place of birth for the foreign-born population - Brazil (%)
Place of birth for the foreign-born population - Chile (%)
Place of birth for the foreign-born population - Colombia (%)
Place of birth for the foreign-born population - Ecuador (%)
Place of birth for the foreign-born population - Guyana (%)
Place of birth for the foreign-born population - Peru (%)
Place of birth for the foreign-born population - Uruguay (%)
Place of birth for the foreign-born population - Venezuela (%)
Place of birth for the foreign-born population - Other South America (%)
Place of birth for the foreign-born population - Canada (%)
Place of birth for the foreign-born population - Other Northern America (%)
Place of birth for the foreign-born population - Other (%)
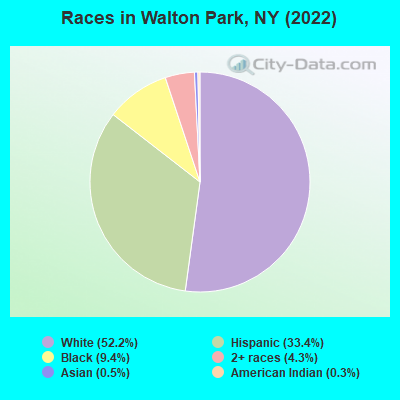
According to 2022 data, the most numerous races in Walton Park, NY are White alone (2,187 residents), Hispanic (1,400 residents), and Black alone (393 residents). 71.9% of Walton Park residents speak English at home. 16.3% of Walton Park, NY residents are foreign-born (13.3% born in Latin America, 2.6% born in Europe), which is 35.1% less than the foreign-born rate of 22.0% across the entire state of New York.
Race distribution in Walton Park
2000 2022
11,760,981 62.0% White alone 2,867,583 15.1% Hispanic 2,812,623 14.8% Black alone 1,035,926 5.5% Asian alone 366,116 1.9% Two or more races 75,499 0.4% Other race alone 52,499 0.3% American Indian alone 5,230 0.03% Native Hawaiian and Other
10,408,933 52.9% White alone 3,867,299 19.7% Hispanic 2,633,840 13.4% Black alone 1,776,286 9.0% Asian alone 732,670 3.7% Two or more races 216,110 1.1% Other race alone 35,082 0.2% American Indian alone 6,931 0.04% Native Hawaiian and Other
Income and house value in Walton Park Median household income in 2022 $126,006 White non-Hispanic householders$161,374 Some other race householders$184,078 Two or more races householders$161,095 Hispanic or Latino race householdersMedian 2022 house value $424,381 White Non-Hispanic householders $402,580 Asian householders$681,289 Some other race householders$235,354 Two or more races householders$336,185 Hispanic or Latino householders
Median age by race in Walton Park
49.5 Median age for White residents52.7 49.2 57.5 Median age for Black or African American residents33.0 65.6 -671,929,823.9 Median age for American Indian / Alaska Native residents-677,083,332.7 -603,603,603.0 9.9 Median age for Asian residents-752,567,693.0 7.3 -487,992,314.6 Median age for Native Hawaiian / Pacific Islander residents-477,502,295.2 -497,387,669.3 34.9 Median age for Other race residents34.6 39.0 31.4 Median age for Two or more races residents30.4 45.8 52.5 Median age for White alone residents52.8 51.0 31.4 Median age for Hispanic or Latino residents31.3 33.6
Owner/renter occupied households by race in Walton Park
House owners and renters - White residents 906 90.6% Owner occupied94 9.4% Renter occupiedHouse owners and renters - Black or African American residents 107 100.0% Owner occupiedHouse owners and renters - Asian residents 8 100.0% Owner occupiedHouse owners and renters - Other race residents 216 79.4% Owner occupied56 20.6% Renter occupiedHouse owners and renters - Two or more races residents 185 100.0% Owner occupiedHouse owners and renters - White alone residents 869 92.7% Owner occupied69 7.3% Renter occupiedHouse owners and renters - Hispanic or Latino residents 372 82.4% Owner occupied79 17.6% Renter occupied
Language usage in Walton Park
English speakers - Total 71.9% of residents of Walton Park speak English at home.
19.6% of residents speak Spanish at home 593 74.9% Speak English very well199 25.1% Speak English less than very well6.9% of residents speak other language at home 237 85.3% Speak English very well41 14.7% Speak English less than very well
English speakers - Born in the United States 93.1% of residents of Walton Park speak English at home.
6.3% of residents speak Spanish at home 32 100.0% Speak English less than very well5.0% of residents speak other language at home 25 100.0% Speak English very well
English speakers - Native, born elsewhere 88.9% of residents of Walton Park speak English at home.
English speakers - Foreign-born 13.2% of residents of Walton Park speak English at home.
68.0% of residents speak Spanish at home 327 64.0% Speak English very well184 36.0% Speak English less than very well18.4% of residents speak other language at home 112 81.2% Speak English very well26 18.8% Speak English less than very well
White (Caucasian) - Speak another language Native:
10.4% (233)Foreign-born:
84.6% (101)
Black or African American - Speak only English Native:
96.8% (394)Foreign-born:
71.2% (13)
Asian - Speak only English Native:
100.0% (12)Foreign-born:
100.0% (9)
Other race - Speak another language Native:
43.4% (121)Foreign-born:
97.2% (345)
Two or more races - Speak only English Native:
75.4% (232)Foreign-born:
16.0% (59)
Two or more races - Speak another language Native:
23.3% (72)Foreign-born:
74.1% (274)
White alone - Speak another language Native:
8.2% (168)Foreign-born:
91.5% (107)
Hispanic or Latino - Speak only English Native:
66.0% (483)Foreign-born:
3.8% (21)
Hispanic or Latino - Speak another language Native:
33.6% (246)Foreign-born:
96.5% (541)
Foreign-born residents in Walton Park 682 residents are foreign born (13.3% Latin America , 2.6% Europe ).
This city:
16.3%New York:
22.6%
Marital status for residents in Walton Park Marital status - White (Caucasian) population 15 years and over
Males 21.3% Never married62.3% Now married1.0% Separated0.0% Widowed15.4% DivorcedFemales 27.6% Never married57.3% Now married1.2% Separated6.1% Widowed7.7% DivorcedWomen who did not give birth in the past 12 months Now married:
37.1% (194)Unmarried:
62.9% (328)
Marital status - Black or African American population 15 years and over
Males 46.3% Never married53.7% Now married0.0% Separated0.0% Widowed0.0% DivorcedFemales 0.0% Never married100.0% Now married0.0% Separated0.0% Widowed0.0% DivorcedWomen who did not give birth in the past 12 months Now married:
100.0% (28)Unmarried:
0.0% (0)
Marital status - Asian population 15 years and over
Males 0.0% Never married100.0% Now married0.0% Separated0.0% Widowed0.0% DivorcedFemales 0.0% Never married100.0% Now married0.0% Separated0.0% Widowed0.0% DivorcedWomen who did not give birth in the past 12 months Now married:
100.0% (2)Unmarried:
0.0% (0)
Marital status - Other race population 15 years and over
Males 68.2% Never married31.8% Now married0.0% Separated0.0% Widowed0.0% DivorcedFemales 34.0% Never married38.9% Now married0.0% Separated0.0% Widowed27.2% DivorcedWomen who did not give birth in the past 12 months Now married:
47.1% (66)Unmarried:
52.9% (74)
Marital status - Two or more races population 15 years and over
Males 52.3% Never married39.0% Now married0.0% Separated8.7% Widowed0.0% DivorcedFemales 35.5% Never married20.9% Now married0.0% Separated0.0% Widowed43.6% DivorcedWomen who did not give birth in the past 12 months Now married:
37.0% (61)Unmarried:
63.0% (104)
Marital status - White alone, not Hispanic / Latino population 15 years and over
Males 16.0% Never married65.5% Now married1.2% Separated0.0% Widowed17.3% DivorcedFemales 25.5% Never married58.9% Now married1.4% Separated5.4% Widowed8.8% DivorcedWomen who did not give birth in the past 12 months Now married:
35.0% (156)Unmarried:
65.0% (290)
Marital status - Hispanic or Latino population 15 years and over
Males 66.0% Never married34.0% Now married0.0% Separated0.0% Widowed0.0% DivorcedFemales 33.7% Never married37.5% Now married0.0% Separated3.6% Widowed25.2% DivorcedWomen who did not give birth in the past 12 months Now married:
48.4% (157)Unmarried:
51.6% (167)
Ancestries in Walton Park
287 15.8% Italian266 14.6% Irish148 8.1% American148 8.1% European51 2.8% British West Indian45 2.5% Guyanese41 2.3% Polish36 2.0% Greek29 1.6% Swedish27 1.5% English27 1.5% German17 0.9% Norwegian14 0.8% Jamaican13 0.7% French Canadian13 0.7% Scottish10 0.6% Scotch-Irish9 0.5% Czech8 0.4% British7 0.4% Finnish4 0.2% Dutch
Children Nativity (place of birth) in Walton Park
Children under 6 years - Living with two parents Both parents native 68 100.0% NativeBoth parents foreign-born 4 100.0% NativeOne native, one foreign-born parent 18 100.0% NativeChildren under 6 years - Living with one parent Native parent 162 100.0% NativeChildren 6 to 17 years - Living with two parents Both parents native 166 100.0% NativeBoth parents foreign-born 92 53.7% Native80 46.3% Foreign-bornOne native, one foreign-born parent 29 100.0% NativeChildren 6 to 17 years - Living with one parent Native parent 388 100.0% Native
Grandparents responsible for own grandchildren in Walton Park
Grandparents (30 to 59 years) White / Caucasian 33 100.0% Responsible for grandchildrenWhite alone, not Hispanic / Latino 33 100.0% Responsible for grandchildren
Grandparents (60 years and over) White / Caucasian 76 100.0% Not responsible for grandchildrenWhite alone, not Hispanic / Latino 62 100.0% Not responsible for grandchildren